
The Future Arrives for Five Clean Energy
Technologies – 2016 Update
September 2016
Revolution…Now

Contributors i
Acknowledgments
Primary Author
U.S. Department of Energy
Paul Donohoo-Vallett, DOE Ofce of Energy Efciency & Renewable Energy
Contributing Authors
U.S. Department of Energy
Patrick Gilman, DOE Wind Energy Technologies Ofce
David Feldman, National Renewable Energy Laboratory
James Brodrick, DOE Building Technologies Ofce
David Gohlke, DOE Vehicle Technologies Ofce
Roland Gravel, DOE Vehicle Technologies Ofce
Amy Jiron, DOE Building Technologies Ofce
Carol Schutte, DOE Vehicle Technologies Ofce
Sunita Satyapal, DOE Fuel Cell Technologies Ofce
Tien Nguyen, DOE Fuel Cell Technologies Ofce
Paul Scheihing, DOE Advanced Manufacturing Ofce
Blake Marshall, DOE Advanced Manufacturing Ofce
Sarah Harman, DOE Ofce of Energy Efciency & Renewable Energy
Notice
This report is being disseminated by the U.S. Department of Energy (DOE). As such, this document was prepared
in compliance with Section 515 of the Treasury and General Government Appropriations Act for Fiscal Year 2001
(Public Law 106-554) and information quality guidelines issued by DOE.
Reference herein to any specic commercial product, process, or service by trade name, trademark, manufacturer,
or otherwise does not necessarily constitute or imply its endorsement, recommendation, or favoring by the United
States government or any agency thereof.

Table of Contents iii
Table of Contents
Accelerating Progress . . . . . . . . . . . . . . . . . . . . . . . . . . . . . . . . . . . . . . . . . . . . . . . . . . . . . . . . .1
Wind . . . . . . . . . . . . . . . . . . . . . . . . . . . . . . . . . . . . . . . . . . . . . . . . . . . . . . . . . . . . . . . . . . 2
Solar PV: Utility-Scale . . . . . . . . . . . . . . . . . . . . . . . . . . . . . . . . . . . . . . . . . . . . . . . . . . . . . . . . 4
Solar PV: Distributed. . . . . . . . . . . . . . . . . . . . . . . . . . . . . . . . . . . . . . . . . . . . . . . . . . . . . . . . . 6
LEDs. . . . . . . . . . . . . . . . . . . . . . . . . . . . . . . . . . . . . . . . . . . . . . . . . . . . . . . . . . . . . . . . . . . 8
Electric Vehicles . . . . . . . . . . . . . . . . . . . . . . . . . . . . . . . . . . . . . . . . . . . . . . . . . . . . . . . . . . . 10
Revolution Next. . . . . . . . . . . . . . . . . . . . . . . . . . . . . . . . . . . . . . . . . . . . . . . . . . . . . . . . . . . .12
Super Trucks . . . . . . . . . . . . . . . . . . . . . . . . . . . . . . . . . . . . . . . . . . . . . . . . . . . . . . . . . . . . 12
Smart Buildings . . . . . . . . . . . . . . . . . . . . . . . . . . . . . . . . . . . . . . . . . . . . . . . . . . . . . . . . . . 12
Lightweighting . . . . . . . . . . . . . . . . . . . . . . . . . . . . . . . . . . . . . . . . . . . . . . . . . . . . . . . . . . 13
Stacked for Success: Fuel Cells . . . . . . . . . . . . . . . . . . . . . . . . . . . . . . . . . . . . . . . . . . . . . . . . .13
ISO 50001 and the Superior Energy Performance Program in the Manufacturing Sector . . . . . . . . . . . . . . 15
Supercharging the Grid with Batteries . . . . . . . . . . . . . . . . . . . . . . . . . . . . . . . . . . . . . . . . . . . . 16
Big Area Additive Manufacturing . . . . . . . . . . . . . . . . . . . . . . . . . . . . . . . . . . . . . . . . . . . . . . . 17
Conclusion . . . . . . . . . . . . . . . . . . . . . . . . . . . . . . . . . . . . . . . . . . . . . . . . . . . . . . . . . . . . . . .18
References . . . . . . . . . . . . . . . . . . . . . . . . . . . . . . . . . . . . . . . . . . . . . . . . . . . . . . . . . . . . . . . 19
LAND-BASED WIND
Wind accounted for
41%
of all new generation capacity installed in the US in 2015
EVS
Over
490,000 EVs have
been sold through August of 2016
DISTRIBUTED SOLAR PV
The
millionth distributed photovoltaic
system was installed early in 2016
UTILITY-SCALE SOLAR PV
Revolution...Now
Accelerating Clean Energy Deployment
LEDS
Total A-Type LED bulb
installations surpassed
200 million
in 2015, more than
doubling since the
previous year
In 2015 total capacity grew
43% over 2014, reaching
nearly 14,000 MW

Accelerating Progress 1
Accelerating Progress
Decades of investments by the federal government and industry in ve key clean energy technologies are making
an impact today. The cost of land-based wind power, utility and distributed photovoltaic (PV) solar power, light
emitting diodes (LEDs), and electric vehicles (EVs) has fallen by 41% to as high as 94% since 2008. These cost
reductions have enabled widespread adoption of these technologies with deployment increasing across the board.
Combined, wind, utility-scale and distributed PV accounted for over 66% of all new capacity installed in the nation
in 2015. [6] Total installations of LED bulbs have more than doubled from last year, [5] and cumulative EV sales
are about to pass the half-million mark. [7]
These technologies are now readily available and our country has already begun to reap the benets through their
increased adoption. As these clean technologies are broadly deployed there is a reduction in the emissions that
contribute to climate change, the air we breathe is better quality because of a decline in air pollutants, and we are
expanding economic opportunities for American workers and manufacturers. In 2014 the manufacturing sectors for
wind turbines, photovoltaic panels, lithium ion batteries, and LEDs have added $3.8 billion dollars in value to the
U.S. economy. [8]
As we continue to advance international action on climate change under the Paris Agreement – which established a
long-term worldwide framework to reduce global greenhouse gas emissions – these ve technologies have and will
play a critical role in providing opportunities to reach global climate goals.
The technologies highlighted in this report exemplify how the clean energy revolution is already underway, is
already providing real-world benets, and continues to promise new solutions on the horizon to address our most
pressing energy challenges.
Through the Mission Innovation initiative announced in 2015, 20 countries and the European Union have
committed to double their respective clean energy research and development investment over ve years. This surge
will surely lead to breakthroughs in other clean energy technologies that today still seem futuristic, just as many of
the technologies in this report seemed just a few years ago.
We have seen incredible achievements from these technologies, but we must continue to strive to innovate and
develop the technologies that remain to be unlocked.
In addition to the emerging technologies highlighted in last year's report — super efcient trucks, smart buildings,
and light weighting materials — this report will highlight four additional technologies — hydrogen fuel cells, smart
energy management, grid connected batteries, and big area additive manufacturing — which are on the cusp of
future widespread deployment.
LAND-BASED WIND
Wind accounted for
41%
of all new generation capacity installed in the US in 2015
EVS
Over
490,000 EVs have
been sold through August of 2016
DISTRIBUTED SOLAR PV
The
millionth distributed photovoltaic
system was installed early in 2016
UTILITY-SCALE SOLAR PV
Revolution...Now
Accelerating Clean Energy Deployment
LEDS
Total A-Type LED bulb
installations surpassed
200 million
in 2015, more than
doubling since the
previous year
In 2015 total capacity grew
43% over 2014, reaching
nearly 14,000 MW
Notes: Land based wind costs derived from levelized cost of energy from representative wind sites from references [1]
and [2]. Distributed PV is average residential installed cost from reference [3]. Utility-Scale PV is median installed cost
for utility-scale PV systems from reference [4]. Modeled battery costs are at high-volume production of battery systems,
derived from DOE/UIS Advanced Battery Consortium PHEV Battery development projects. LED bulbs are for A-type
bulbs from reference [5].
REVOLUTION...NOW
2 Wind
Wind
Blowing Down Barriers
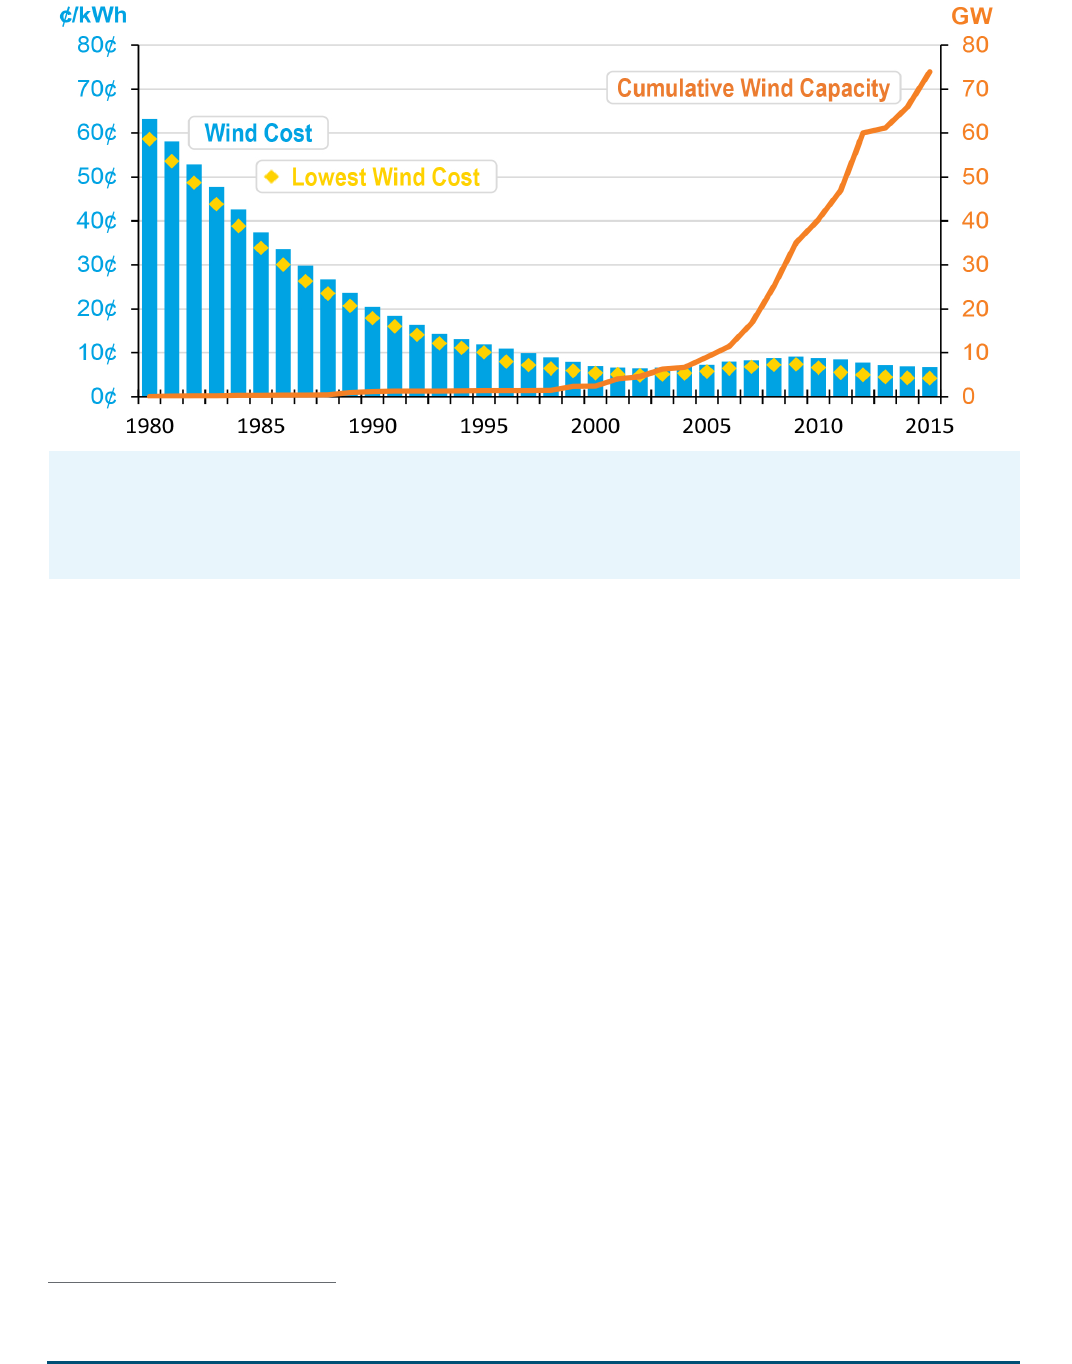
Wind power surged in 2015 with capacity growing by 12% since 2014, representing 41% of all new capacity
installed in the U.S. last year. [9] As of 2015, there were nearly 74,000 megawatts (MW) of utility-scale wind
power deployed across 41 states and territories [9]—enough to generate electricity for more than 17 million
households.
Overall, wind capacity has nearly tripled since 2008. Wind provided nearly 5% of total U.S. electricity generation
in 2015. In 23 states more than 500 MW of wind have been installed, and twelve states have seen their wind
generation exceed 10% of total in-state electricity generation. [9] This intense ramp up in installed generation has
yielded enormous benets. In 2015, wind power in the U.S. reduced annual carbon dioxide emissions by more than
132 million metric tons and decreased water consumption by more than 73 billion gallons.
These environmental benets are in addition to the nearly 90,000 U.S. manufacturing, construction, and wind
operations jobs contributing to a stronger U.S. economy. [10] In whole, the domestic manufacturing of wind
turbine components was able to add approximately $2 billion to the U.S. economy in 2014 alone. [8]
Wind in the Sales
This success of wind deployment has been enabled, in part, by recent cost reductions of wind power as U.S. wind
prices have reached all-time lows. Power purchase agreements for wind have fallen from rates of up to 7 cents/
kilowatt-hour (kWh) in 2009 to an average of 2 cents/kWh today in certain regions of the country.
This signicant reduction in cost and massive increase in deployment in a few years is a result of multiple
factors, including government investments, infrastructure development, and federal and state incentives. First,
DOE invested $2.4 billion dollars in wind research and development between 1976 and 2014. These continued
investments in key technology improvements such as the taller turbines and longer blades highlighted below have
helped drive down cost and improve performance.
Cost data from references are inflation adjusted to dollar year 2015, and exclude the production tax credit. “Wind Cost” data
estimates the levelized cost of energy from a representative wind site from references [1] and [2] and “Lowest Wind Cost”
represents costs derived from power purchase agreements from good to excellent wind resource sites in the interior of the
country as reported in reference [9]. Deployment data also from reference [9]. 1 gigawatt (GW) = 1,000 megawatts (MW).
1 One large capacity project was excluded from reference [9] based on unusual circumstances identied in the citation.
2 Wind generated 190,927 GWh in 2015. [18] The average American household consumed 10,932 kWh in 2014. [96]
3 Note that these prices come from reference [9] and include the effect of the federal PTC and as such are lower than what is displayed in the chart above.
4 Ination adjusted to 2015 dollars using U.S. Bureau of Economic Analysis GDP budget deator. Investment data and impacts for 1978-2008 from reference [97], data for 2009-2014 investments from reference [98].

Wind 3
Additionally new transmission expansion projects, such as the recently completed Texas Competitive Renewable
Energy Zone transmission build-out, have enabled wind development in more areas of the country — such as the
central part of the country that already has optimal wind resource locations. Expanded coordination among grid
operators has also increased the ability of the grid to accept higher levels of wind generation. [9]
Finally, policy has played a vital role in driving continued deployment of wind at both the state and national level.
State renewable portfolio standards have created mandates to build renewable energy in more than half the states
in the country. At the federal level, the production tax credit (PTC) has provided a nancial incentive to wind
projects, increasing their value relative to other generation technologies.
Together, these investments, infrastructure projects, and policies have made wind a low-cost, zero-carbon
alternative that contributes to the transformation of the U.S. electricity generation portfolio.
New Windows of Opportunity
Continued innovation in next generation wind technologies could soon enable cost-competitive wind in new areas
and new markets.
Beyond lowering costs in existing markets around the country, taller towers and longer blades could allow for
development of more wind projects in areas like the Southeastern U.S. that historically have not seen signicant
wind development. For example, a wind turbine installed today on average has 108% longer blades and is 48%
taller than one installed in 1999. [9] The longer blades allow each turbine to capture more energy, and taller towers
allow access to the stronger and more consistent wind speeds that occur at higher altitudes in many parts of the
country. Combined, these innovations allow each turbine to produce more electricity, reducing both the number of
turbines needed to produce a given amount of electricity and the land area needed for their installation.
These innovations enable a new generation of more cost-effective wind power. DOE estimates that the continued
development of taller wind towers coupled with larger rotors and advanced turbine designs would allow wind to be
cost-effectively deployed across the country. [11]
In addition, the development of wind energy in the waters off our nation’s coasts holds enormous potential. The
technical potential of offshore wind resources is enough to generate more electricity than twice what the U.S.
generated from all sources of electricity in 2015. [12]
The nation will have begun to take advantage of this offshore wind potential later this year as the 30 MW Block
Island project, located off the shore of Rhode Island, should be fully operational by the end of 2016. This will be
the rst commercial offshore wind power plant to operate in the U.S. By the end of 2015, the Department of the
Interior had awarded 11 commercial leases totaling 14,600 MW of capacity. [12] While the domestic offshore wind
industry still faces challenges, the potential of this technology to capture high wind resources close to coastal load
centers makes it a key future source of clean electricity for the nation.
Wind is also being purchased by new types of customers beyond traditional utilities. In 2015 nearly 2,000 MW
of wind power was contracted by corporations, representing companies across the retail, nancial, technology,
and manufacturing sectors — rapid growth considering only about 100 MW of wind power was contracted by
corporations in 2011. [13] This investment has been driven by a combination of competitive prices, environmental
responsibility, and the desire to invest in local economies.
Whirlwind of Activity
At the end of 2015, more than 110,000 MW of wind power was being considered by utilities and transmission
system operators for installation across the country representing nearly a third of all new proposed electricity
generation capacity. [9] Wind has massive untapped potential, as shown in a recent DOE report, Wind Vision, which
outlined how wind could generate 20% of the nation’s electricity by 2030 and 35% by 2050. [14] Technological
advancements are expected to continue to drive down costs in the future — a recent elicitation of wind experts
indicated wind energy costs could fall another 35% by 2050. [15]
With continuous technological innovation, transmission expansion, and continued federal and state support, wind
can continue to grow and unlock its wide array of benets in all 50 states.

REVOLUTION...NOW
4 Solar PV: Utility-Scale
Solar PV: Utility-Scale
Shedding Light on Expanded Solar Deployment
Annually, enough solar energy and land area is available in this country for utility-scale solar PV to generate ten
times the energy needed to power the entire nation. The challenge really lies in cost-effectively capturing and
converting this sunlight into useful forms of energy. However, signicant cost reductions in recent years has led
to expanded deployment of utility-scale PV, and nationally we are poised to take advantage of this nearly limitless
source of energy.
Utilities and the power sector are installing more utility-scale PV, as the installation cost of utility-scale PV has
steadily declined year after year, falling over 64% since 2008. This drop in cost has enabled explosive growth with
total capacity reaching more than 13,900 Megawatts (MW) in 2015, a growth of 43% over 2014. [16] The amount
of capacity installed in 2015 represented 15% of all utility-scale domestic electric generation capacity installed that
year. [6] This deployment trend continues to accelerate. In 2015, utility-scale PV generated 23 billion kWh, [17]
enough electricity to power over 2.1 million American homes. In the rst half of 2016, utility-scale PV generated
15 billion kWh – a 34% increase over the same time period as last year. [18]
The Dawn of New Markets
Since 2008, installation of utility-scale PV costs have fallen 64%, to a new low of $2.08/Watt. [4] These installed
costs have translated into record-low prices for electricity from solar power. Only ve years ago, contracts for
utility-scale PV power were commonly at ¢10/kWh. As of 2015 average prices are well below ¢5/kWh, with a
number of future projects already planned to deliver electricity below ¢3.5/kWh. It's important to note that these
low costs are reective in part of the location of projects in excellent solar resource locations and of the federal
investment tax credit (ITC).
Falling prices aren’t limited to the sunniest parts of the country either. While the majority of projects still arise from
the sunny Southwestern markets, 42% of new utility-scale PV power contracts signed since 2013 are east of the
Rocky Mountains, including Texas along with Southeastern and Midwestern parts of the country. [4]
Costs from reference [4]; Deployment from reference [16]. Costs shown are the median costs and exclude the eect of
the Investment Tax Credit. 1 gigawatt (GW) = 1,000 megawatts (MW). Costs and capacity are reported as DC power.
5 97.528 Quads of energy was consumed in the U.S. in 2015, [99] and the annual technical potential of utility-scale PV in the U.S. is estimated to be 282,800 TWh (equal to 965 Quads). [100]
6 Utility-scale PV capacity and cost gures are provided in terms of DC power unless otherwise indicated.
7 The average home consumed 10,932 kWh in 2014. [96]

Solar PV: Utility-Scale 5
In addition to expanding to new areas of the country, utility-scale PV is also being purchased by non-utility
consumers. Corporations are increasingly realizing the benets of directly procuring solar power from developers.
In 2015 more than 1,000 MW of solar PV capacity was contracted by corporations representing the retail, nance,
technology, and manufacturing industries, and this amount has quadrupled over the amount contracted in 2014.
[13] In 2016 it is predicted that over 1,000 MW of utility-scale PV will be contracted with non-utility customers,
[16] and it highlights how going solar increasingly makes business sense for many of these interested corporations.
Similarly, with support from the DOE’s Federal Energy Management Program, the Federal government is
increasingly directly contracting utility-scale PV. For example in 2015 the Department of the Navy procured
210 MW of a utility-scale PV project to support fourteen Navy installations in California. [19] Taken together,
these trends indicate how rapidly solar power is expanding: analysts expect that, for the rst time, over half of all
installations in 2016 will occur due to factors outside of Renewable Portfolio Standard obligations. [16]
Powerful Benefits
Utility-scale PV deployment to date have resulted in substantial environmental and human health benets. A recent
DOE study found that, in 2014, solar power saved 17 million metric tons of CO
2
, worth approximately $700
million in benets. In addition, there were another $890 million worth of benets from improved air quality due to
the reduction of air pollution thanks to the deployment of solar.
The study also found that water consumption was reduced by 7.6 billion gallons, equal to 0.5% of the total water
consumption from the power sector, with the majority occurring in drought stricken areas like California. When
looking at all of the benets together, they are worth over $1.5 billion dollars. [20]
In addition, the entire solar sector, inclusive of distributed and utility-scale PV, has provided immense economic
opportunities and has supported an estimated 220,000 domestic jobs at the end of 2015. [21] Similarly, the
manufacturing of solar photovoltaic modules and their components has added $1 billion in overall value to the
United States economy in just 2014. [8]
These benets continue to add up as deployment expands. For example, should the SunShot Vision scenario of
solar power providing 27% of all domestic generation by 2050 come to fruition, there would be an estimated $167
billion worth of savings through reduced health and environmental impacts. This includes preventing 25,000 to
59,000 premature deaths through 8-11% reduction in air pollution from power plants. [20] It could also bring
economic benets with total solar employment up to 335,000 jobs. [21]
A Bright Future
The amount of utility-scale solar projects in the pipeline is truly staggering. It took decades to achieve a cumulative
installation of 10,000 MW of PV, but it looks possible that 10,000 MW of utility scale solar will be installed this
year alone due to the previously anticipated expiration date of the investment tax credit. As of mid-2016, there
were more than 21,000 MW of utility-scale solar projects under development, with 8,400 MW of that total already
under construction. [22] With continued cost reductions and technology improvements, the future of this clean
energy technology is bright.
REVOLUTION...NOW
6 Solar PV: Distributed
Solar PV: Distributed
Shining On
Sunlight is available nearly everywhere and that means that unlike traditional power generating sources, solar
power can potentially be available anywhere there is sunshine. Distributed PV systems use the same basic PV
technology as larger utility-scale projects, but they can be small enough to t on a consumer’s rooftop. A robust
assessment of the available roof space in the US indicated that the total potential of electricity generation from
distributed rooftop PV is equal to 38.6% of the nation’s total electricity consumption. [24]
Although distributed PV technology has been available for years, falling prices over the last decade have unlocked
its potential not only for the average homeowner but for larger consumers like businesses and schools.
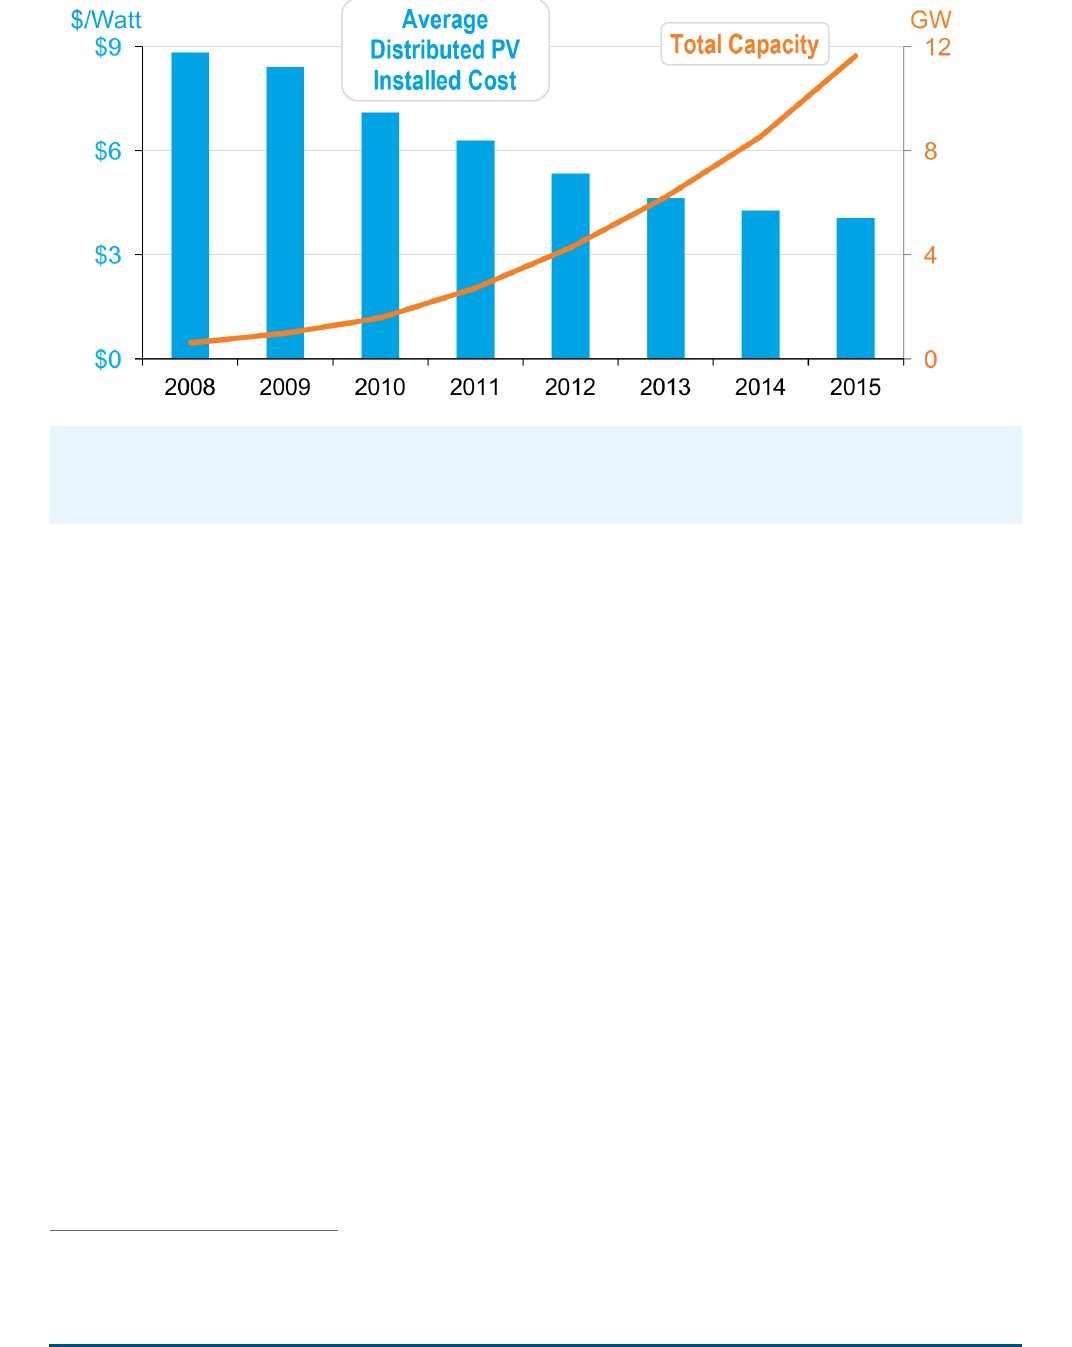
Many installations are small enough to t on a roof, but there is nothing tiny about distributed PV’s growth. Over
3,110 MW of distributed systems were installed in 2015, a 34% increase over 2014. [16] This past spring, the
millionth distributed PV system was installed, an indication of how widespread this technology has become. [25]
Through the end of 2015 a cumulative 11,638 MW had been installed in the United States, [18] generating an
estimated 12 billion kWh in 2015, and providing enough electricity to power over 1.1 million American homes.
Appraising Sunshine
The rise in installations of distributed solar has been enabled in part by a 54% reduction in installed cost since
2008. This reduction means the average installation was approximately $4.05/Watts in 2015 for residential systems.
[3] In addition it’s also important to note that this deployment trend is reective in part of the federal investment
tax credit (ITC) and supporting state policies such as net energy metering.
The cost reductions and supporting federal and state policies mean that more and more consumers are recognizing
the value of solar power. The value in terms of cost savings are well known: in 20 states and in 42 of America’s
50 largest cities, nancing a residential solar energy system currently costs less than purchasing electricity from a
Cost data from reference [3], deployment data from reference [16]. Costs are average installation costs for residential
sector PV and exclude the eect of the Investment Tax Credit. 1 GW = 1,000 MW.
8 Distributed PV capacity and cost gures are provided in terms of DC power unless otherwise indicated. In general distributed PV refers to capacity that is installed behind-the-meter and is less than 5 MWAC
in capacity, although individual references vary in their denitions.
9 The average home consumed 10,932 kWh in 2014. [95]

Solar PV: Distributed 7
customer’s local utility – commonly termed “grid parity”. [26, 27] However, the value of solar power is also being
recognized in new ways. Specically, research of real estate markets revealed that home buyers were willing to pay
$15,000 more for a home with an average-size solar photovoltaic system, equivalent to four additional dollars per
watt of solar power installed. [28, 29] The DOE’s Solar Training and Education for Professionals (STEP) program
is helping to ensure solar continues to be valued in the real estate market by educating agents and appraisers about
solar energy. [30] DOE has also funded tools to help the real estate professionals properly evaluate new and existing
distributed PV systems. [31]
Distributing Benefits
A number of actions have recently been undertaken to ensure that as the distributed solar market grows, all
consumers have access to clean energy opportunities. A recently announced Clean Energy Savings for All Initiative
aims to deploy 1,000 MW of solar to low- and moderate-income families by 2020. [32] In addition, almost 50%
of homes and businesses are not able to host their own solar system because they may be renters, might live in a
multi-family building with shared roof space, or simply don’t have an appropriate roof to host a PV system. [33]
For these consumers, community solar, also known as shared solar, allows groups of consumers to collectively own
shares of a single solar system located nearby. This enables them to share the benets of solar power. An analysis
shows that community solar could represent nearly half of the distributed solar market by 2020. [33] The recently
launched National Community Solar Partnership is working to bring together federal agencies, non-prots, and
private partners to unlock community solar’s potential in the nation. [34]
A Capital Idea
Another key factor in distributed PV comes not from technical innovations, but from advances in how consumers
can pay for solar power. Third-party-ownership of PV systems – where consumers lease a PV system instead of
purchasing it outright – has revolutionized the distributed PV market. This allows consumers to benet from lower
electricity payments without purchasing the whole PV system directly. The success of this model has been clear—
third-party nancing accounted for between 45%-90% of domestic residential PV systems installed in leading state
markets in 2015. [16] Continued development of new nancing options such as solar loans could lower the cost of
energy from distributed PV an additional 10%-20% over historical methods. [35] For example, Property Assessed
Clean Energy (PACE) programs allow homeowners to nance solar PV through no upfront cost and pay back the
loan through their property tax bills. Recent actions that provide guidelines for developing PACE programs, clarify
how Federal Housing Administration mortgage insurance and Veteran’s home loan guarantees apply to homes with
PACE assessments, and provide technical assistance to states and local communities will help further expand these
opportunities to make nancing solar easier for all Americans. [32]
Sunny Days Ahead
The deployment growth of distributed PV is expected to continue, as experts project the installed prices of
residential PV systems to fall an additional 16-33% by 2020. [36] Combined with innovative new nancing
and other solutions aimed at making distributed PV accessible to a wider array of consumers, this means more
Americans will have the opportunity to realize the wealth of benets provided by solar power.

REVOLUTION...NOW
8 LEDs
LEDs
Turning Up the Lights
Stand underneath a traditional incandescent bulb and a LED bulb and you will soon feel the difference between
the two — heat. While both produce the same amount of light, the incandescent bulb is hot to the touch, a clear
sign that much of the energy it uses is being wasted. LED technologies have cut this wasted energy out of lighting:
the best performing 60 W equivalent LED bulbs available now consume 85% less energy than incandescent bulbs.
LEDs are spurring a dramatic change in lighting due to their vast energy savings potential, lower costs, improved
performance, and added benets like long lifetime and maintenance savings.
These benets are moving LEDs into the mainstream and drastically increasing their deployment. In one year, total
installations of common home LED bulbs more than doubled from 77 million to 202 million—a particularly rapid
growth considering there used to be fewer than 400,000 installations as recently as 2009. LED bulbs now account
for 6.0% of all currently installed A-type bulbs – growth enabled by an enormous 94% reduction in cost since 2008.
[5] Looking at the bigger picture across all LED product types, LED installations prevented 13.8 million metric
tons of CO
2
emissions and saved $2.8 billion in energy costs in 2015 alone.
This success is a direct result of research and development (R&D) investments made by both government and
industry that have brought down costs, improved efciency and performance, and fostered domestic manufacturing
of LED lighting components and products. Thanks in large part to these investments, the U.S. today is the hub of
LED lighting innovation. Today, America is beginning to reap the rewards of those years of investment.
Beyond the Bulb
While common A-type LED bulbs represent the largest number of LED installations, other lighting applications
have seen higher LED market penetration. For example, directional bulbs and large area outdoor lighting xtures
have LEDs penetrating 11% and 21% of installations respectively. However, a large number of installations does
Cost and deployment data from source [5]. “LED Bulb” refers to A-type bulbs. Kilolumen is a measure of visible light
output by a source. Price data is inflation adjusted to 2015 dollar-years.
10 In this report, “LED bulbs” refers to A-Type bulbs that are common in household applications.
11 Calculated from reference [101] See page 3, note 6. The best performing LED bulb approaches 90 lumens/W efcacy. To produce 800 lumens this LED draws 8.89 W of power, an 85% reduction compared to
the 60 W of power drawn by the equivalent incandescent bulb.
12 Emission savings calculated by converting the reported 278 trillion BTU of source energy savings from reference [5] to site energy using a 3.05 site-to-source ratio, converting to electricity savings using
3412 BTU/kWh, and multiplying by the national CO
2
emission intensity of 1,136 lbs CO2/MWh as reported by eGRID 2012. [102]

LEDs 9
not necessarily translate directly to the best opportunity for energy savings. Energy saving opportunities depends
not only on the number of installations, but also on the number of hours of operation and the energy efciency
improvement that LEDs offer over competing technologies. [37]
For all of these reasons, DOE and many in the lighting industry are looking toward potential energy savings in
the commercial and industrial sectors offered by replacing uorescent overhead lighting most commonly found in
ofces and manufacturing facilities. Energy impacts in these applications are disproportionately high in relation to
LED penetration because of the large number of installations and extended operating hours. In contrast to lighting
in homes, which average less than two hours of operation per day, commercial and industrial lighting xtures
average about 12 hours of operation per day. In 2015, LEDs in typical commercial and industrial lighting xtures
contributed 20% of the LED-enabled energy savings, despite representing only 3% of their respective market, and
are expected to contribute about 30% of the total energy savings from LEDs in 2035. [37]
Achieving the greatest possible market adoption and energy savings from LED products will require ongoing
technology R&D improvements. Unlike conventional lighting sources, LED technology has signicant headroom
for additional technological advancements. DOE is committed to working with industry to continue to reduce
costs through improved materials and optics, optimized product design and assembly, boosting lumen outputs, and
integrating LEDs with lighting control systems, which will enable even greater energy savings. DOE analysis has
shown that with aggressive research and development, LED product efciency can still be more than doubled, from
the current 95 lumens per watt to 218 lumens per watt. [5]
A Bright Idea
Fully capitalizing on the promise of LED technology will catapult our nation toward creating a clean energy
future. Energy-efcient technologies like LED lighting not only reduce the consumption of fossil fuels, they also
go hand-in-hand with effectively using renewable energy. For example, further cost reductions in LED lighting
will make it far more affordable and practical to construct zero-energy buildings. These buildings are so energy
efcient that renewable energy systems can help to offset all or most of their annual energy consumption. Likewise,
the conversion to LED street lighting will enable cities and towns across the country to dramatically reduce their
energy and maintenance costs. Developing this technology domestically also allows American manufacturers to
benet from exporting LEDs to rapidly developing nations while enabling those countries to save money and cut
emissions by leapfrogging over less efcient lighting technologies.
LEDs are projected to make up over 85% of the nation's lighting installations by 2035, driven by performance
increases and cost savings relative to conventional lighting. If DOE's Solid State Lighting Program targets for
LEDs are met, the market penetration of LEDs is projected to drive a 75% reduction in annual lighting energy
consumption by 2035 over a scenario without LEDs. This would result in total annual energy savings nearly
equivalent to the energy consumed by 45 million American homes. The cumulative savings from 2015 through
2035 would save Americans nearly $630 billion in avoided energy costs, illuminating the potential of LEDs to save
energy, save money, and enable a clean energy future. [37]
REVOLUTION...NOW
10 Electric Vehicles
Electric Vehicles
Electrifying Success
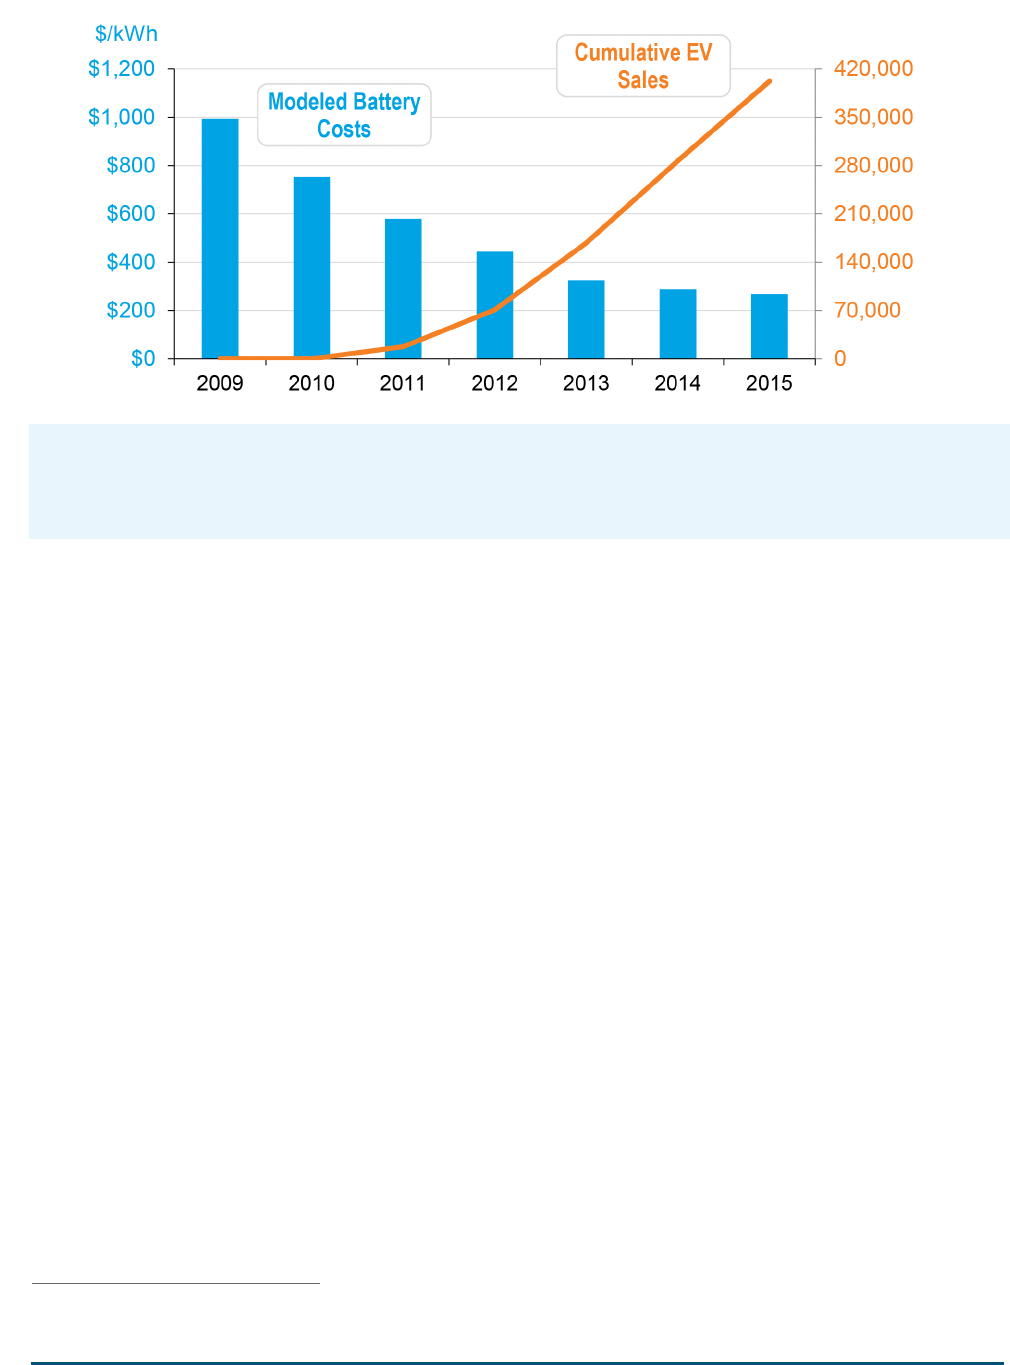
Americans bought over 115,000 electric vehicles (EVs) in 2015, more than double the number purchased in 2012
despite sustained low gasoline prices. This brought the total number of EVs on the U.S. roads to over 400,000
by the end of 2015. Sales were represented by over 20 EV model types available from over 15 different brands.
[38] EV deployments continue to expand with cumulative sales topping 490,000 as of August 2016. [7] Today,
EVs are helping to support America’s energy and climate goals and are providing an opportunity for domestic
manufacturers to remain globally competitive in the 21st century.
This is good news for our climate, our health, and our economy. With fewer to no tailpipe emissions, EVs reduce
local air pollution and help us breathe a little easier. They also enhance our energy security by reducing our oil use,
while substantially cutting carbon emissions. For example, an EV on average reduces greenhouse gas emissions
by 58%, compared to a gasoline fueled car. EVs also will become cleaner as the nation’s electricity supply is
projected to continue to move to lower-emitting energy sources. [23] The development and production of EVs is
also contributing to the economy – the United States is the largest market for automotive lithium-ion batteries and
lithium ion battery manufacturing has added about $400 million in value to the nation's economy in 2014. [8]
This continued growth is the direct result of combined federal, state, and industry efforts to bring down the
cost of EVs through research and better battery development, drivetrain improvements, promoting consumer
adoption through tax credits and other incentives, and supporting public and private investments in domestic EV
manufacturing capacity. DOE’s utility partnership agreements with Edison Electric Institute and the American
Public Power Association are intended to pick up this pace. DOE is also developing plans to collaborate with
utilities to accelerate EV and charging infrastructure deployment. [39] The continued collaboration and investment
in public education and outreach initiatives along with industry, state and federal support build on these successes
to ensure the continued increase in EV adoption.
Costs are modeled costs for high-volume battery systems, derived from DOE/UIS Advanced Battery Consortium PHEV
Battery development projects and are representative of nominal dollars. Sales as reported in reference [38]. “EVs” include
all plug-in hybrid and battery plug-in vehicles.
13 EV emissions are highly sensitive to geographic location; this number is based on the emissions associated with the national electricity generation fuel mix as reported in reference [103].

Electric Vehicles 11
Charging Ahead
The increase in EV sales in recent years has been enabled by the development of lower-cost lithium-ion batteries.
DOE estimates the cost of EV batteries produced at high volume has fallen by an astounding 73% since 2009.
The cost and performance of batteries are key factors in continuing to lower the costs of EV ownership. In addition
to universities and industry, DOE has been a leader in battery R&D investment: between 1992 and 2012, DOE
invested $1 billion in battery R&D, which advanced the state-of-the-art by six years and created $3.5 billion worth
of economic value. This investment continues to pay off as battery costs may be as low as $200/kWh by 2020.
[40] Looking ahead, DOE will work with industry, academia, and its national laboratories toward achieving an
even more aggressive goal of $125/kWh modeled production costs by 2022. [41]
We can already see rsthand the results of advanced research in EV batteries as it makes its way into the market.
For example, improvements in battery energy density enabled by DOE funded research has allowed the energy
storage capacity of the second-generation Chevrolet Volt battery to be increased by 15% compared to the previous
generation. [42] In general, optimization of cell chemistry, design, and performance decreases the mass of battery
packs, allowing EVs to travel farther with full performance. Automakers are taking advantage of these innovations
to design lower-priced EVs that are poised to be strong competitors. For example, multiple automakers plan
on delivering 200-mile-range EVs for less than $40,000 around 2017. [43] As EVs accounted for 1.5% of all
passenger cars sold in 2015, the potential for the next generation of EVs to impact transportation is signicant.
Power Up
Improved and expanded charging infrastructure will also maintain the momentum for EVs. There are now more
than 35,000 public and private EV charging outlets in the United States. Of those, there were over 4,000 DC fast
chargers, which allow drivers to charge up to 100 miles of range in as little as 20 minutes.[44, 45]
In 2015, the DOE Workplace Charging Challenge had 605 workplaces from partner organizations that have
committed to providing EV charging for employees, increasing range condence for potential EV owners. [46]
This effort has shown increased deployment as employees of challenge partners were six times more likely to
drive an EV than the average worker. [46] EV owners with access to workplace charging also drive 23-26% more
electric-powered miles than those that do not. [47] Moving forward workplace charging while increasing EV
infrastructure is key to enabling future EV deployment and emissions reductions. Recent analyses of workplace
charging show that in some areas, charging during the workday reduces EV emissions. [48]
Road to the Future
Driven by reduced battery and vehicle costs, as well as an expanded charging network, EVs are continuing to
attract new consumers and provide environmental and economic benets.
Looking ahead, continued cost reductions and performance improvements of EVs coupled with new technologies,
such as wireless charging, will increase the performance and attractiveness of EVs. With over 490,000 EVs
deployed as of August 2016, [7] the half-million EV milestone will certainly be passed before the end of the
year. America is one of the largest EV markets in the world, and more Americans are powering their cars with
affordable, clean, and secure energy.
14 Estimated costs are modeled and validated through applied research, and represent calculated high-volume commercial production costs, rather than market price.
15 Ination adjusted to 2015 dollars using U.S. Bureau of Economic Analysis GDP budget deator. Data from reference [104].
16 115,262 EVs sold in 2015 as reported in reference [38] as compared to 7,525,023 passenger cars sold in 2015 as reported by Ward’s Auto in reference [105].

REVOLUTION...NOW
12 Revolution Next
Revolution Next
The technologies highlighted in the rst section of this report have already made a big impact and are easily visible
in our daily lives. Wind towers dot the landscape, solar panels sprout on rooftops, LEDs are on shelves in every
hardware store, and the latest EV models drive through neighborhood streets.
Other emerging technologies have not quite reached the same wide-scale deployment, or are impacting our energy
use in ways that are not as visible in our daily lives. Yet in each case, deployment has begun to accelerate, costs
have started falling, and large-scale deployment could transform portions of the energy sector.
Last year, this report highlighted fuel-efcient technologies for heavy trucks, smart building controls, and vehicle
lightweighting. Along with updates in these areas, this report will look to highlight the accomplishments and
potential of fuel cells, industrial energy management, grid-scale batteries, and big area additive manufacturing.
The technologies we discuss from this point forward are what we believe we should keep an eye on over the next
ve to 10 years.
Super Trucks
The SuperTruck Initiative — a DOE program to increase long-haul 18 wheeler truck fuel efciency by 50%
over 2009 levels — has been incredibly successful. All of the teams will exceed this goal by the end of 2016,
with one team achieving a 115% increase in fuel efciency. The success of the initiative has already encouraged
participating companies to commercialize technologies from SuperTruck. For example, Volvo has commercialized
tractor aerodynamic improvements in its 2016 highway trucks [49] and several engine improvements will be
commercialized for 2017. [50, 51] Peterbilt used its aerodynamics work in SuperTruck to develop a high-efciency
truck package for its Model 579 tractor. [52] Their work was commercialized in 2014 and has been continually
rened since then. It includes extensive aerodynamic features such as tractor side fairings that close gaps between
the fender and front steer wheels, a front air dam to prevent air from owing under the truck, and fairings that
extend down the side of the tractor nearly to the ground, to direct airow away from the underside of the truck.
Overall the participating teams have already successfully commercialized 21 technologies to date, including
advances in engine and drivetrain integration and in aerodynamics. An additional 26 technologies are estimated
to be commercialized in the next two to four years, and 13 more in the ve to 10 year timeframe, highlighting the
potential of these technologies to impact fuel use in heavy-duty vehicles. [53]
Building on the success of the SuperTruck I initiative, in August of 2016, DOE announced a follow-on SuperTruck
II $80 million program for research, development and demonstration of long-haul tractor-trailer truck technology.
These projects will research, develop, and demonstrate technologies to improve heavy-truck freight efciency by
more than 100 percent, relative to a manufacturer’s best-in-class 2009 truck, with an emphasis on technology cost-
effectiveness and performance. DOE has made four selections under this opportunity Cummins, Inc. with Peterbilt
Trucks as a partner; Daimler Trucks North America LLC; Navistar, Inc.; and Volvo Technology of America LLC.
[54] Another $12 million supported projects on the research, development, and demonstration of plug-in electric
powertrain technologies for medium- and heavy-duty vehicles. [55]
Smart Buildings
Buildings are full of hidden energy savings potential that are easy to overlook because they are housed in familiar
technologies, such as heating, ventilation, and air conditioning equipment. However, with sophisticated software
and advanced data and analysis being applied to everyday building operations, building owners can leverage the
more than 58.5 million smart meters installed in the nation to realize the cost-saving benets of analytics. [56]
Recently, the Energy Department launched the Smart Energy Analytics Campaign to provide technical support
and recognition for owners in their use of a wide variety of commercially available Energy Management and
Information Systems (EMIS) technologies. [57] Paired with ongoing monitoring practices, these technologies help
identify energy-saving opportunities and improve building performance for the long run. The potential for EMIS
to save energy is also sizable: as much as 10-20% energy savings is possible in a single building, and if EMIS best

Revolution Next 13
practices were adopted by all target buildings in the U.S. commercial sector, over $4 billion in cost savings could
be achieved. [58] From single buildings to large portfolios, owners are moving building energy and operations into
the age of smart, ongoing, data-centered analytics.
Lightweighting Materials
The development and use of lightweighting materials, such as high strength steel, aluminum, and carbon ber, has
the potential to reduce total mass of a vehicle, increase its fuel efciency, while maintaining or evening improving
vehicle safety. [59] For example, a 10% reduction in vehicle weight can result in a 6-8% improvement in fuel
economy, and can also allow electric powered vehicles to go further on a single charge. [60] Using lightweight
components is also benecial because it means vehicles can carry additional advanced emission control systems,
safety devices, and integrated electronic systems to increase functionality, safety, and performance without
increasing the overall weight of the vehicle.
Overall the use of lightweight materials in vehicles is on the rise. The average amount of regular steel in a vehicle
was reduced by over 200 lbs since 1995, while average amount of high and medium strength steel used per vehicle
increased by 325 lbs. Similarly the amount of plastics and composites used per vehicle increased by 40% since
1995. This trend continues — in addition to the 2016 Ford F-150 that used aluminum to shed nearly 700 lbs, the
2017 Chrysler Pacica minivan was reengineered with a new body and vehicle platform to reduce weight and
improve vehicle fuel economy. The Pacica is 250 lbs lighter than the Town & Country – the previous minivan
offering from Chrysler. Part of this weight reduction comes from use of lightweight magnesium in place of steel in
the rear liftgate. This reduced the liftgate weight by 22 lbs all while maintaining crash safety performance. [61]
Through industry, academia, and national laboratories, the Department of Energy continues to invest in
technologies to spur the development and commercialization of lightweight materials. The recently completed
Multi-Material Lightweight Vehicle (MMLV) project demonstrated the ability to combine several advanced
lightweight materials, resulting in a vehicle that is 23.5% lighter than a similar mid-sized sedan. This prototype
vehicle passed several major safety tests and has already led to several of these technologies being used in vehicles
on the market. [62] Built by Vehma International and Ford, with support from DOE’s Vehicle Technologies Ofce,
the MMLV demonstrated the feasibility of integrating lightweight materials and joining technologies into current
production vehicles. The MMLV and the technologies used in it offer the potential to make our vehicles lighter and
more efcient for generations to come.

REVOLUTION...NOW
14 Revolution Next
Stacked for Success: Fuel Cells
Fuel cells convert the chemical energy from fuel directly into electricity, without the need for combustion, thereby
generating power at high efciencies and with low or even zero emissions. They can use diverse domestic resources
for fuel and because they’re scalable, they can be small enough to power a vehicle and large enough to support
power plants.
For the rst time in history, automakers have introduced commercial fuel cell electric vehicles (FCEVs) that
regular consumers can purchase or lease. These cars run on hydrogen, produce zero pollution from the tailpipe,
can be fueled in just a few minutes, and can travel more than 300 miles on a single ll. Toyota is currently selling
the Mirai and Hyundai is leasing its SUV, the Tucson, in California. [38] In addition, the Honda Clarity will be
available in late 2016, while Daimler, General Motors, BMW, and others plan to bring FCEVs to market soon.
[65-68] There are also several hydrogen-fueled medium and heavy vehicles - including transit buses - available on
the market today. [38] These FCEVs can already cut total greenhouse gas emissions by 50% compared to today’s
conventional cars, even if hydrogen is produced from natural gas. When hydrogen is produced from renewables or
low carbon sources, greenhouse gas emissions can be reduced more than 90%. [69]
DOE has funded research enabling signicant improvements in the technology: platinum is the most expensive
material used in fuel cells, and the amount needed was cut by ve-fold enabling a 50% reduction in costs since
2007 while quadrupling durability. [70] DOE has validated more than 200 FCEVs driving over 6 million miles,
demonstrating cutting edge advances under real world conditions. In addition, Recovery Act funds helped cost
share 1,600 fuel cells that enabled 18,000 more used in forklifts and backup power units. [72, 73] In 2015,
commercial fuel cell shipments surpassed 60,000 units worldwide, demonstrating growing traction in the
marketplace. [64]
As fuel cells gain traction, more work is underway to further reduce platinum metals, cut costs, and improve
durability. While today millions of tons of hydrogen is produced from cheap natural gas, R&D is focused on
low-cost hydrogen produced from fully carbon-free pathways. Continued innovation in production, delivery, and
storage will drive wider deployment of clean fuel cell technologies.
Cost data is modeled fuel cell cost at high volume in nominal dollars from reference [63] . Deployment data is global fuel
cell shipments for stationary, portable, and transportation uses from reference [64].

Revolution Next 15
ISO 50001 and the Superior Energy Performance Program in the
Manufacturing Sector
The industrial sector currently consumes 32% of all energy consumed in the country. [18] Capital funded energy
efciency projects do result in savings but experience has shown that the energy performance gains from these
various one-off energy efciency projects do not deliver sustained energy performance improvements due to a
lack of continual post implementation monitoring and optimization. [75, 76] In order to ensure sustained energy
performance gains, energy should not be considered a xed operational expense but managed just as carefully done
for production, quality, and safety. [78]
The International Organization of Standardization (ISO) has developed ISO 50001, a data driven management
system standard that provides a exible framework for organizations to implement an energy management
system (EnMS) that can integrate with existing business practices. An EnMS achieves energy savings through a
systematic evaluation of signicant energy uses, review of operations, and maintenance and performance of each
system. Conformance with ISO 50001 requires continual improvement to both the management system and energy
performance improvement. DOE’s Superior Energy Performance (SEP) program provides additional guidance,
tools, and protocols to drive deeper, more sustained savings from ISO 50001.
ISO 50001 and the SEP program achieve signicant energy and CO
2
emission savings results – all through better
management of energy across facilities and organizations. In many cases, the improvements are achieved with no
or low cost actions which existing facility staff can implement. Today, SEP certied facilities have achieved a 12%
reduction in energy expenditures within 15 months of implementation of ISO 50001, equating to an annual savings
of $36,000 to $938,000 using no-cost or low-cost operational measures. [78] More broadly, facilities with annual
energy costs greater than $2 million can expect investment payback on ISO 50001 in less than 1.5 years. [79]
The potential for energy management through ISO 50001 to impact energy use and emissions is enormous – broad
global deployment could save over $600 billion in energy costs, and 6,500 million tons of CO
2
by 2030. This
is equivalent to removing the annual emissions of 215 million passenger vehicles. [80] A new global campaign
announced at the 2015 Clean Energy Ministerial aims for 50,001 certications by 2020, [81] highlighting the
universal opportunity for economies around the world to realize energy savings, cost savings, and move the world
towards a clean energy future.
Data for global ISO 50001 certifications from reference [74]; SEP certifications provided by SEP program manager.

REVOLUTION...NOW
16 Revolution Next
Supercharging the Grid with Batteries
As variable renewable generation from wind and solar continues to increase, the electricity grid needs more
exibility – making it better able to support variable generation and to respond to the complex needs of our
electricity system. Specialized batteries are one technology that can provide this type of exibility which can
signicantly improve the operating capabilities to the grid. Their ability to store electricity produced at one time
for use at another time is key, allowing them to support deployment of renewable generation like wind and solar,
as well as improving the overall efciency and quality of the power grid. Batteries can also be sized and located in
local communities or at a customer’s location making them invaluable for emergency preparedness and resiliency
in case of grid disruptions due to severe weather or other events. [83, 84]
The capacity of these grid-scale batteries has increased nearly 10-fold since 2008, [83] and they are already
enhancing the capabilities of the grid. The lithium-ion battery packs used in the majority of grid-connected batteries
have declined in cost by about 60% between 2007 and 2014 [40] and analysts expect both utility and consumer
scale batteries to decline in cost by another 20-27% in just the next two years. [85] With these cost reductions and
further deployment the total domestic energy storage market could be worth $2.9 billion by 2021, as compared to
$350 million in 2015. [85]
DOE continues to support innovative energy storage solutions in a number of avenues, such as R&D in the Ofce
of Electricity Delivery and Energy Reliability’s Energy Storage program [86] and through the Advanced Research
Projects Agency - Energy (ARPA-E) Grid-scale Rampable Intermittent Distpatchable Storage (GRIDS) program
area. [87] More recently DOE’s SunShot program awarded $18 million in 2016 to develop energy storage solutions
for solar power using battery and other technologies, with the goal of developing projects to enable essentially “on-
demand” solar power. [88] Continued innovation and deployment of grid scale batteries on the grid will provide
added exibility to help support the evolving of a clean energy electricity system.
Battery capacity data from DOE Energy Storage Database, [82] showing only domestic electrochemical projects listed as
“operational” by year project was commissioned.

Revolution Next 17
Big Area Additive Manufacturing
Manufacturing is a key sector of the economy that will both enable a clean energy future and present opportunities
for further energy savings. The manufacture of specic complex parts has traditionally relied on “subtractive”
processes—taking solid blocks of metal and cutting away the unnecessary parts to sculpt the nal products.
Additive manufacturing (AM)—also known as 3-D printing—turns this process on its head by building items using
advanced techniques that add raw material only where needed. While AM provides energy savings through reduced
amounts of material needed and reducing the number of production steps, it has the potential to unlock signicant
energy savings through unprecedented design exibility that is unavailable to conventional manufacturing
techniques. [89, 90]
New advances in technology are literally expanding the potential of AM by increasing the size of components
that can be manufactured. Big Area Additive Manufacturing (BAAM) – developed in partnership with Cincinnati
Incorporated, the Department of Energy, and Oak Ridge National Lab – can construct items up to 10 times larger.
[91] These items can also be produced at nearly 99% less energy per unit of mass as compared to other commonly
used but smaller industrial AM techniques and even uses less energy than common conventional manufacturing
processes like polymer injection molding. The lower energy intensity of BAAM arises because BAAM does not
heat an oven during manufacturing, and generally operates at lower temperatures and pressures.
In addition to being less energy intensive and faster than conventional methods, BAAM is enabling the next-
generation of design and manufacturing for other clean energy technologies. For example, creating molds for
advanced wind turbine blades are complex, energy-intensive, and time-consuming. BAAM can produce these
molds 500 to 1000 times faster than other industrial additive techniques, and overall can simplify the manufacturing
of molds for turbine blades. This would reduce the costs and amount of time required for blade manufacture, as
well enabling further and more rapid innovation in blade design. [91, 92] BAAM was also a key element in the
Additive Manufacturing Integrated Energy demonstration projection, showcasing how rapid design and prototyping
can enable new innovations in the buildings, transportation, and renewable sectors. [93]
The aerospace sector also holds a large potential for BAAM to revolutionize manufacturing while saving energy.
BAAM was recently used by Oak Ridge National Laboratory to produce a tool used by Boeing for use in the
manufacture of airplane wings, which secured a spot in the Guinness Book of World Records as the world’s largest
3D-printed object. [94] The tool was produced in signicantly less time and at lower cost than by conventional
techniques, and will be used by Boeing in the production of their new 777X aircraft. This exemplies how the
widespread adoption of BAAM and other AM techniques in the aerospace sector could result in 92.1–215.0 million
metric tons of avoided CO
2
emissions. [95]
Though the aerospace sector could be a likely rst adopter for AM technologies, the broader manufacturing sector
will also benet as cost and performance improve. Any product with complex, highly customized, lightweight,
or hard to manufacture components may stand to benet from AM, especially when considering the reduced time
to market, quick prototyping, waste minimization, on-site production, and on-demand manufacturing benets that
come along with the techniques. [90] DOE is particularly focused on applications in clean energy manufacturing
such as metal and composite tooling and molding, lightweight automotive components, renewable and efcient
energy generation systems, materials for extreme environments in industrial processes, and in buildings
technologies. BAAM exemplies the potential future of advanced manufacturing, allowing us to innovate and
manufacture things bigger, stronger, faster, and with less waste, to enable a clean energy future.

REVOLUTION...NOW
18 Conclusion
Conclusion
The clean energy technologies highlighted here are transforming how our nation produces and uses energy. While
challenges exist for these technologies, it is clear they are not long-term opportunities, but a signicant part of the
energy landscape right now. We can and should plan on using them to clean our air, drive energy independence, and
help build an economy that is more competitive and more efcient, all while reducing carbon pollution.
There are even more technologies that are just on the horizon that will be every bit as important to the future
clean energy economy. DOE will continue to encourage these innovations by providing support for R&D, policy
development consumer education, and industry and stakeholder engagement. With continued progress in critical
renewable and energy-efcient technologies like these, we can look forward to a future of clean, American-made
energy.

References 19
References
[1] M. Bolinger and R. Wiser, Memorandum - Documentation of a Historical LCOE Curve for Wind in Good
to Excellent Wind Resource Sites, Lawrence Berkeley National Laboratory, 2012 - Updated Feb. 10, 2014.
[2] C. Moné and E. Lantz, Draft - Fiscal Year 2016 WWPTO LCOE Reporting Memorandum, National
Renewable Energy Laboratory, 2016.
[3] G. L. Barbose and N. R. Darghouth, Tracking the Sun IX: The Installed Price of Residential and Non-
Residential Photovoltaic Systems in the United States, Lawrence Berkely National Laboratory, August
2016. http://go.usa.gov/xKDP9.
[4] M. Bolinger and J. Seel, Utility-Scale Solar 2015: An Empirical Analysis of Project Cost, Performance,
and Pricing Trends in the United States, Lawrence Berkeley National Laboratory, August 2016. http://
go.usa.gov/xKncY.
[5] U.S. Department of Energy, Ofce of Energy Efciency and Renewable Energy, Solid-State Lighting
R&D Plan, June 2016. http://go.usa.gov/xZeQz.
[6] U.S. Department of Energy, Energy Information Administration, "Wind adds the most electric generation
capacity in 2015, followed by natural gas and solar," Today In Energy, March 23, 2016. http://go.usa.gov/
xKeRu.
[7] Y. Zhou, Light Duty Electric Drive Vehicles Monthly Sales Updates, Argonne National Laboratory,
Accessed September 2016. http://go.usa.gov/c3PeV.
[8] Clean Energy Manufacturing Analysis Center. Benchmarks of Global Clean Energy Manufacturing,
National Renewable Energy Laobratory. Forthcoming.
[9] R. Wiser and M. Bolinger, 2015 Wind Technologies Market Report, Lawrence Berkeley National
Laboratory, 2016. http://go.usa.gov/xZPwB.
[10] American Wind Energy Association, U.S. Wind Industry Annual Market Report Year Ending 2015, April
2016. http://www.awea.org/amr2015.
[11] U.S. Department of Energy, Enabling Wind Power Nationwide, May 2015. http://go.usa.gov/3SRMj.
[12] U.S. Department of Energy & U.S. Department of the Interior, National Offshore Wind Strategy,
September 2016. http://go.usa.gov/xZPKV.
[13] The Business Council for Sustainable Energy, Sustainable Energy in America Factbook, 2016, http://www.
bcse.org/sustainableenergyfactbook.
[14] U.S. Department of Energy, Wind Vision, May 2015. http://energy.gov/eere/wind/wind-vision.
[15] R. Wiser, K. Jenni, J. Seel, E. Baker, M. Hand, E. Lantz and A. Smith, “Expert elicitation survey on
future wind energy costs," Nature Energy, vol. 1, p. 16135, 2016. http://www.nature.com/articles/
nenergy2016135.
[16] GTM Research and Solar Energy Industries Association, U.S. Solar Market Insight: 2015 Year-in Review,
March 2016. http://www.seia.org/research-resources/solar-market-insight-2015-q4.

REVOLUTION...NOW
20 References
[17] U.S. Department of Energy, Energy Information Administration, Monthly Energy Review, “Table 1.1.A:
Net Generation from Renewable Sources,”August 2016. http://go.usa.gov/cYAZm.
[18] Federal Energy Regulatory Commission, Ofce of Energy Projects, Energy Infrastructure Update for June
2016, July 2016. http://go.usa.gov/xKnYY.
[19] U.S. Navy; Energy, Environment and Climate Change. Offsite California Renewable Energy Purchase.
Accessed September 2016. http://go.usa.gov/xKtqB.
[20] R. Wiser, T. Mai, D. Millstein, J. Macknick, A. Carpenter, S. Cohen, W. Cole, B. Frew and G. A. Heath,
On the Path to SunShot: The Environmental and Public Health Benets of Achieving High Penetrations of
Solar Energy in the United States, National Renewable Energy Laboratory, May 2016. http://go.usa.gov/
xKDQk.
[21] D. Chung, K. Horowitz and P. Kurup, On the Path to SunShot: Emerging Opportunities and Challenges in
U.S. Solar, National Renewable Energy Laboratory, May 2016. http://go.usa.gov/xKDUC.
[22] GTM Research and Solar Energy Industries Association, Solar Market Insight Report 2016 Q2, June 2016.
http://www.seia.org/research-resources/solar-market-insight-report-2016-q2.
[23] U.S. Department of Energy, Energy Information Administration, Annual Energy Outlook 2016, September
2016. http://go.usa.gov/xKDUF.
[24] P. Gagnon, R. Margolis, J. Melius, C. Phillips and R. Elmore, Rooftop Solar Photovoltaic Technical
Potential in the United States: A Detailed Assessment, National Renewable Energy Laboratory, January
2016. http://go.usa.gov/xKngV.
[25] U.S. Department of Energy, Ofce of Energy Efciency and Renewable Energy, With 1 Million Solar
Projects Across America, SunShot Shines On, May 2016. http://go.usa.gov/xKDEB.
[26] J. Kennerly and A. Proudlove, Going Solar in America: Ranking Solar's Value to Consumer's in America's
Largest Cities, NC Clean Energy Technology Center, January 2015. https://nccleantech.ncsu.edu/wp-
content/uploads/Going-Solar-in-America-Ranking-Solars-Value-to-Customers_FINAL1.pdf.
[27] C. Honeyman, U.S. Residential Solar Economic Outlook 2016-2020: Grid Parity, Rate Design
and Net Metering Risk, GTM Research, February 2016. http://www.greentechmedia.com/research/report/
us-residential-solar-economic-outlook-2016-2020.
[28] S. Adomatis and B. Hoen, Appraising into the Sun: Six-State Solar Home Paired-Sales Analysis, Lawrence
Berkeley National Laboratory, November 2015. http://go.usa.gov/xKDVF.
[29] B. Hoen, G. T. Klise, J. Graff-Zivin, M. Thayer, J. Seel and R. Wiser, Exploring California PV Home
Premiums, Lawrence Berkeley National Laboratory, December 2013. http://go.usa.gov/xKDp3.
[30] U.S. Department of Energy, Ofce of Energy Efciency and Renewable Energy, SunShot Programs Bring
Solar Energy Basics to Real Estate Pros, July 2016. http://go.usa.gov/xKDpT.
[31] Sandia National Laboratories, PV Value Tool, Accessed August 2016. http://go.usa.gov/xZs2w.
[32] The White House, Ofce of the Press Secretary, Fact Sheet: Obama Administration Announces Clean
Energy Savings for All Americans Initiative, July 2016. http://go.usa.gov/xKDpA.

References 21
[33] D. Feldman, A. M. Brockway, E. Ulrich and R. Margolis, Shared Solar: Current Landscape, Market
Potential, and the Impact of Federal Securities Regulation, National Renewable Energy Laboratory, April
2015. http://go.usa.gov/xKDvh.
[34] U.S. Department of Energy, Ofce of Energy Efciency and Renewable Energy, National Community
Solar Partnership, Accessed September 2016. http://go.usa.gov/xKDwk.
[35] D. Feldman and M. Bolinger, On the Path to SunShot: Emerging Opportunities and Challenges in
Financing Solar, National Renewable Energy Laboratory, May 2016. http://go.usa.gov/xZFHQ.
[36] D. Feldman, G. Barbose, R. Margolis, M. Bolinger, D. Chung, R. Fu, J. Seel, C. Davidson, N. Darghouth
and R. Wiser, Photovoltaic System Pricing Trends: Historical, Recent, and Near-Term Projections,
National Renewable Energy Laboratory, August 2015. http://go.usa.gov/xZMRx.
[37] U.S. Department of Energy, Ofce of Energy Efciency and Renewable Energy, Energy Savings Forecast
of Solid-State Lighting in General Illumination Applications, Prepared by Navigant Consulting, September
2016. http://go.usa.gov/xZeez .
[38] Oak Ridge National Laboratory, 2015 Vehicle Technologies Market Report, April 2016.
http://go.usa.gov/xZhDF.
[39] U.S. Department of Energy, Ofce of Energy Efciency and Renewable Energy, Energy Department and
Edison Electric Institute Sign Agreement to Advance Electric Vehicle Technologies, June 2015.
http://go.usa.gov/xZhBx; Energy Department and American Public Power Association Sign Agreement to
Accelerate Growth of Electric Vehicle Market. July 2016. http://go.usa.gov/xKtqv.
[40] B. Nykvist and M. Nilsson, "Rapidly falling costs of battery packs for electric vehicles," Nature Climate
Change, vol. 5, pp. 329-332, 2015. http://dx.doi.org/10.1038/nclimate2564.
[41] U.S. Department of Energy, Ofce of Energy Efciency and Renewable Energy, EV Everywhere Grand
Challenge, January 2014. http://go.usa.gov/3Sn3B.
[42] U.S. Department of Energy, Ofce of Energy Efciency and Renewable Energy, EERE Success Story—
Battery Cathode Developed by Argonne Powers Plug-in Electric Vehicles, August 2015. http://go.usa.gov/
xKtqS;General Motors, Chevrolet Introduces All-New 2016 Volt, January 12, 2015. Accessed August 25,
2015. http://media.gm.com/media/us/en/gm/news.detail.html/content/Pages/news/us/en/2015/Jan/naias/
chevrolet/volt/0112-volt-2016-intro.html.
[43] A. Davies, Chevy Could Beat Tesla to Building the First Mainstream Electric Car, Wired, January 13,
2015. Accessed August 21, 2015. http://www.wired.com/2015/01/chevrolet-bolt-ev.
[44] U.S. Department of Energy, Ofce of Energy Efciency and Renewable Energy, Alternative Fueling
Station Counts by State, Alternative Fuels Data Center, Accessed August 2016. http://go.usa.gov/3S7rh.
[45] U.S. Department of Energy, Ofce of Energy Efciency and Renewable Energy, EV Everywhere: Vehicle
Charging, Accessed September 2015. http://go.usa.gov/xB35w.
[46] U.S. Department of Energy, Ofce of Energy Efciency and Renewable Energy, Workplace Charging
Challenge Mid-Program Review, December 2015. http://go.usa.gov/xB3NH.

REVOLUTION...NOW
22 References
[47] Idaho National Laboratory, Plugged In: How Americans Charge Their Electric Vehicles, September 2015.
http://go.usa.gov/xB3cm.
[48] J. McLaren, J. Miller, E. O’Shaughnessy, E. Wood and E. Shapiro, Emissions Associated with Electric
Vehicle Charging: Impact of Electric Generation Mix, Charging Infrastructure Availablility, and Vehicle
Type, National Renewable Energy Laboratory, April 2016. http://go.usa.gov/xB3VY.
[49] P. Amar, Volvo - Supertruck, Volvo Group North America, June 16, 2016. http://go.usa.gov/xKQcT.
[50] J. Gibble and P. Amar, SuperTruck Powertrain Technologies for Efciency Improvement, 2016 Annual
Merit Review, June 2016. http://go.usa.gov/xKQc9.
[51] Volvo Trucks, Volvo Uses Knowledge Gained from SuperTruck to Increase Efciency, Performance in
2017 Powertrain Lineup, April 2016. http://www.volvotrucks.us/about-volvo/news-and-events/
knowledge-gained-from-supertruck-to-increase-efciency-performance-in-2017-powertrain-lineup/.
[52] S. Kilcarr, Aerodynamism and Peterbilt's Model 579 EPIQ tractor, FleetOwner, August 2015.
http://eetowner.com/equipment/aerodynamism-and-peterbilts-model-579-epiq-tractor#slide-0-
eld_images-169321.
[53] U.S. Department of Energy, Ofce of Energy Efciency and Renewable Energy, SuperTruck Success -
Progress on Fuel Efciency and Market Adoption, June 2016. http://go.usa.gov/xBCEF.
[54] U.S. Department of Energy, Ofce of Energy Efciency and Renewable Energy, Energy Department
Announces $137 Million Investment in Commercial and Passenger Vehicle Efciency, August 2016.
http://go.usa.gov/xKQxB.
[55] U.S. Department of Energy, Ofce of Energy Efciency and Renewable Energy, DOE Announces $80
Million in Funding to Increase SuperTruck Efciency, March 2016. http://go.usa.gov/xBCvT.
[56] U.S. Department of Energy, Energy Information Administration, “Table 10.10: Advanced Metering Count
by Technology Type,” Electric Power Annual 2014, October 2015. http://go.usa.gov/3Snx4.
[57] U.S. Department of Energy, Ofce of Energy Efciency and Renewable Energy, DOE Previews Smart
Energy Analytics Campaign, May 2015. http://go.usa.gov/xBkDW.
[58] Smart Energy Analytics Campaign, Welcome to the Smart Energy Analytics Campaign, Accessed
September 2016. https://smart-energy-analytics.org/.
[59] Committee on the Assessment of Technologies for Improving Fuel Economy of Light-Duty Vehicles,
Phase 2; Board on Energy and Environmental Systems; Division on Engineering and Physical Sciences;
National Research Council; Cost, Effectiveness, and Deployment of Fuel Economy Technologies for
Light-Duty Vehicles, The National Academies Press, 2015. http://www.nap.edu/21744.
[60] U.S. Department of Energy, Ofce of Energy Efciency and Renewable Energy, Lightweight Materials for
Cars and Trucks, Accessed September 2016. http://go.usa.gov/3SnrB.
[61] S. Wetzel, Casting of the Year: Magnesium Liftgate Cuts Weight, Adds Value, Modern Casting, May 2016.
http://www.afsinc.org/multimedia/contentMC.cfm?ItemNumber=19235.

References 23
[62] U.S. Department of Energy, Ofce of Energy Efciency and Renewable Energy, Multi-Material
Lightweight Vehicle Helps Bring Technologies to Market, July 2016. http://go.usa.gov/xKevP.
[63] U.S. Department of Energy, Ofce of Energy Efciency and Renewable Energy, Hydrogen and Fuel Cells
Program Record 15105, September 2015. http://go.usa.gov/xWkzx.
[64] U.S. Department of Energy, Ofce of Energy Efciency and Renewable Energy, Fuel Cell Technologies
Market Report 2015 (Draft), 2016. http://go.usa.gov/xBkMB.
[65] J. Voelcker, Mercedes-Benz GLC to offer world's rst plug-in fuel-cell powertrain, Green Car Reports,
June 2016. http://www.greencarreports.com/news/1104440_mercedes-benz-glc-to-offer-worlds-rst-plug-
in-fuel-cell-powertrain.
[66] R. Truett, GM to provide fuel cell vehicle to Army for testing, Automotive News, November 2015.
http://www.autonews.com/article/20151111/OEM05/151119956/gm-to-provide-fuel-cell-vehicle-to-
army-for-testing.
[67] H. Boeriu, BMW 5 Series GT Hydrogen Fuel Cell prototype spotted during testing, BMW Blog, August
2016. http://www.bmwblog.com/2016/08/09/bmw-5-series-gt-hydrogen-fuel-cell-prototype-spotted-
testing/.
[68] Honda Worldwide, Honda Shares Clarity Fuel Cell U.S. Pricing and Sales Plans, January 2016. http://
world.honda.com/news/2016/4160122eng.html.
[69] U.S. Department of Energy, Ofce of Energy Efciency and Renewable Energy, Hydrogen and Fuel Cell
Program Record 13005: Well-to-Wheels Greenhouse Gas Emissions and Petroleum Use for Mid-Size
Light-Duty Vehicles, May 2013. http://go.usa.gov/xW8CH.
[70] U.S. Department of Energy, Ofce of Energy Efciency and Renewable Energy, Hydrogen and Fuel Cell
Program Record 15014: On-Road Fuel Cell Stack Durability, October 2015. http://go.usa.gov/xBkve.
[71] U.S. Department of Energy, Ofce of Energy Efciency and Renewable Energy, Pathways to Commercial
Success: Technologies and Products Supported by the Fuel Cell Technologies Ofce, Prepared by Pacic
Northwest National Laboratory, December 2015. http://go.usa.gov/xW83z.
[72] U.S. Department of Energy, Ofce of Energy Efciency and Renewable Energy, Hydrogen and Fuel Cell
Program Record 16012: Industry Deployed Fuel Cell-Powered Lift Trucks, June 2016. http://go.usa.gov/
xB8HV.
[73] U.S. Department of Energy, Ofce of Energy Efciency and Renewable Energy, Hydrogen and Fuel Cell
Program Record 16013: Industry Deployed Fuel Cell Backup Power, June 2016. http://go.usa.gov/xB8ew.
[74] International Organization for Standardization, ISO Survey 2015, Accessed September 2016. http://www.
iso.org/iso/home/standards/certication/iso-survey.htm?certicate=ISO 50001.
[75] D. N. Jelić, D. R. Gordić, M. J. Babić, D. N. Končalović and V. M. Šušteršič, "Review of existing energy
management standards and possibilities for its introduction in Serbia," Thermal Science, vol. 13, pp. 613-
623, 2010. http://dx.doi.org/10.2298/TSCI091106003J.
[76] S. A. Ates and N. M. Durakbasa, "Evaluation of corporate energy management practices of energy
intensive industries in Turkey," Energy, vol. 45, pp. 81-91, 2012. http://dx.doi.org/10.1016/j.
energy.2012.03.032.

REVOLUTION...NOW
24 References
[77] K. Vikhorev, R. Greenough and N. Brown, "An advanced energy management framework to promote
energy awareness," Journal of Cleaner Production, vol. 43, pp. 103-112, 2013. http://dx.doi.org/10.1016/j.
jclepro.2012.12.012.
[78] U.S. Department of Energy, Ofce of Energy Efciency and Renewable Energy, Superior Energy
Performance, Accessed September 2016. http://go.usa.gov/xKPck.
[79] P. Therkelsen, P. Rao, A. McKane, R. Sabouni, Y. Tamm and P. Scheihing, "Development of an Enhanced
Payback Function for the Superior Energy Performance Program," ACEEE Summer Study on Energy
Efciency in Industry, Buffalo, NY, August 2015. http://go.usa.gov/xKPcP
[80] A. Aghajanzadeh, P. L. Therkelsen, P. Rao and A. T. McKane, Global Impact Estimation of ISO 50001
Energy Management System for Industrial and Service Sectors, Lawrence Berkeley National Laboratory,
August 2016. http://www.cleanenergyministerial.org/Portals/2/pdfs/IET 50001 V1.1.4 Global Impacts
Estimation Report.pdf.
[81] Clean Energy Ministerial, Energy Management Campaign, Accessed August 2016. http://www.
cleanenergyministerial.org/energy-management-campaign.
[82] Sandia National Laboratories, DOE Global Energy Storage Database, Accessed August 2016. http://www.
energystorageexchange.org/.
[83] U.S. Department of Energy, Grid Energy Storage, December 2013. http://go.usa.gov/xKyph.
[84] U.S. Department of Energy, Quadrennial Technology Review 2015, “Chapter 3: Enabling Modernization
of the Electric Power System, Technial Assessment, Electric Energy Storage," 2015. http://go.usa.gov/
xKyvC,.
[85] R. Manghani and B. Simon, U.S. Energy Storage Monitor: Q2 2016, GTM Research, June 2016. http://
energystorage.org/system/les/resources/gtm_research_-_esa_q2_2016_presentation_2016_06_14_nal.
pdf.
[86] U.S. Department of Energy, Ofce of Electricity Delivery & Energy Reliability, Energy Storage, Accessed
August 2016. http://go.usa.gov/xKyGV.
[87] U.S. Department of Energy, ARPA-E, GRIDS - Grid-Scale Rampable Intermittent Dispatchable Storage,
Accessed August 2016. http://go.usa.gov/xKy7G.
[88] U.S. Department of Energy, Ofce of Energy Efciency and Renewable Energy, EERE SunShot's SHINES
Program: Enabling a Raplidly Solarizing Electricity Grid Through Energy Storage, January 2016. http://
go.usa.gov/xKD6T.
[89] S. Nimbalkar, K. Visconti and J. Cresko, Life Cycle Energy Assessment Methodology and Additive
Manufacturing Energy Impacts Assessment Tool, American Center for Life Cycle Assessment, LCA XIV,
October 2014. http://www.lcacenter.org/lcaxiv/presentations/1140.pdf.
[90] U.S. Department of Energy, Quadrennial Technology Review 2015, “Chapter 6: Innovating Clean Energy
Technologies in Advanced Manufacturing, Technology Assessments, Additive Manufacturing," 2015.
http://go.usa.gov/xKyMR.

References 25
[91] U.S. Department of Energy, Ofce of Energy Efciency and Renewable Energy, Transforming Wind
Turbine Blade Manfuacturing With 3D Printing, May 2016. http://go.usa.gov/xKyeA.
[92] U.S. Department of Energy, Ofce of Energy Efciency and Renewable Energy, Teaming Up to Apply
Advanced Manufacturing Methods to Wind Turbine Production, February 2016. http://go.usa.gov/xKgM4.
[93] Oak Ridge National Laboratory, AMIE Demonstration Project, Accessed August 2016. http://go.usa.gov/
xKV3k.
[94] U.S. Department of Energy, Ofce of Energy Efciency and Renewable Energy, AMO’s Manufacturing
Demonstration Facility Helps Set Guinness World Record in 3D Printing, August 2016. http://go.usa.gov/
xKg7x.
[95] R. Huang, M. Riddle, D. Graziano, J. Warren, S. Das, S. Nimbalkar, J. Cresko and E. Masanet, "Energy
and emissions saving potential of additive manufacturing: the case of lightweight aircraft components,"
Journal of Cleaner Production, vol. 135, pp. 1559-1570, 2016.
http://dx.doi.org/10.1016/j.jclepro.2015.04.109.
[96] U.S. Department of Energy, Energy Information Administration, Frequently Asked Questions, “How much
electricity does an American home use?”, October 2015. http://go.usa.gov/cYAKh.
[97] T. Pelsoci, Retrospective Benet-Cost Evaluation of U.S. DOE Wind Energy R&D Program, June 2010.
http://go.usa.gov/3SRFY.
[98] U.S. Department of Energy, Ofce of Energy Efciency and Renewable Energy, Past and Present EERE
Budget, Accessed August 2016. http://go.usa.gov/3SRMx.
[99] U.S. Department of Energy, Energy Information Administration, Monthly Energy Review, “Table 1.1
Primary Energy Overview,”August 2016. http://go.usa.gov/xKncw.
[100] A. Lopez, B. Roberts, D. Heimiller, N. Blair, G. Porro, U.S. Renewable Energy Technical Potentials: A
GIS-Based Analysis. National Renewable Energy Laboratory. July 2012. http://go.usa.gov/3SRtC.
[101] U.S. Department of Energy, Ofce of Energy Efciency and Renewable Energy, CALiPER: Snapshot
Light Bulbs, October 2013. http://go.usa.gov/3SRzA.
[102] Environmental Protection Agency, eGRID - Emissions & Generation Resource Integrated Database,
October 2015. https://www.epa.gov/energy/egrid.
[103] U.S. Department of Energy, Ofce of Energy Efciency and Renewable Energy, Emissions from Hybrid
and Plub-In Electric Vehicles, Alternative Fuels Data Center, Accessed August 2016. http://go.usa.
gov/3Snq9.
[104] U.S. Department of Energy, Ofce of Energy Efciency and Renewable Energy, Benet-Cost Evaluation
of U.S. DOE Investment in Energy Storage Technologies for Hybrid and Electric Cars and Trucks,
Prepared by STI International, December 2013. http://go.usa.gov/3SnqJ.
[105] Ward's Auto, U.S. Car and Truck Sales, January 2015. http://wardsauto.com/keydata/historical/
UsaSa01summary.

DOE/EE-1478 • September 2016
For more information, visit: energy.gov/eere
