Winter 2024
Solar Industry Update
David Feldman
Jarett Zuboy
Krysta Dummit, Lindahl Reed Contractor for SETO
Dana Stright
Matthew Heine
Heather Mirletz
Robert Margolis
January 25, 2024

NREL | 2
Global Solar Deployment1
U.S. PV Deployment
2
PV System Pricing
3
Global Manufacturing
4
Component Pricing
5
U.S. PV Imports
6
7 PV Waste and Toxicity
Agenda

NREL | 3NREL | 3
Global Solar Deployment
• Analysts estimate 350 GW
dc
of PV was installed globally in 2023 (though recent data
have indicated that number could be more like 440 GW
dc
); global installations are
expected to increase to 400 GW
dc
in 2024 and 590 GW
dc
by 2027. 2023 estimates may
increase as it was recently reported that China installed ~260 GW
dc
of PV panels in 2023.
U.S. PV Deployment
• Though California residential installations were up through the first nine months of
2023, likely caused by a spike in interconnection applications in the lead up to April 15
change from CA NEM 2.0 to 3.0, interconnection applications have since plummeted
well below historical levels.
• According to EIA data, the United States installed 15.8 GW
ac
of PV in the first 9 months of
2023—a record—up 31% y/y (SEIA reported 19.3 GW
dc
).
• EIA projects the percentage of U.S. electric capacity additions from solar will grow from
46% in 2022 (18 GW
ac
) to 54% in 2023 (31 GW
ac
), 63% in 2024 (44 GW
ac
), and 71% in
2025 (51 GW
ac
).
• Other analysts’ projections are lower, with a median value of 33 GW
dc
in 2023, growing
to 36 GW
dc
in 2024 and 40 GW
dc
in 2025.
• The United States installed approximately 15.1 GWh (4.8 GW
ac
) of energy storage onto
the electric grid in the first 9 months of 2023, +40% (+32%) y/y, as a result of growth in
all sectors.
PV System and Component Pricing
• U.S. PV system and PPA prices have been flat or increased over the past 2 years.
• Global polysilicon spot prices fell 18% from mid-October ($10.53/kg) to mid-January
($8.70/kg), approaching their lowest levels of the past several years.
• Global module prices reached yet another record low, falling 22% between mid-October
and mid-January to $0.11/W
dc
.
• In Q3 2023, the average U.S. module price ($0.33/W
dc
) was down 11% q/q and down
23% y/y but at a 100% premium over the global spot price for monofacial
monocrystalline silicon modules.
Global Manufacturing
• BNEF reports that at the end of 2023, global PV manufacturing capacity was between
650 and 750 GW―a growth of 2–3x in the past five years, 90% of which occurred in
China. In 2023, global PV production was between 400 and 500 GW.
• Despite global price drops across the PV supply chain, PV manufacturers have generally
remained profitable, thanks to increases in sales volumes (particularly for N-type cells).
U.S. PV Imports
• The United States imported 40.6 GW
dc
of PV modules in Q1–Q3 2023, setting a new
single-quarter record of over 15 GW
dc
of modules imported.
• Most panels imported were exempt from Section 201 duties and were therefore likely
bifacial. A significant number of thin-film modules were also imported.
• 2.4 GW
dc
of cells were imported in Q1–Q3 2023, up 31% y/y.
• The U.S. is not on pace to reach the 5-GW
dc
quota exemption limit for Section 201 tariffs,
although it has exceeded 3 GW
dc
of imports in a single year for the first time ever.
Executive Summary
A list of acronyms and abbreviations is available at the end of the presentation.

NREL | 4
Global Solar Deployment1
U.S. PV Deployment
2
PV System Pricing
3
Global Manufacturing
4
Component Pricing
5
U.S. PV Imports
6
7 PV Waste and Toxicity
Agenda
• Analysts estimate 350 GW
dc
of PV was installed globally in
2023 (though recent data have indicated that number
could be more like 440 GW
dc
); global installations are
expected to increase to 400 GW
dc
in 2024 and 590 GW
dc
by
2027.
– 2023 estimates may increase as it was recently
reported that China installed ~260 GW
dc
of PV panels in
2023.
– JMK Research reported that 10 GW
ac
(12.5 GW
dc
) of PV
was installed in India in 2023―down 28% y/y. Mercom
reported that Indian installations were being delayed
due to transmission connectivity and long-term access.
NREL | 5NREL | 5
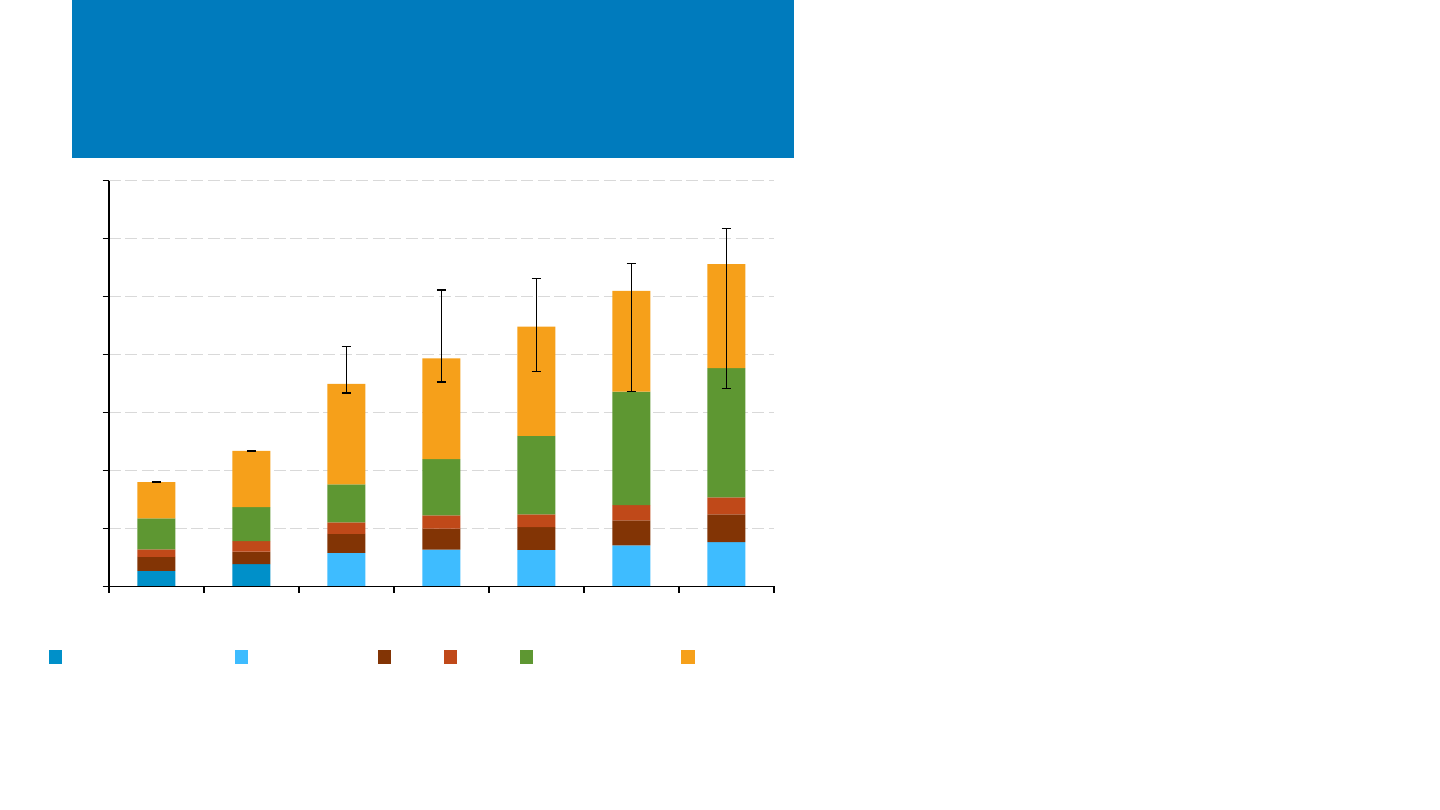
Annual Global PV Deployment
Notes: E = estimate; P = projection. Bar totals represent median global projections across analysts who provide a global projection. Error bars represent high and low global
projections. Regional bar segments represent medians of all available regional projections. Where regional medians do not sum to global medians, the differences are reconciled by
adjusting the Rest of World segments so the correct global median values are retained.
Sources: BNEF, 4Q 2023 Global PV Market Outlook, 11/22/23; EIA, Annual Energy Outlook 2023, 3/23; Goldman Sachs Equity Research, America’s Clean Technology: Solar,
12/17/23; SolarPower Europe, Global Market Outlook For Solar Power 2023–2027, 6/23; Wood Mackenzie, Three Predictions for Global Solar in 2024, 1/24; Wood Mackenzie, Q1
2024 Solar Executive Briefing, 10/23.
• Analysts estimate about 350 GW
dc
of PV were installed
globally in 2023, up 50% from 2022.
– These estimates were made before China announced
2023 PV installs, which could push 2023 global installs to
~440 GW
dc
.
• Analysts project continued increases in annual global PV
installations:
– 390 GW
dc
in 2024 (+12% y/y)
– 450 GW
dc
in 2025 (+14% y/y)
– 510 GW
dc
in 2026 (+14% y/y)
– 560 GW
dc
in 2027 (+9% y/y)
• Among analysts who were covered in the Spring 2023 edition
of the Solar Industry Update, global projections increased in
this edition, e.g., by 2%–31% for 2025 projections.
• The range of projections skews high in the next couple years
but very low toward the end of the projection period.
– One analyst predicts flattening of global deployment
growth, resulting in a projection 220 GW
dc
(40%) below
the median in 2027.
• Over the period shown, China is projected to install the most
PV (39%), followed by Europe (12%), the United States (9%),
and India (6%).
0
100
200
300
400
500
600
700
2021 2022 2023E 2024P 2025P 2026P 2027P
PV Annual Installations (GW
dc
)
European Union Europe (All) U.S. India Rest of World China
NREL | 6NREL | 6
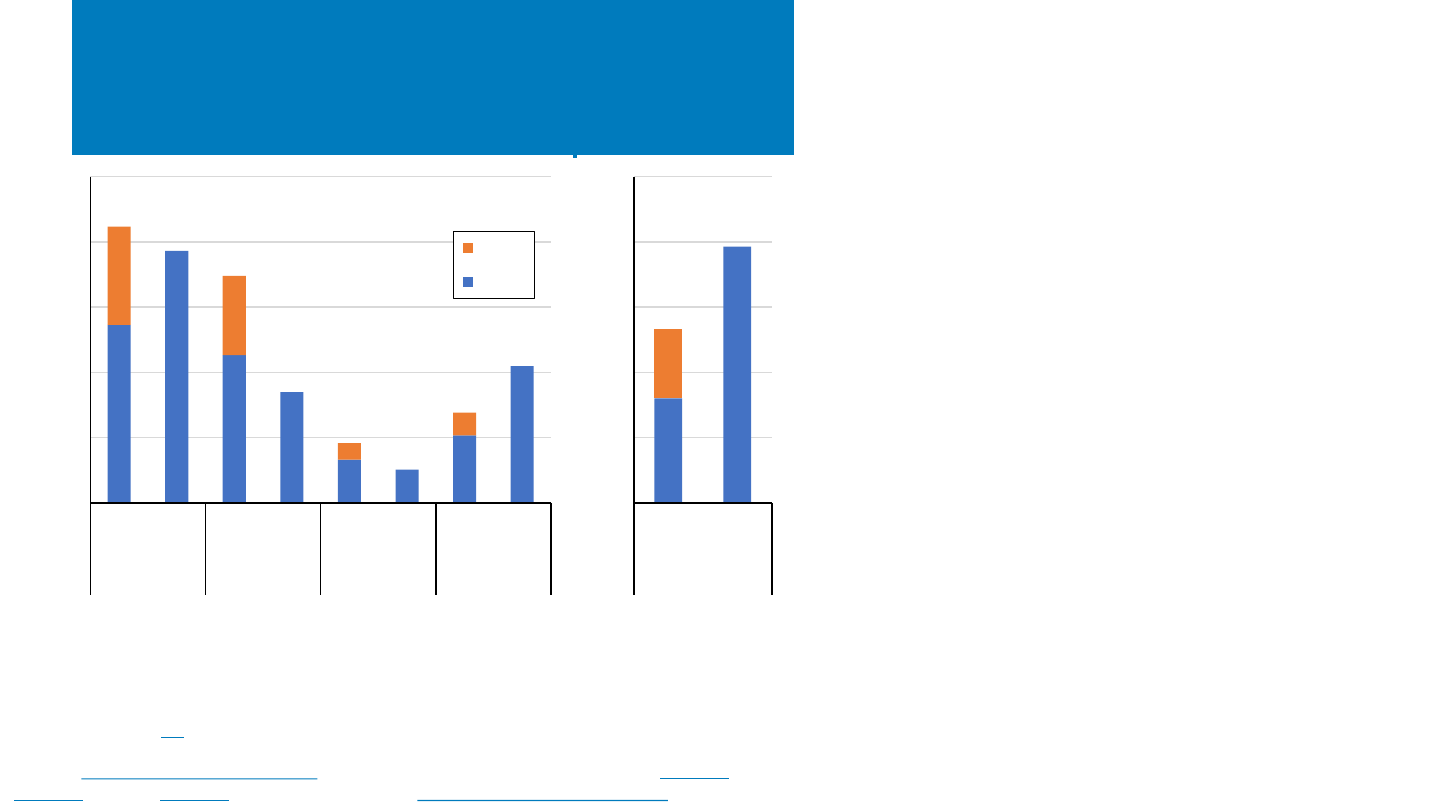
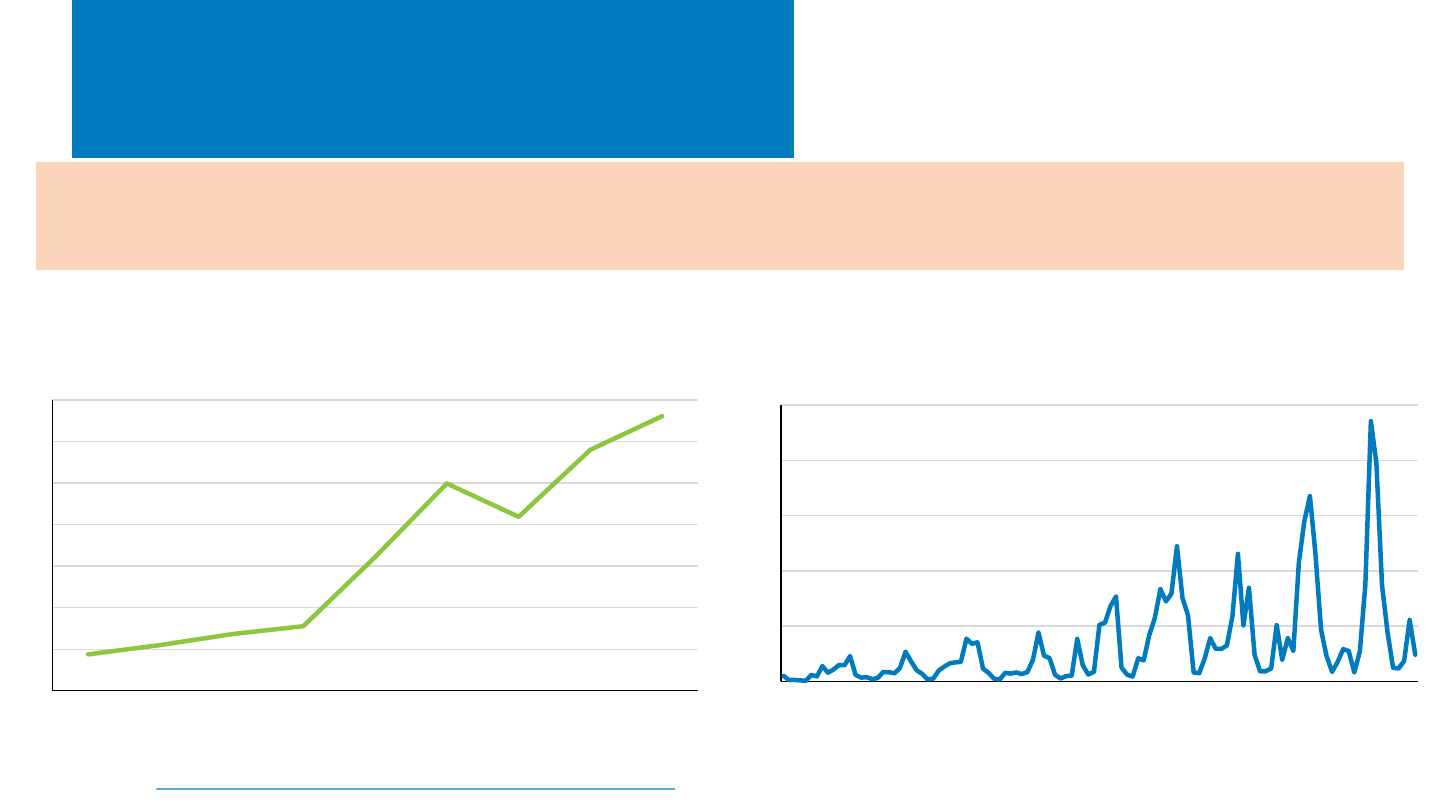
International Q1–Q3 2023
Installations
• In the first 9 months of 2023, PV
installations increased significantly (y/y) in
China (145%), Germany (102%), and the
U.S. (42%):
– China installed ~260 GW
dc
of PV
panels in 2023.
– Germany installed 14.3 GW
dc
in 2023.
– JMK Research reported that 10 GW
ac
(12.5 GW
dc
) of PV was installed in
India in 2023―down 28% y/y.
Mercom reported that Indian
installations were being delayed due
to transmission connectivity and long-
term access.
• At the end of September, these countries
had cumulatively installed 869 GW
dc
of PV.
Sources: Australian Photovoltaic Institute. Mercom (11/27/23; 01/29/24). PV Magazine (11/24/23,
12/22/23); PVTech (10/20/24); Wood Mackenzie/SEIA: U.S. Solar Market Insight: Q4 2023.
Cumulative
capacity
0
5
10
15
20
25
2022 2023 2022 2023 2022 2023 2022 2023
U.S.
161 GW
India
71 GW
Australia
33 GW
Germany
78 GW
Installations (GW
dc
)
Q4
Q1-Q3
0
40
80
120
160
200
2022 2023
China
526 GW
*China reported 87 GW of PV installations in 2022, 129 GW in the first 9 months of 2023, and 216.9 GW in
2023; however, these numbers reflect a combination of utility-scale projects reported in W
ac
and distributed
PV reported in W
dc
. IEA estimated Chinese 2022 installations to be 106 GW. Chinese values here reflect the
same 2022 ILR.

NREL | 7NREL | 7
Concentrating Solar Power
Update
• In Q1 2024, India plans on putting out a tender for renewable energy in which over 50% must come from CSP.
There is renewed interest in CSP in India to provide a longer-duration source of solar energy. Over a decade ago,
India awarded 470 MW of contracts for CSP, but only 200 MW was built
. India is planning to address previous
issues, such as reducing development risk, increased DNI data availability, and loans covering 70% of the costs.
The size of the tender was not provided.
• Recently, there has been a series of CSP spinoff companies that focus on stand-alone thermal energy storage,
powered by electricity from wind and solar to provide more cost-competitive long-term thermal energy storage
for industrial process heat. Recent companies include Malta,
Heatrix, Rondo, and Heatcube. Heatcube has
designed a process with salts that solidify at lower temperatures than traditional CSP, which allows them to use
less expensive steel for their tanks.
• In December, DEWA inaugurated its 700-MW CSP plant (600-MW trough; 100-MW tower). The facility also
includes 250 MW of PV and 5.9 GWh of thermal energy storage capacity.
• In October 2023, GlassPoint announced it will partner with the Ministry of Investment of Saudi Arabia to build a
solar manufacturing plant to mass-produce its solar steam technology. At full capacity, the factory will annually
produce technology to generate 5,000 tons of solar steam.

NREL | 8
Global Solar Deployment1
U.S. PV Deployment
2
PV System Pricing
3
Global Manufacturing
4
Component Pricing
5
U.S. PV Imports
6
7 PV Waste and Toxicity
Agenda
• Though California residential installations were up through
the first 9 months of 2023, likely caused by a spike in
interconnection applications in the lead up to April 15
change from CA NEM 2.0 to 3.0, interconnection
applications have since plummeted well below historical
levels.
• According to EIA data, the United States installed 15.8
GW
ac
of PV in the first 9 months of 2023—a record—up
31% y/y (SEIA reported 19.3 GW
dc
).
• EIA projects the percentage of U.S. electric capacity
additions from solar will grow from 46% in 2022 (18 GW
ac
)
to 54% in 2023 (31 GW
ac
), 63% in 2024 (44 GW
ac
), and 71%
in 2025 (51 GW
ac
).
– Other analysts’ projections are lower, with a median
value of 33 GW
dc
in 2023, growing to 36 GW
dc
in 2024
and 40 GW
dc
in 2025.
• The United States installed approximately 15.1 GWh (4.8
GW
ac
) of energy storage onto the electric grid in the first 9
months of 2023, +40% (+32%) y/y, as a result of growth in
all sectors.
NREL | 9NREL | 9
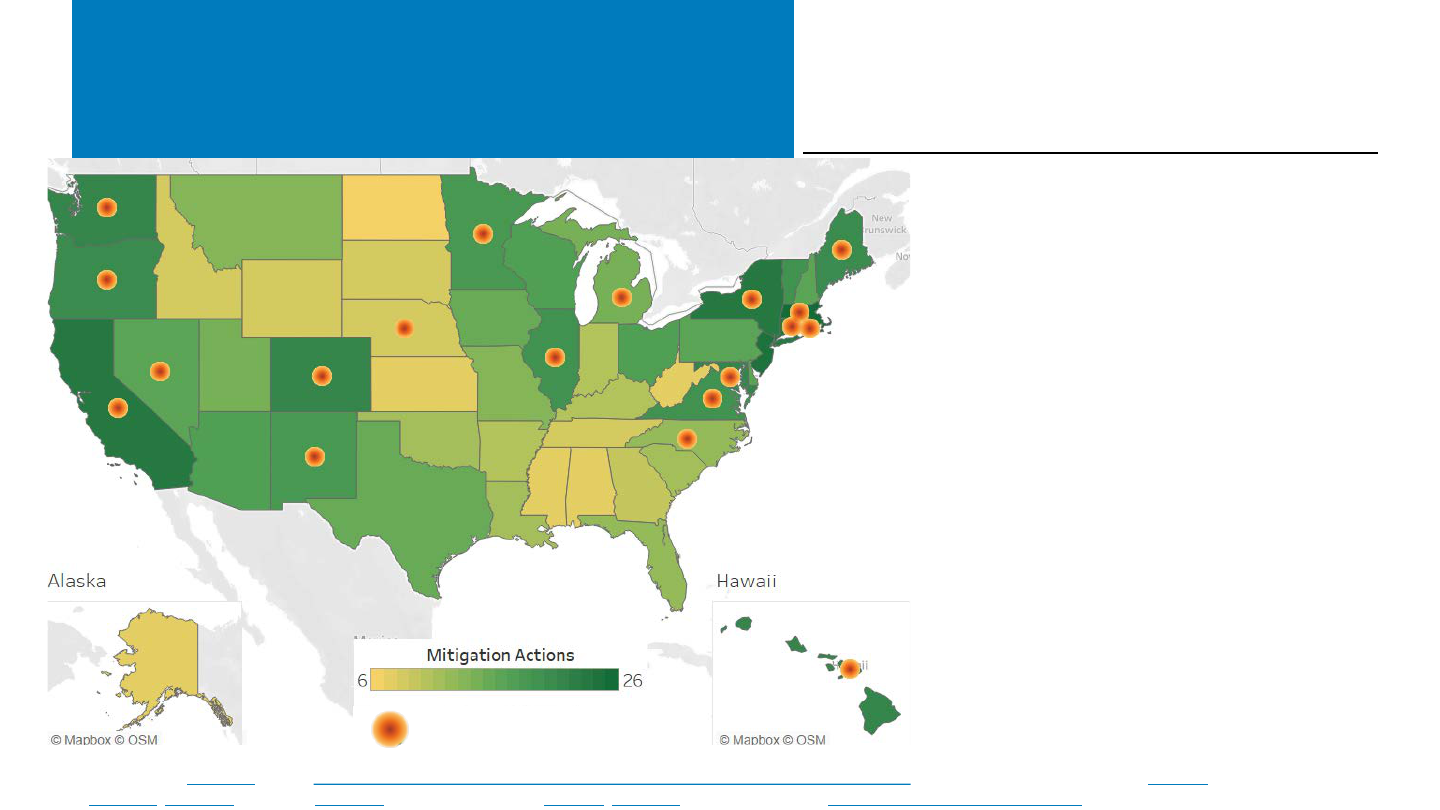
States: Q3–Q4 2023 Updates
Sources: Canary Media (11/20/23); LBNL, U.S. State Renewables Portfolio & Clean Electricity Standards: 2023 Status Update (6/2023); Minnesota Reformer (11/6/23); PV
Magazine (10/24/23, 11/27/23); PV Tech (11/30/23); Solar Power World (10/9/23, 11/28/23); U.S. Government, Fifth National Climate Assessment (2023).
Map shows the number of mitigation actions (reducing greenhouse gas
emissions or removing them from the atmosphere) taken by states, as
reported in the Fifth National Climate Assessment. Cities and tribal
entities have also taken actions. The circles identify the 18 states (plus
Washington, DC) with 100% clean or renewable energy commitments.
Michigan committed to 100% clean electricity
by 2040, 2.5 GW of storage by 2030, higher caps
on distributed PV, and more. The state is also
offering clean energy deployment grants.
Minnesota increased the share of PV
installation incentives going to income-qualified
customers from 30% to 50%.
The Washington, DC metro area targeted
250,000 rooftop PV systems by 2030, equivalent
to PV on 24% of single-family homes.
New York announced investments in 1.5 GW of
PV plus 4.7 GW of other renewables, the
largest-ever state investment in renewable
energy, which will meet 12% of electricity
demand.
California passed laws promoting PV, battery,
and transmission deployment along highways
and accelerating distribution grid
improvements.
100% clean energy std.
NREL | 10NREL | 10
Top State Distributed PV Policy Trends of 2023
• Net billing tariffs
• Incentives for low- to moderate-income customers
• Time-varying PV-compensation rates
• Lack of new utility-proposed/regulator-accepted fees on
PV customers
• Expanded and redesigned state community solar
programs
• Required siting specifications for community solar
projects
• Higher system size and aggregate capacity limits for PV
programs
• Required or allowed application of net excess generation
credits to low-income customer accounts
• Tariffs designed to encourage PV plus storage
• Utility-initiated (not state-initiated) proposals for net-
metering successor tariffs.
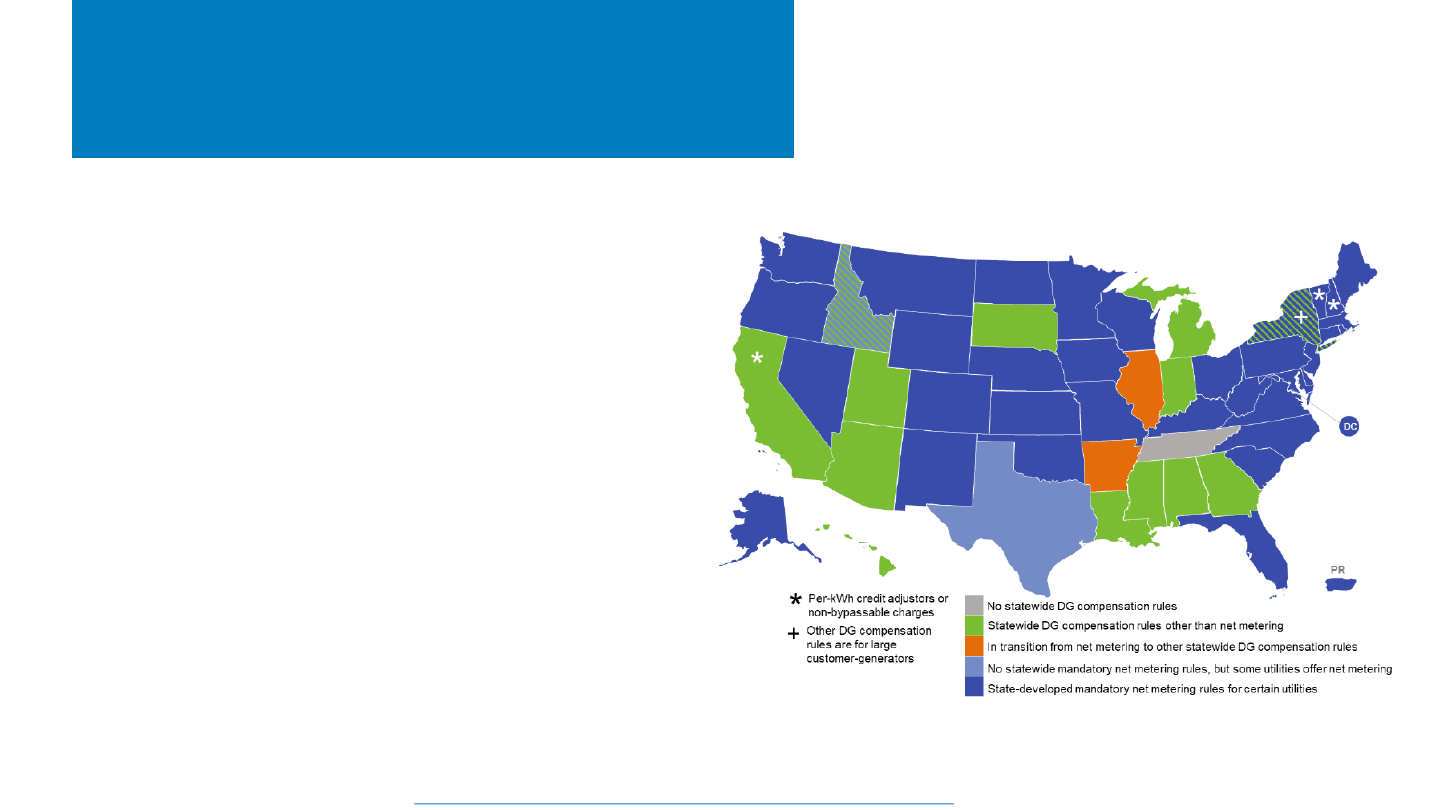
States: 2023 Year-in-Review
Source: North Carolina Clean Energy Technology Center, The 50 States of Solar: 2023 Policy Review and Q4 2023 Quarterly Report, January 2024. Map reproduced with permission.
Net Metering and Distributed Generation
Compensation Policies as of December 2023
NREL | 11NREL | 11
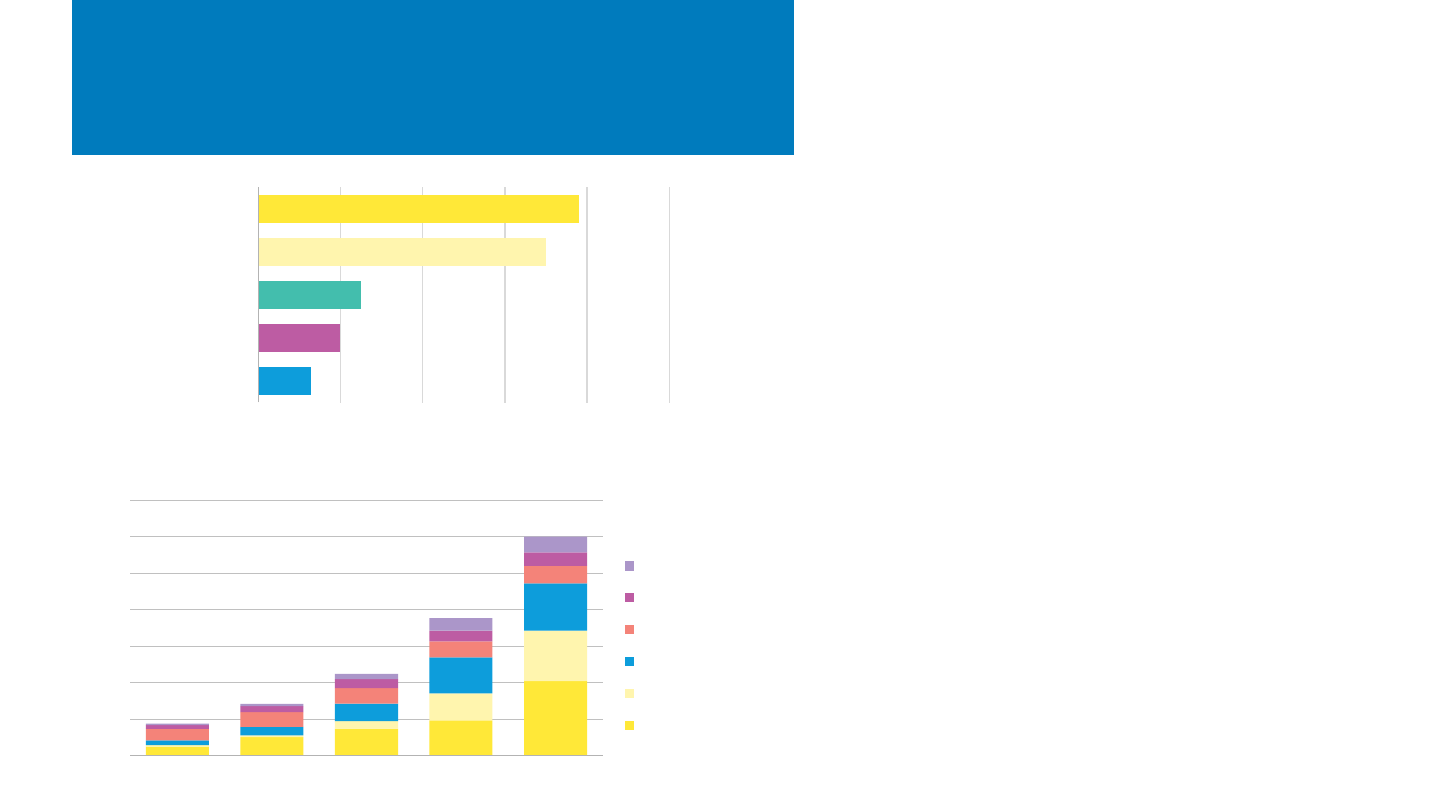
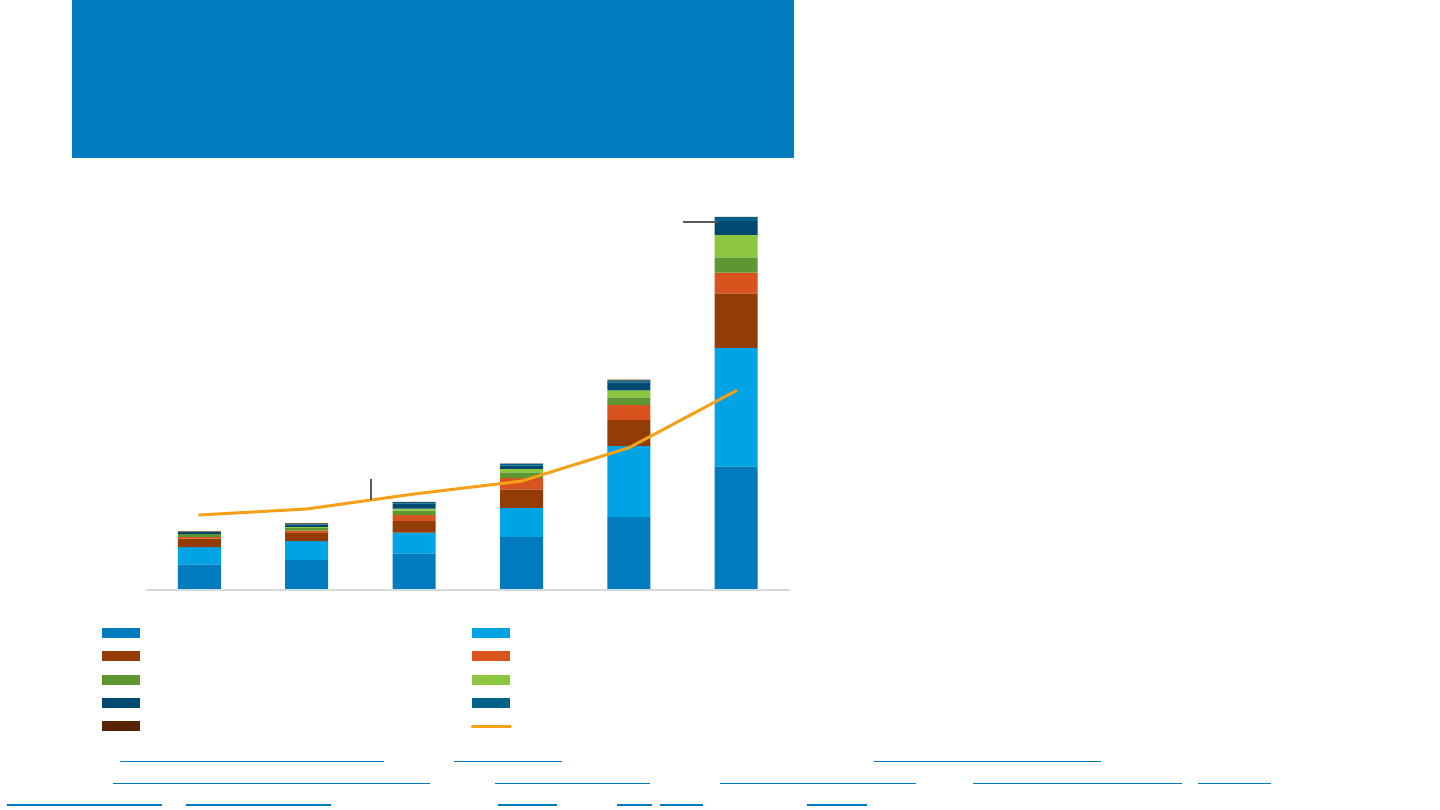
Global Residential
PV+Storage (BNEF)
• At the end of 2023, approximately 15 GW/34 GWh of global
residential battery storage capacity had been installed, 88% of
which was located in five countries: Germany, Italy, Japan, the
U.S., and Australia.
• Growth in these markets occurred mostly due to an increase
in storage subsidies coinciding with a decrease in PV export
tariffs (and often high retail rates).
– Germany and Italy have provided incentives between
30% and 50% for the cost of storage while decreasing PV
export rates to the price of wholesale power. The
incentives have scaled back, but self consumption is still a
leading driver ($0.30/kWh vs. $0.05/kWh).
• China has a relatively small residential battery market,
particularly given its high level of product manufacturing. This
is due to low retail rates, low concern for power outages, and
low subsidies.
• Products on the market are now lithium iron phosphate
batteries, which are safer as well as less expensive than the
previously dominant nickel manganese cobalt (which are
denser and therefore better suited for EVs).
• The value chain is evolving to integrate hardware components
and software (for aggregation and energy trading) into a final
product.
0% 20% 40% 60% 80% 100%
US
Australia
European average
Italy
Germany
2023 Residential battery to solar attachment rates, by country (%)
0
2
4
6
8
10
12
14
2019 2020 2021 2022 2023
Residential battery storage annual additions, by country (GWh)
Others
Australia
Japan
US
Italy
Germany
Source: BloombergNEF, “Scaling the Residential Energy Storage Market.”
December 19, 2023.
NREL | 12NREL | 12
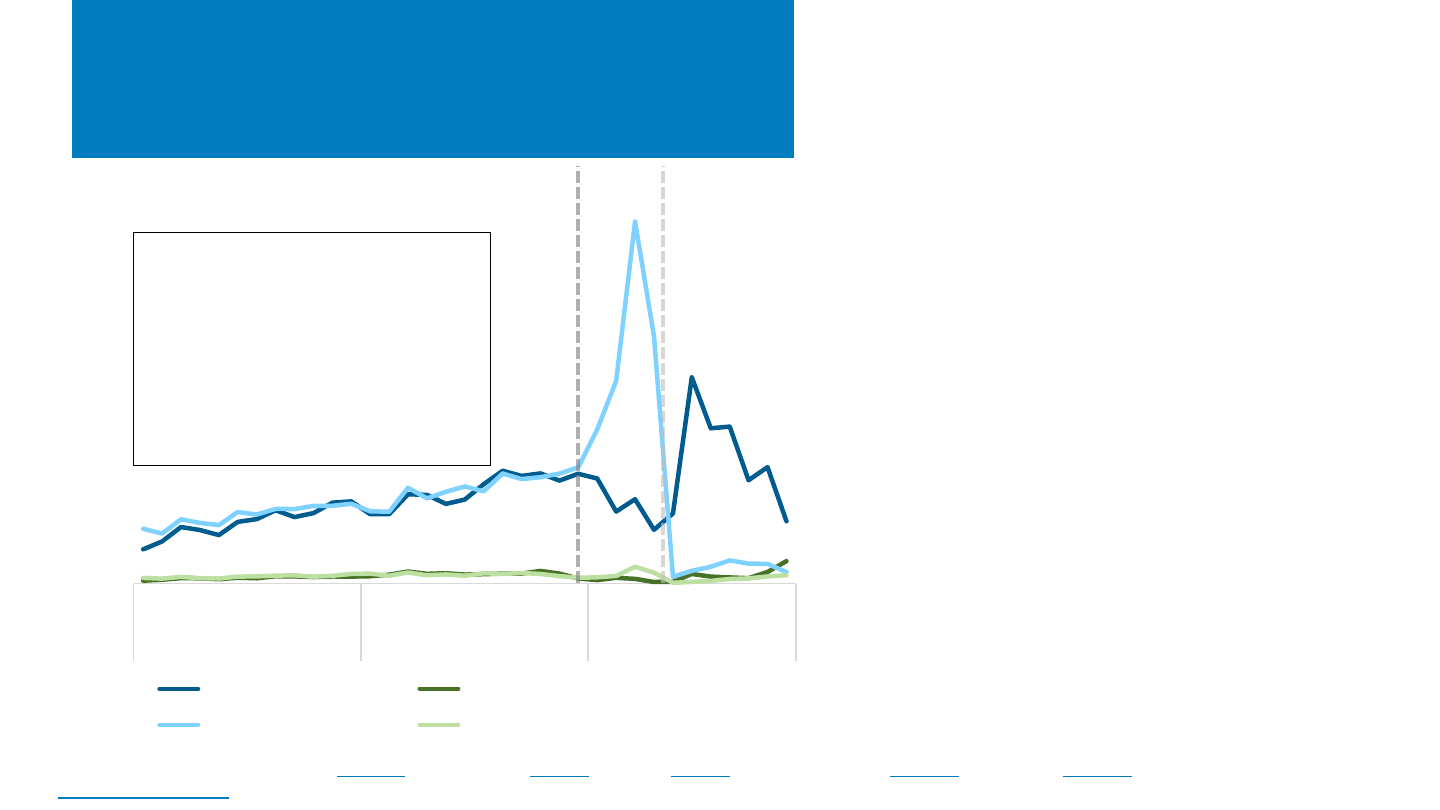
California’s NEM 3.0 Affects
Distributed PV Installations
Sources: California Distributed Generation (11/30/23); Canary Media (12/1/23); PV Tech (12/4/23); Solar Power World (11/30/23); Utility Dive (12/14/23); Wood Mackenzie and
SEIA; US Solar Market Insight, Q4 2023.
• Implementation of California’s Net Billing Tariff
(i.e., NEM 3.0) rules on April 15, 2023, has already
had a dramatic effect on the residential PV
market:
– Retail export rates under the NEM 2.0 policy
were replaced with avoided-cost rates,
reducing export compensation by ~75%.
– Preliminary data show receipt of residential
interconnection applications spiking in the
lead up to April 15 and then plummeting.
• It is unclear at this point how much of the
drop is attributable to a change in
economics vs. depletion of sales pipelines.
– The NEM 3.0 framework was designed to
encourage PV+storage, which can reduce how
much energy gets exported. To date,
PV+storage applications are still dwarfed by
previous stand-alone PV applications.
0
10,000
20,000
30,000
40,000
50,000
60,000
70,000
Jan Mar May Jul Sep Nov Jan Mar May Jul Sep Nov Jan Mar May Jul Sep Nov
2021 2022 2023
No. of Residential Interconnection Applications
Standalone PV (approved) PV + storage (approved)
Standalone PV (received) PV + storage (received)
Interconnection Data: Pacific Gas &
Electric, Southern California Edison
Data are preliminary. Applications
received but not yet approved are
not included. A surge in applications
preceding NEM 3.0 implementation
in April 2023 created an application
approval backlog.
NEM 3.0
effective
NEM 3.0
approved
NREL | 13NREL | 13
California’s NEM 3.0 Affects
Distributed PV Installations (cont.)
• Though it is too early to assess from installation and
application data the true impact of NEM 3.0, a
California Solar & Storage Association (CALSSA) survey
suggests the impacts will significantly harm solar
businesses:
– Respondents reported that 17,000 solar jobs (22%
of all its solar jobs) would be lost by end of 2023.
– 59% of residential PV and storage contractors
responded that they anticipated further layoffs.
• In December 2023, a California appeals court dismissed
a challenge to the NEM 3.0 policy from environmental
groups, who argued that the policy does not consider
the societal benefits of distributed PV as required by
law.
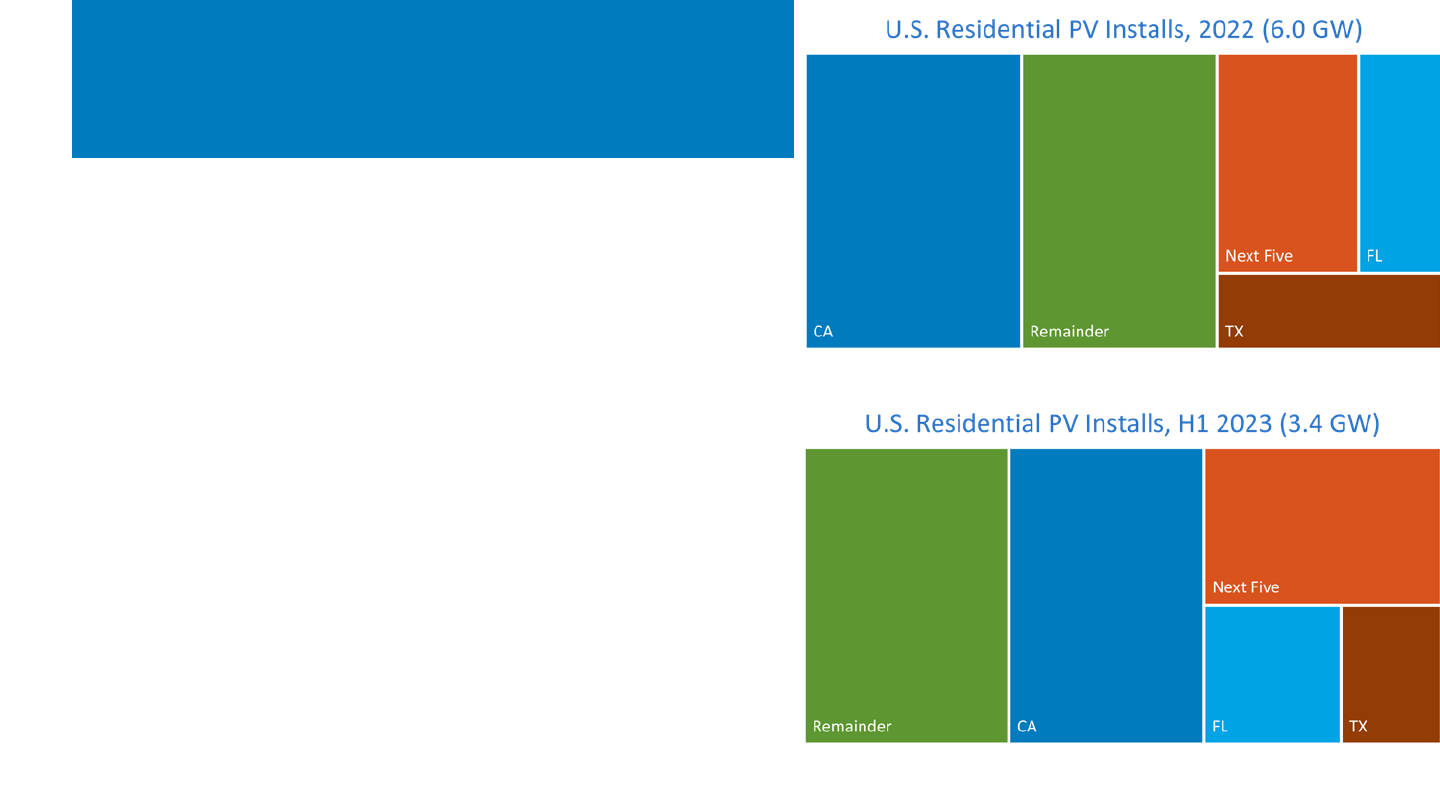
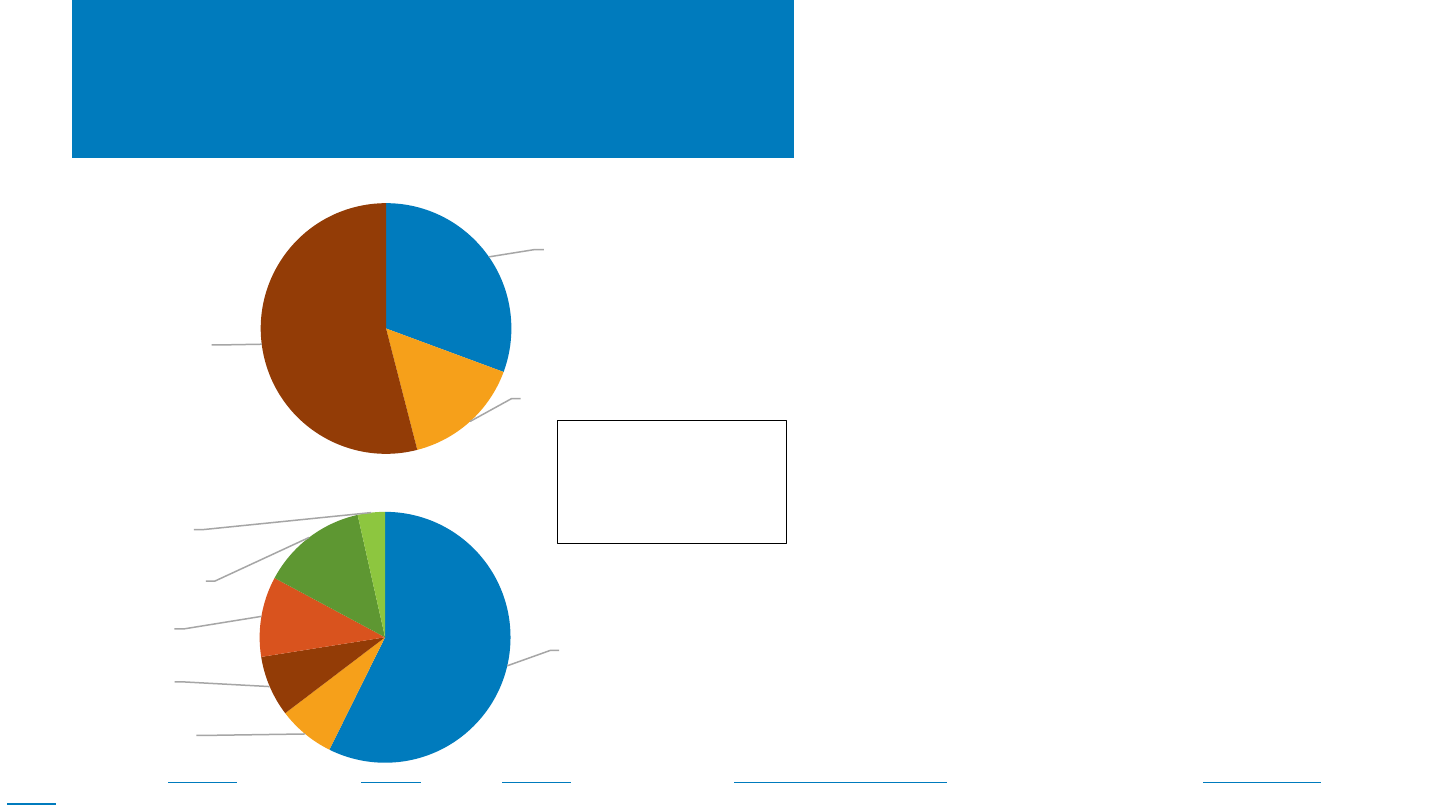
• California accounted for one-third of U.S. residential PV
capacity installed in 2022.
NREL | 14NREL | 14
New California Policies Reduce PV
Compensation Further
• In November 2023, the California Public Utilities
Commission (CPUC) reduced PV compensation for
multimeter properties.
– Customers such as schools, farms, and shopping
centers must sell all electricity at reduced rates
while buying all electricity at full retail rates.
– Multifamily housing residents still can self-
consume PV electricity, but multifamily common
areas (lobbies, garages, and so on) cannot.
– Residents enrolled in affordable housing
programs retain existing rates.
– The policy applies immediately to new PV
customers and is phased in over 20 years for
existing customers.
• In a separate decision, CPUC reduced compensation
for single-family homes that host PV-plus-storage
systems under California’s new Net Billing Tariff (i.e.,
NEM 3.0) by limiting which bill charges can be offset
by exporting electricity to the grid during high-value
periods such as early evenings.
– According to one consultant, the policy will
reduce compensation to typical PV-plus-storage
owners by 10%–15% or about $230 per year.
Residential,
13 GW (31%)
Non-residential,
7 GW (15%)*
Utility-scale,
24 GW (54%)
Cumulative California PV by Sector, Through 2023 (GW
dc
)
1-unit detached,
8.4 M (57%)
1-unit attached,
1.1 M (7%)
2 to 4 units,
1.1 M (8%)
5 to 19 units,
1.5 M (10%)
20 or more units,
2.0 M (14%)
Mobile home,
0.5 M (4%)
California Housing Types, 2022
*Non-residential includes
commercial, industrial,
agricultural, school,
government, nonprofit,
community solar.
Sources: Cal Matters (11/16/23
); Canary Media (12/4/23); PV Tech (11/17/23); U.S. Census Bureau, American Community Survey, 2022; Wood Mackenzie and SEIA, US Solar Market
Insight, Q4 2023.
NREL | 15NREL | 15
0
1,000
2,000
3,000
4,000
5,000
6,000
2016 2017 2018 2019 2020 2021 2022 2023P 2024P
Capacity (MW
ac
)
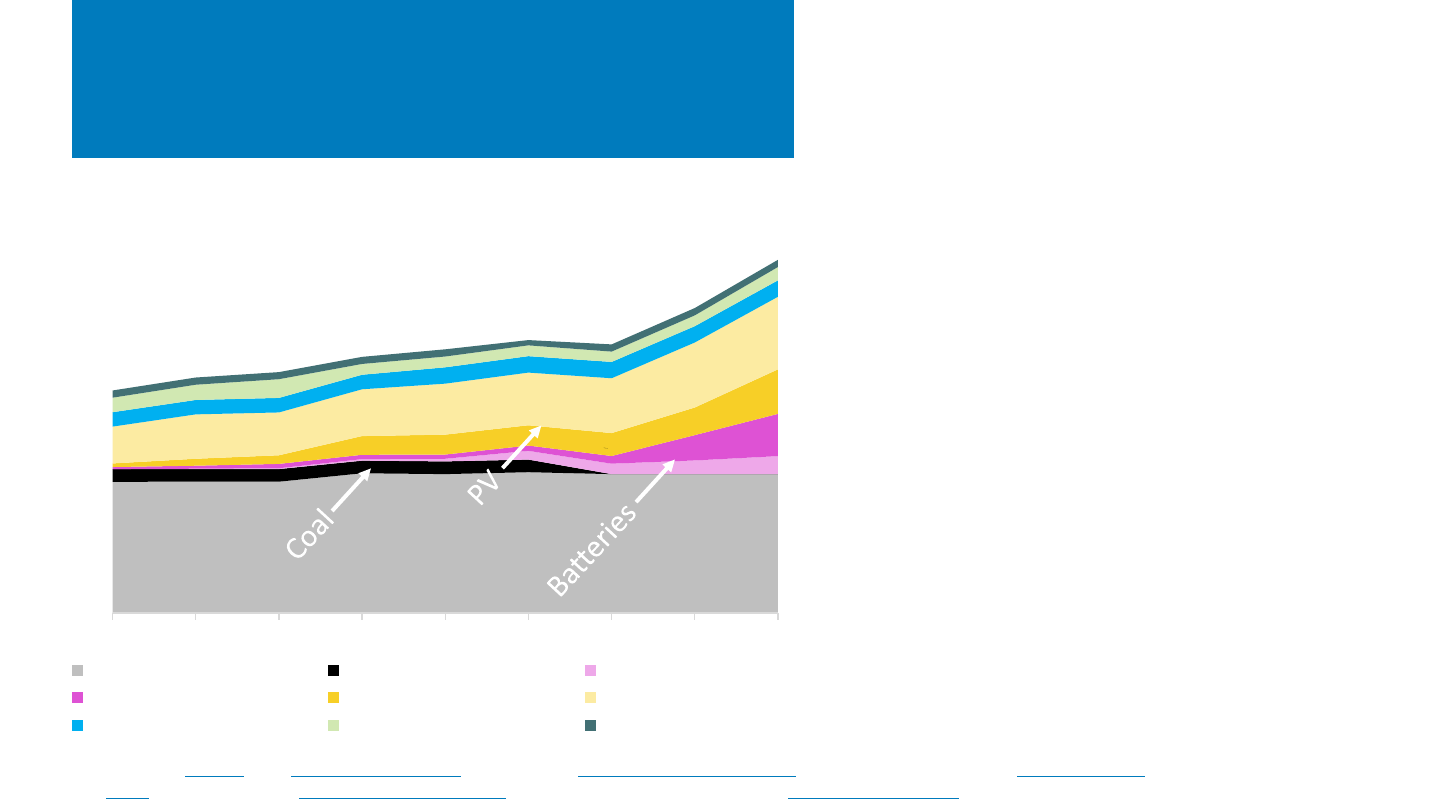
Electric Capacity, Hawaii
Petroleum Coal Distributed Battery
Utility Battery Utility PV Distributed PV
Wind Biomass Geo+Hydro+Other
PV and Batteries Help
Replace Coal in Hawaii
Sources: Canary Media (1/10/24); EIA, Electric Power Monthly, Dec 2023; EIA, Hawaii Electricity Profile 2022, Nov 2023; Hawaiian Electric (accessed 1/16/24); Hawaii Public Utilities
Commission (12/23
); Wood Mackenzie, U.S. Energy Storage Monitor, Q4 2023; Wood Mackenzie and SEIA, US Solar Market Insight, Q4 2023.
• The 185-MW
ac
Kapolei energy storage plant on
Oahu began operating in December 2023.
– It helps replace capacity lost when Hawaii retired
its 180-MW
ac
coal plant in 2022, constituting 17%
of Oahu’s peak capacity.
– It also provides grid services and black-start
capability.
– It is estimated to reduce curtailment of
renewables by 69% for the first 5 years.
• Statewide, battery capacity is projected to
increase 230% between 2022 and 2024 (to 860
MW
ac
), while PV capacity is projected to increase
50% (to 1,700 MW
ac
).
– Utility-scale installations are growing fastest.
• Hawaii’s electricity market and policies are
promoting this shift.
– Retail electricity rates are the highest in the
United States, triple the national average.
– The state target is 100% clean electricity by 2045.
– Residential PV growth slowed after net metering
ended in 2015.
– Subsequent distributed energy policies have
promoted self-consumption, grid support, and
deployment of energy storage.
NREL | 16NREL | 16
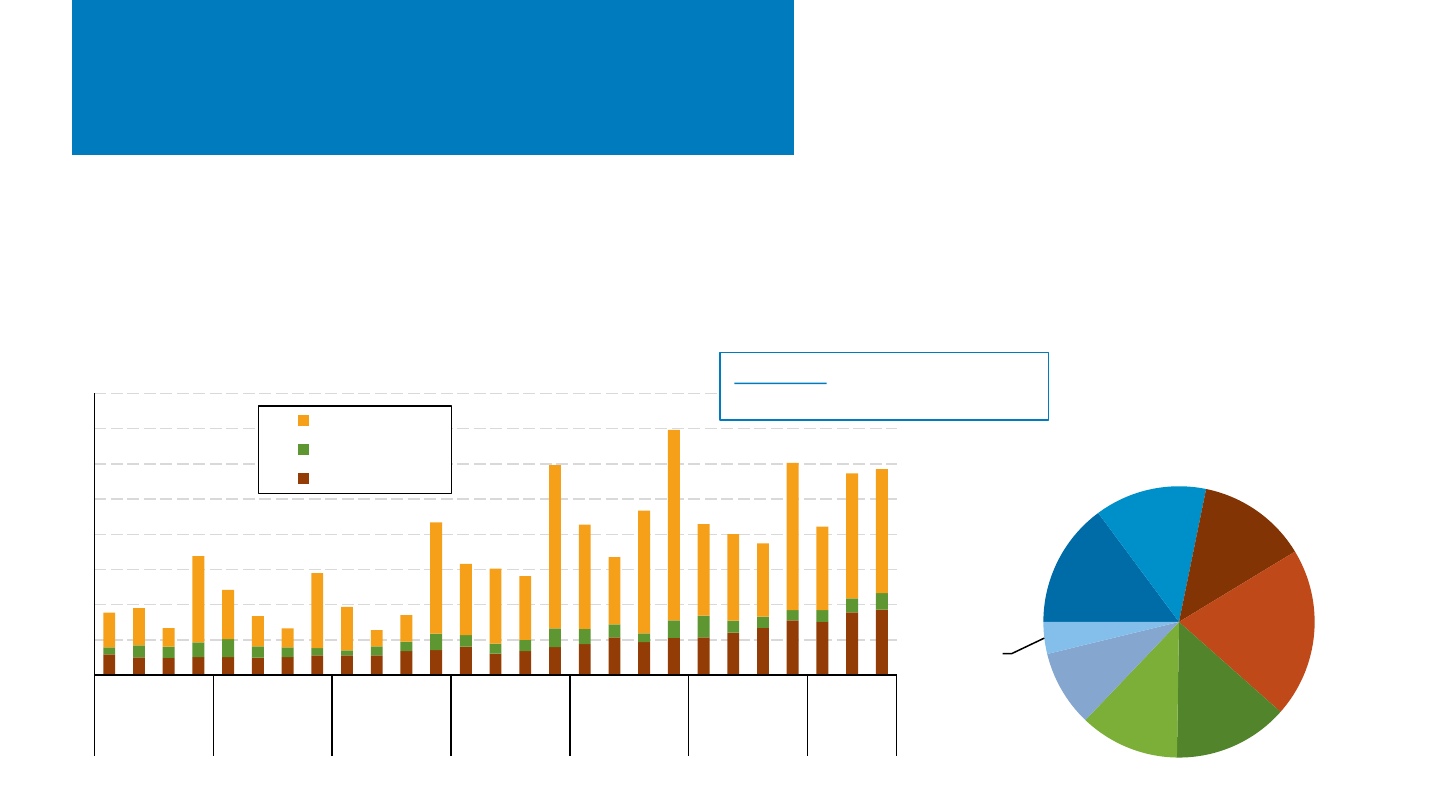
U.S. Installation Breakdown
Quarterly: EIA (GW
ac
)
• According to EIA data, the United States installed 15.8 GW
ac
of PV in
the first 9 months of 2023—a record—up 31% y/y (SEIA reported
19.3 GW
dc
).
– Residential (5.1 GW
ac
) remained up significantly YTD, 43% y/y, as
did utility-scale (9.4 GW
ac
—up 32%). Nonresidential was down
6% (1.2 GW
ac
).
• 46% of U.S. PV capacity installed in the first 9
months was in Texas, Florida, and California.
– 28 states installed more than 100 MW
ac
.
– California’s residential market kept
growing, Q/Q, throughout the year, not
yet showing any slowness caused by the
switch to NEM 3.0.
Note: EIA reports values in W
ac
, which is standard for utilities. The solar industry has traditionally reported in W
dc
. See the next slide for values reported in W
dc
.
Sources: EIA, “Electric Power Monthly,” forms EIA-023, EIA-826, and EIA-861 (November 2023, February 2022, February 2019).
13.2
1.5
3.9
0
1
2
3
4
5
6
7
8
Q1 Q2 Q3 Q4 Q1 Q2 Q3 Q4 Q1 Q2 Q3 Q4 Q1 Q2 Q3 Q4 Q1 Q2 Q3 Q4 Q1 Q2 Q3 Q4 Q1 Q2 Q3
2017 2018 2019 2020 2021 2022 2023
Quarterly PV Installed (GW
ac)
U.S. PV Installations by Market Segment
Utility-scale
C&I
Residential
Texas
15%
Southwest
13%
Florida
13%
California
20%
Midwest
14%
Southeast
12%
Northeast
9%
Other
4%
Q1-Q3 '23 U.S. PV Installations by Region
(15.8 GWac)
Click here to interactively view
these data on Tableau Public.
NREL | 17NREL | 17
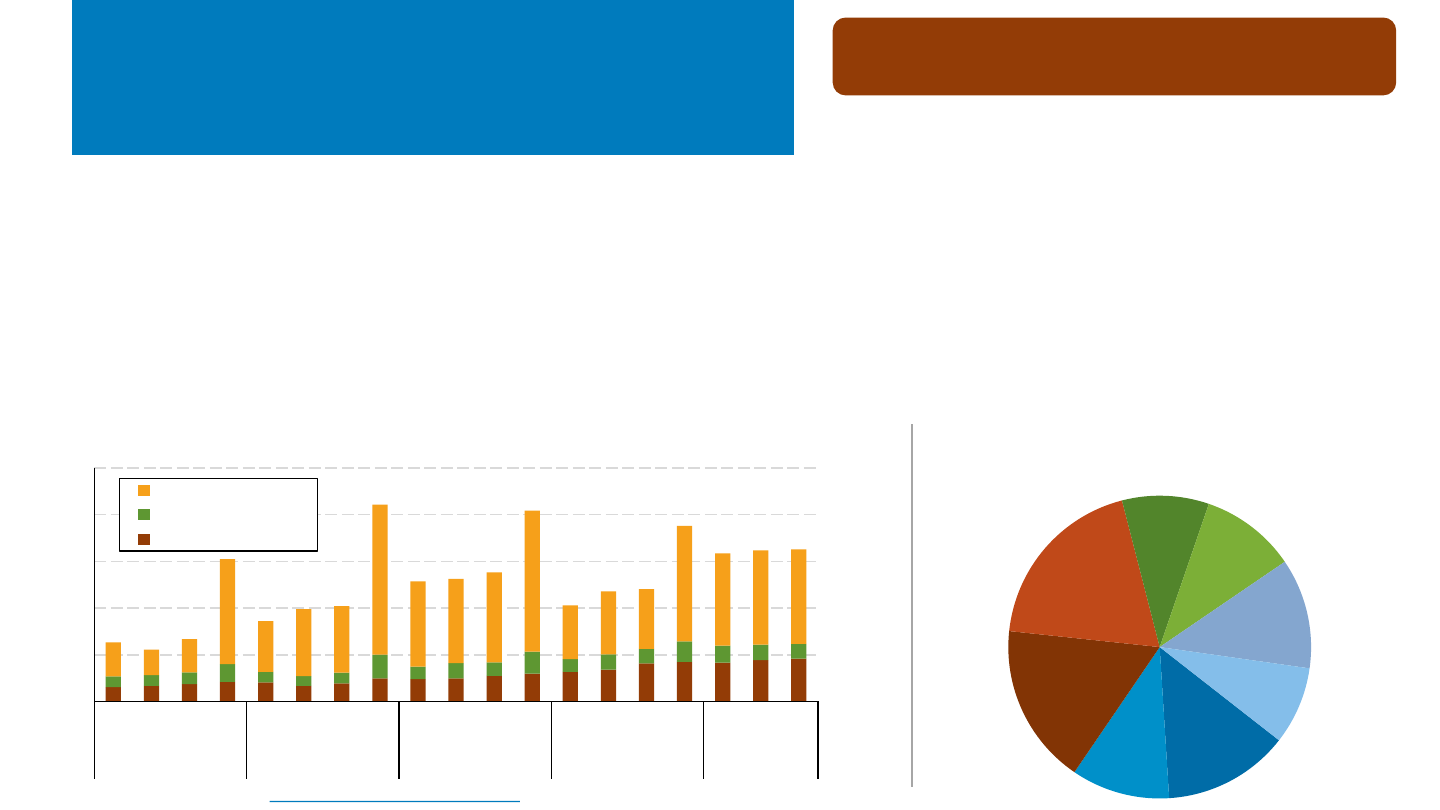
U.S. Installation Breakdown
Quarterly: SEIA (GW
dc
)
• Wood Mackenzie/SEIA reports a record first 9 months of PV installations, with 19.3 GW
dc
installed from Q1 to Q3 2023—an increase of
42% y/y.
– The utility-scale sector, up 59% from 2022 y/y, rebounded from supply chain issues, as supplier diversification and the CBP release
of module detentions has brought more modules to waiting project sites.
– The residential sector, up 24% y/y, has been boosted by the backlog of California project sales that qualified for NEM 2.0 getting
installed and interconnected, as well as the Northeast, where sales were boosted by retail rate increases (the Northeast is more
exposes to natural gas price increases). The growth is partially offset by rising interest rates that occurred in 2022, which caused
declines in sales volumes from loan companies in Arizona, Texas, and Florida.
Sources: Wood Mackenzie/SEIA: U.S. Solar Market Insight: Q4 2023.
Unlike the previous slide, these values are
in GW
dc
—not GW
ac
.
California
13%
Texas
11%
Southwest
17%
Florida
19%
Southeast
9%
Northeast
10%
Midwest
12%
Other
8%
Q1-Q3 23 U.S. PV Installations by Region
(19.3 GWdc)
0
2
4
6
8
10
Q1 Q2 Q3 Q4 Q1 Q2 Q3 Q4 Q1 Q2 Q3 Q4 Q1 Q2 Q3 Q4 Q1 Q2 Q3
2019 2020 2021 2022 2023
Quarterly PV Installed (GW
dc
)
U.S. PV Installations by Market Segment
Utility
Nonresidential PV
Residential PV
NREL | 18NREL | 18
0
10
20
30
40
50
60
70
80
U.S. Generation Capacity Additions (
GW
ac
)
Other
Nuclear
Natural Gas (Other)
Natural Gas CT
Natural Gas CC
Batteries
OSW
LBW
DPV
UPV
71%
U.S. Generation Capacity Additions by
Source: 2010–2023 and
Planned 2023–2025
Sources: EIA Form 860M/Preliminary Monthly Electric Generator Inventory (“Planned” and “Operating”) and EIA Short-Term Energy Outlook Table 7e,
downloaded October 6, 2023; Wood Mackenzie and SEIA US Solar Market Insight Full Report 2Q 2023, Sep 2023.
• EIA projects the percentage of U.S. electric
capacity additions from solar will grow from 46%
in 2022 (18 GW
ac
) to 54% in 2023 (31 GW
ac
), 63%
in 2024 (44 GW
ac
), and 71% in 2025 (51 GW
ac
).
– Starting in 2023, batteries are projected to be the
second-leading source of new generation capacity,
followed by land-based and offshore wind (LBW and
OSW).
– Natural gas is projected to account for 16% of new
capacity in 2023 but to drop to 4% and 8% in 2024 and
2025, respectively.
• From 2023 to 2025, EIA projects that PV, storage,
and wind will add 177 GW
ac
of capacity additions.
Began operating
through Oct. 2023
Planned Nov./Dec.
2023 and full
2024/2025
Click here to interactively view
these data on Tableau Public.
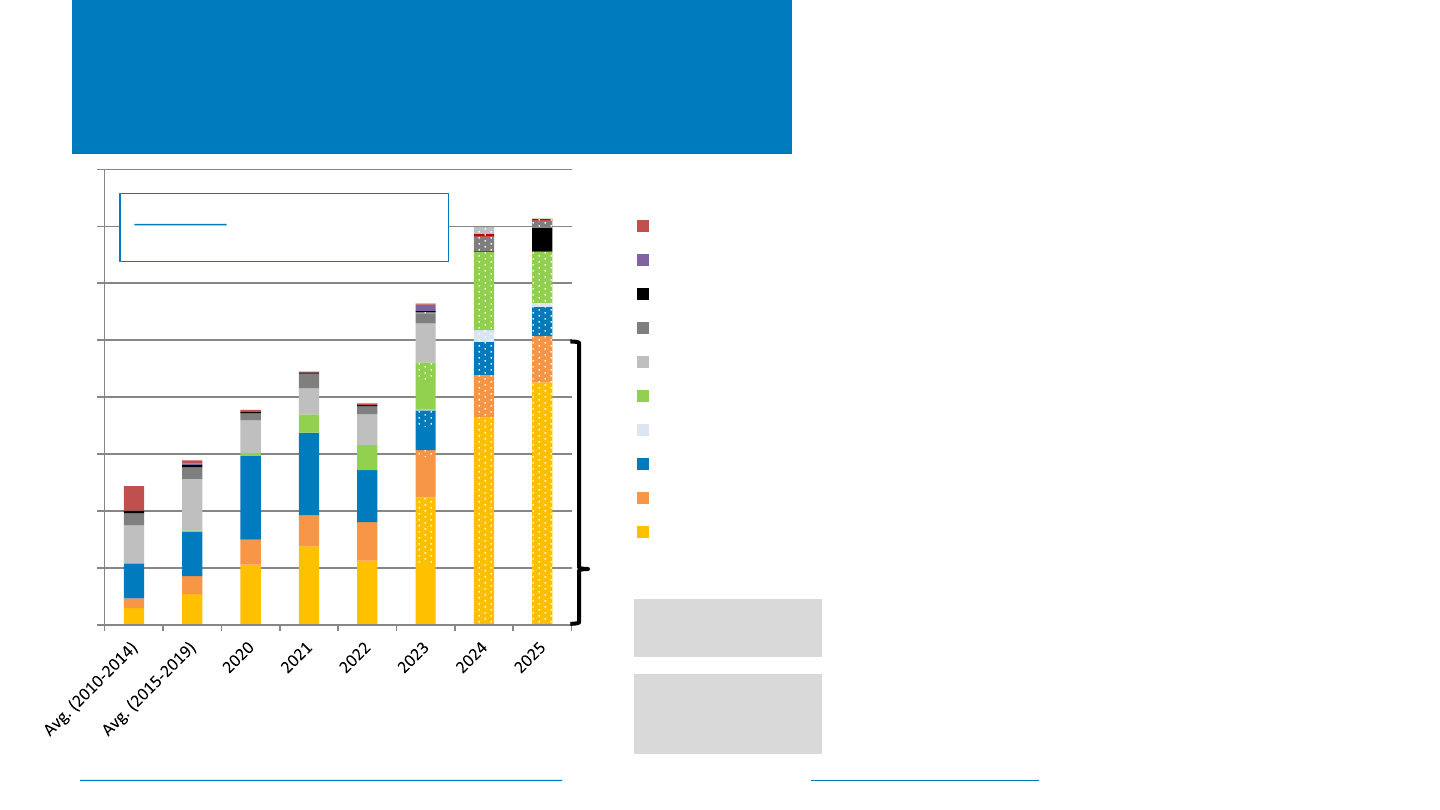
NREL | 19NREL | 19
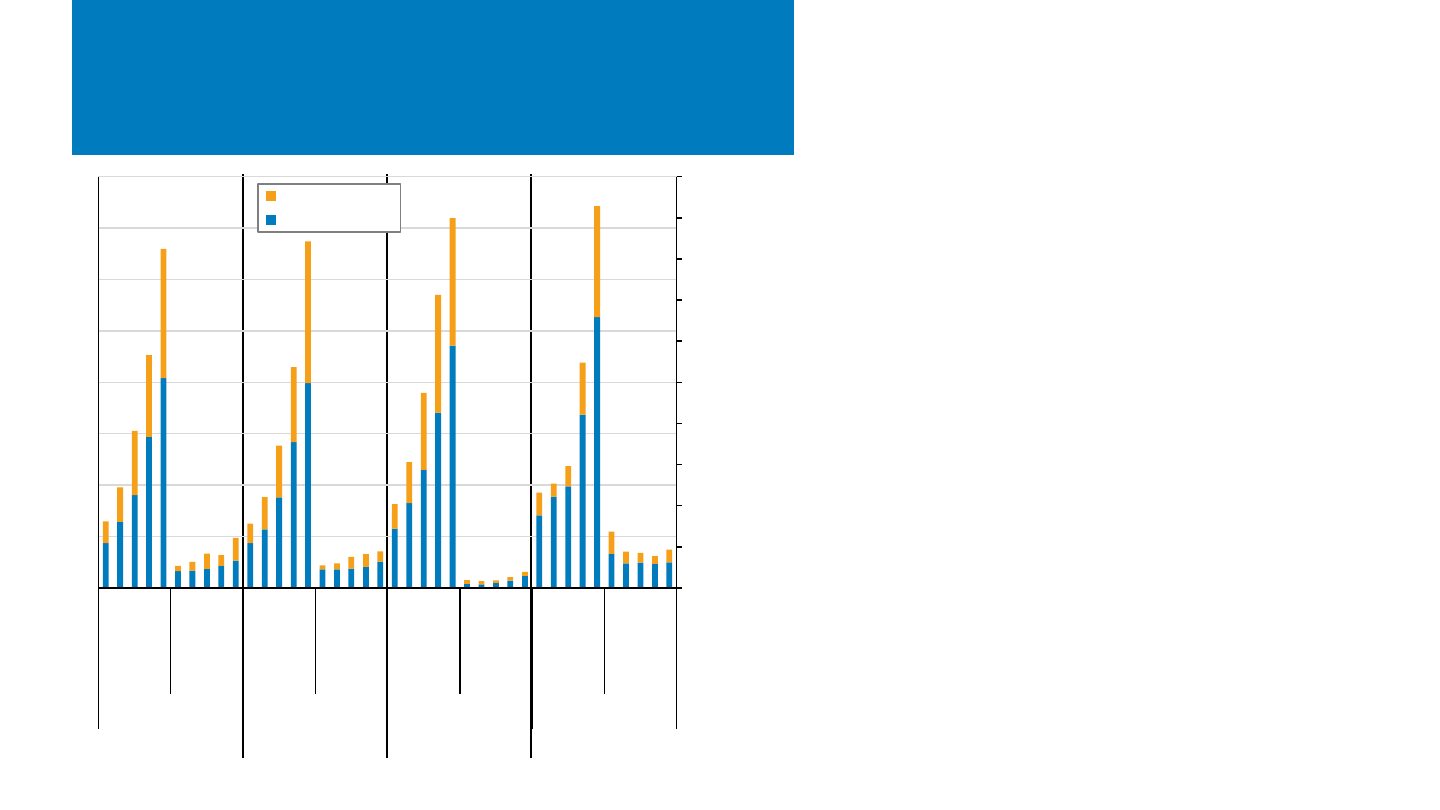
0
10
20
30
40
50
60
70
2021 2022 2023E 2024P 2025P 2026P 2027P
PV Annual Installations (GW
dc
)
Residential C&I Utility-Scale
Annual U.S. PV Deployment
Notes: E = estimate; P = projection. Bars represent median U.S. projections. Error bars represent high and low U.S. projections. Where sector medians do not sum to U.S.
medians, the differences are reconciled by multiplying the median percentage contribution from each sector by the total U.S. median values so the correct total U.S. median
values are retained. Pie chart shows projected contributions from each region, 2021–2027.
Sources: BNEF, 4Q 2023 Global PV Market Outlook, 11/22/23; EIA, Annual Energy Outlook 2023, 3/23; Goldman Sachs Equity Research, America’s Clean Technology: Solar,
12/17/23; SolarPower Europe, Global Market Outlook For Solar Power 2023-2027, 6/23; Wood Mackenzie and SEIA, US Solar Market Insight, Q4 2023.
• Annual deployment of PV in the United States was
estimated to have grown by about 55% between
2022 and 2023, to 33 GW
dc
.
• Analysts project continued increases in annual U.S. PV
installations:
– 36 GW
dc
in 2024 (+10% y/y)
– 40 GW
dc
in 2025 (+10% y/y)
– 43 GW
dc
in 2026 (+9% y/y)
– 48 GW
dc
in 2027 (+12% y/y)
• Utility-scale PV drives the 2023–2027 growth, with
the highest compound annual growth rate:
– Utility-scale 12%
– Commercial and industrial (C&I) 8%
– Residential 5%
• The variability in deployment projections suggests
significant upside potential.
• Over the period shown, deployment is geographically
diverse, with Texas, California, and Florida as the top
states and considerable capacity in several regions.
Midwest
21%
Texas
20%
Southeast
13%
Calif.
13%
Southwest
13%
Northeast
10%
Fla.
6%
Northwest
3%
Alaska &
Hawaii
1%
NREL | 20NREL | 20
0
1,000
2,000
3,000
4,000
5,000
6,000
7,000
8,000
Q1 Q3 Q1 Q3 Q1 Q3 Q1 Q3 Q1 Q3 Q1 Q3 Q1 Q3
2017 2018 2019 2020 2021 2022 2023
Energy Storage Installed (MWh)
U.S. Energy Storage Installations by Market Segment
Grid-Scale (MWh)
CCI (MWh)
Residential (MWh)
0
150
300
450
600
750
900
1,050
1,200
1,350
1,500
1,650
1,800
1,950
2,100
2,250
2,400
2,550
Energy Storage Installed (MW)
Grid-Scale (MW)
CCI (MW)
Residential (MW)
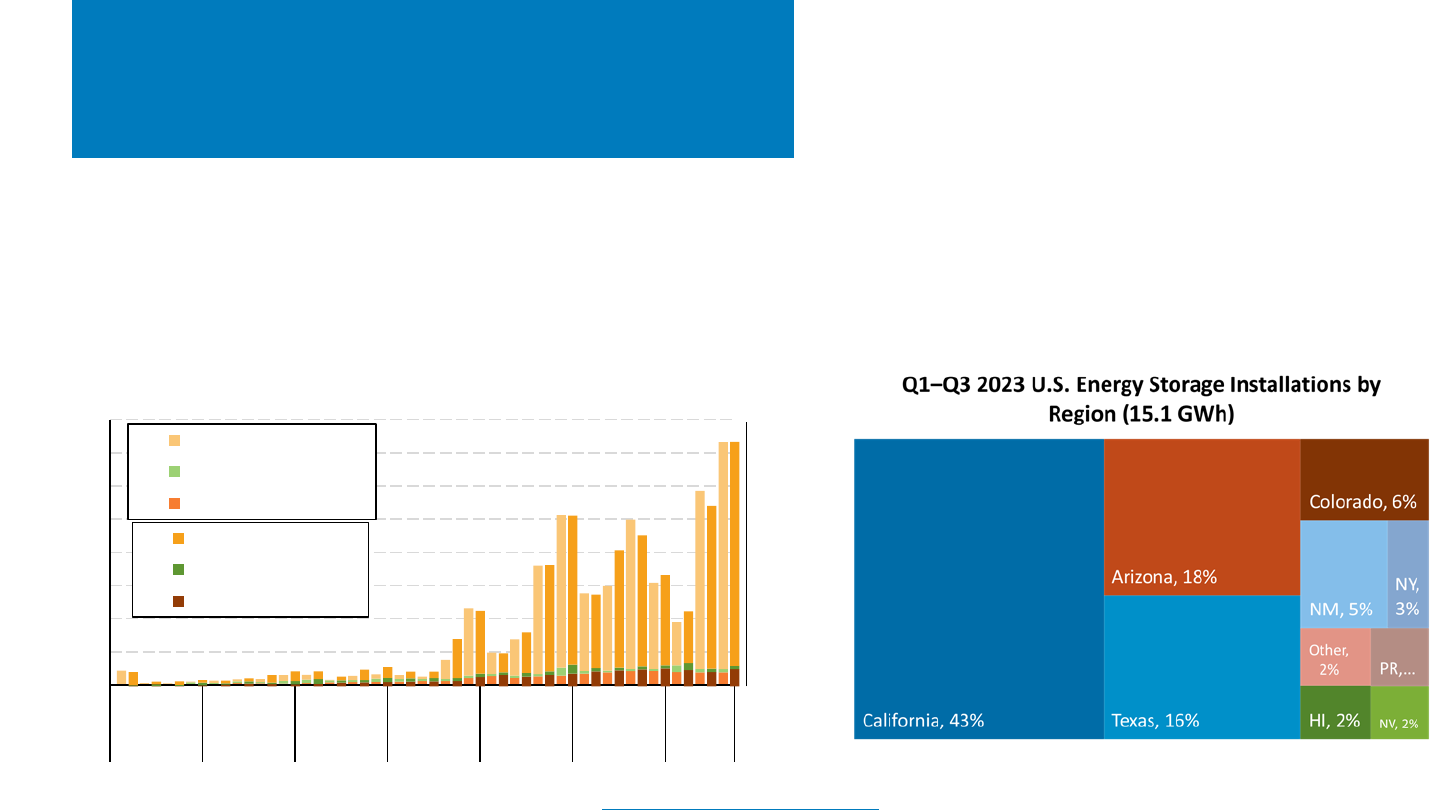
U.S. Energy Storage Installations by
Market Segment
• In 2023 YTD, two states dominated most energy storage
markets:
– California and Texas represented 62% of grid-scale
installations. Arizona was another 21%.
– California and New York represented 88% of battery
energy storage in the CCI market; Massachusetts was a
large CCI market, but its SMART program is tapering
down.
– California and Puerto Rico represented 62% of residential
energy storage installs YTD. Texas and Hawaii also
contributed a combined 16%.
• The United States installed approximately 15.1 GWh (4.8 GW
ac
) of energy storage
onto the electric grid in the first 9 months of 2023, +40% (+32%) y/y, as a result
of growth in the grid-scale and CCI sectors.
– The residential market was relatively flat in part because of California’s large market
share, which shrank due to a large proportion of PV-only sales to take advantage of
an expiring NEM 2.0.
– SMUD installed 0.5 MW of eventual 200-MW long-duration iron flow battery
storage.
Note: “Grid-scale” refers to all projects deployed on the utility side of the meter, regardless of size or ownership; “CCI” refers to “community-scale, commercial, and industrial.”
Source: Wood Mackenzie Power & Renewables and Energy Storage Association, U.S. Energy Storage Monitor: Q4 2023.
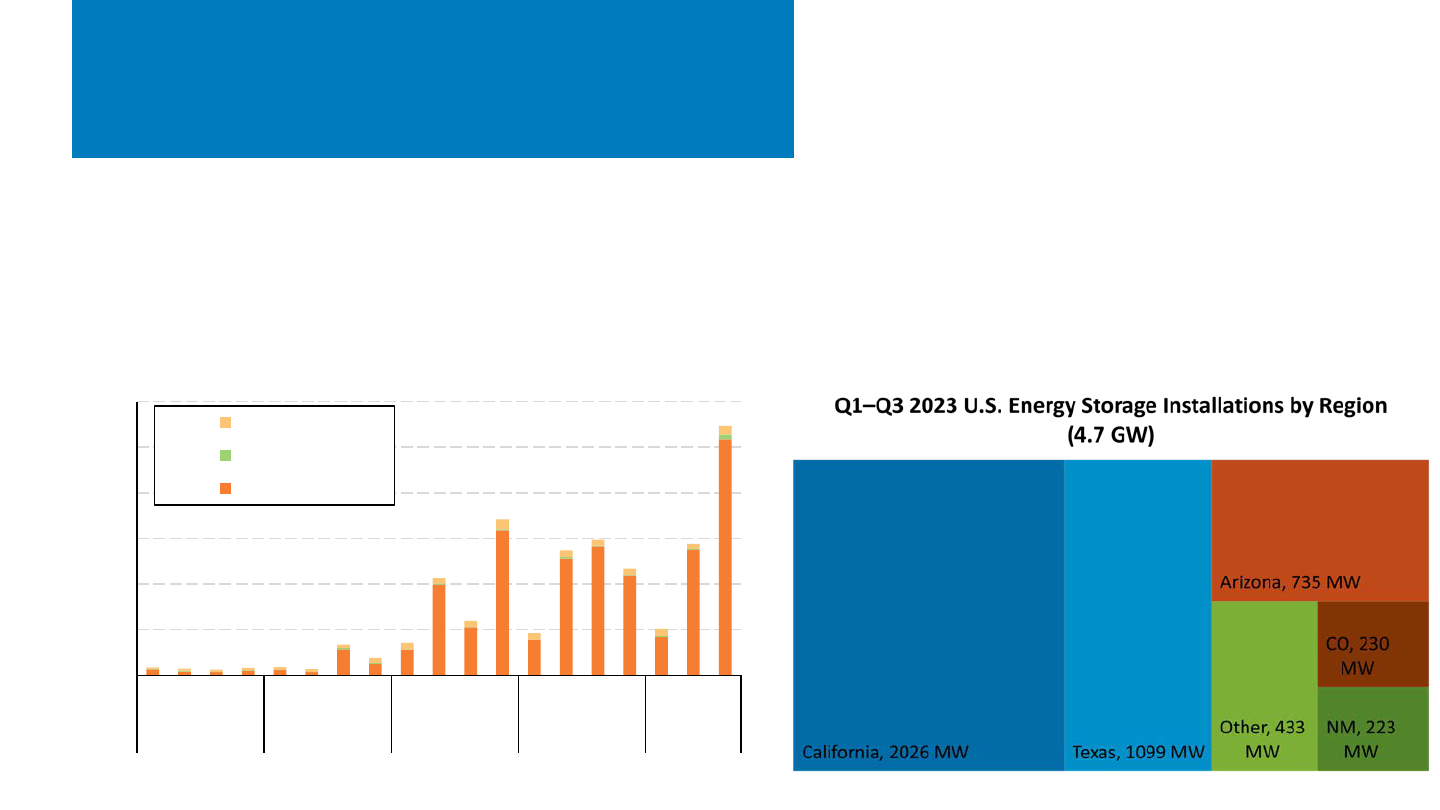
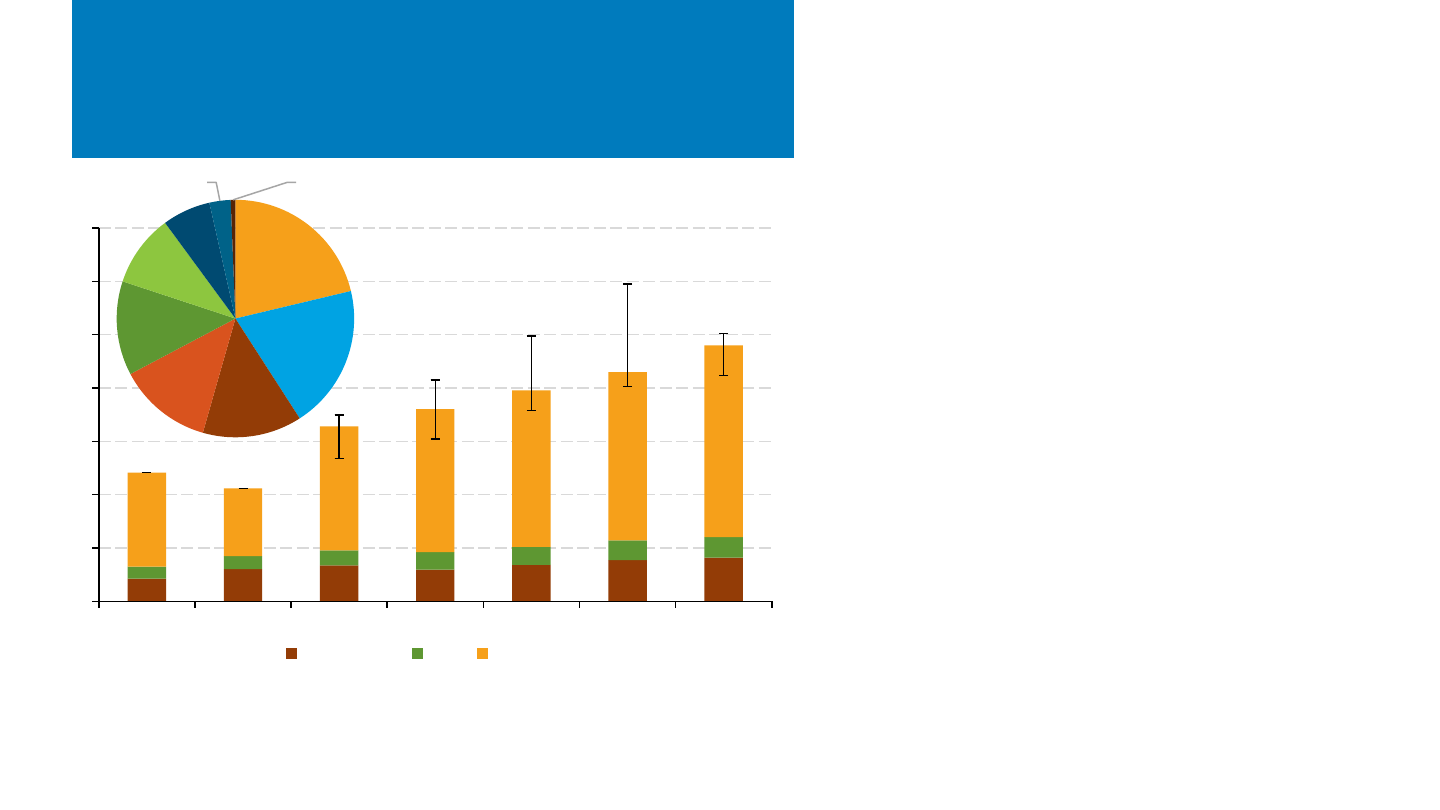
NREL | 21NREL | 21
U.S. Energy Storage Installations
by Market Segment (EIA)
• California represented approximately 43% of
battery storage capacity installed in the first 9
months of 2023, followed by Texas (23%).
– The top five markets represented 91% of installed
energy storage capacity.
• EIA reports that the United States installed approximately
4.7 GW
ac
of energy storage onto the electric grid in the
first 9 months of 2023—up 39% y/y, bringing total U.S.
battery storage capacity to 16.7 GW
ac
(~43 GWh).
Sources: EIA Form 860M, EIA Form 861M.
0
500
1,000
1,500
2,000
2,500
3,000
Q1 Q2 Q3 Q4 Q1 Q2 Q3 Q4 Q1 Q2 Q3 Q4 Q1 Q2 Q3 Q4 Q1 Q2 Q3
2019 2020 2021 2022 2023
Energy Storage Installed (MW)
U.S. Energy Storage Installations by Market Segment
Residential
C&I
Utility-scale
NREL | 22NREL | 22
Solar Consumer Complaints—and
Protections—On the Rise
Sources: BBB, “BBB Complaint and Inquiry Statistics”; CESA, “Program Areas”; Consumer Financial Protection Bureau, “Consumer Complaint Database”; California Public Utilities
Commission, “California Solar Consumer Protection Guide”; IREC, “Consumer Protection”; NREL, “Solar Consumer Protection”; SEIA, Consumer Protection Primer, “Solar 101:
Consumer Protection,” “Solar Business Code”; Solar Power World (8/16/21); Time (9/23, 11/23); Utility Dive (6/22/23); Wood Mackenzie & SEIA, Q3 2023 Solar Market Insight, 9/23.
• From 2017 to 2022, annual solar-related
complaints to the U.S. Better Business Bureau
(BBB) grew 3 times faster than U.S. residential PV
capacity:
– Top complaint categories included “Solar Energy
Contractors,” “Solar Energy Equipment Dealers,”
and “Solar Energy Design.”
– Solar-related complaints to the Federal Trade
Commission, Consumer Financial Protection
Bureau, and many state agencies also increased.
• Common complaints include:
– Misrepresenting solar costs and benefits
– Misrepresenting financing terms and government
incentives
– Aggressive sales and marketing tactics
– Unsolicited robocalls.
• Resources, training, regulations, and legal actions
are being instituted to protect consumers and the
solar industry’s image by, for example:
– Clean Energy States Alliance (CESA)
– Interstate Renewable Energy Council (IREC)
– Solar Energy Industries Association (SEIA)
– State solar associations
– Other nonprofit organizations
– State legislators, regulators, attorneys general.
0
2,000
4,000
6,000
8,000
10,000
12,000
2017 2018 2019 2020 2021 2022
Annual BBB complaints (no.),
residential PV installations (
MW
dc
)
Solar Energy Contractors Solar Energy Equipment Dealers
Solar Energy Design Solar Energy Equipment
Solar Energy Products Solar Installation
Solar Energy Product Services Solar Energy Development
Solar Energy Parts Residential PV Installations
Solar BBB complaints (↑540%)
Residential PV capacity (↑170%)
NREL | 23
4,000
6,000
8,000
10,000
12,000
14,000
16,000
18,000
20,000
22,000
24,000
26,000
28,000
12am 3am 6am 9am 12pm 3pm 6pm 9pm
Average Hourly Net Load (March 15–April 15)
2014 2015 2016 2017 2018
2019 2020 2021 2022 2023
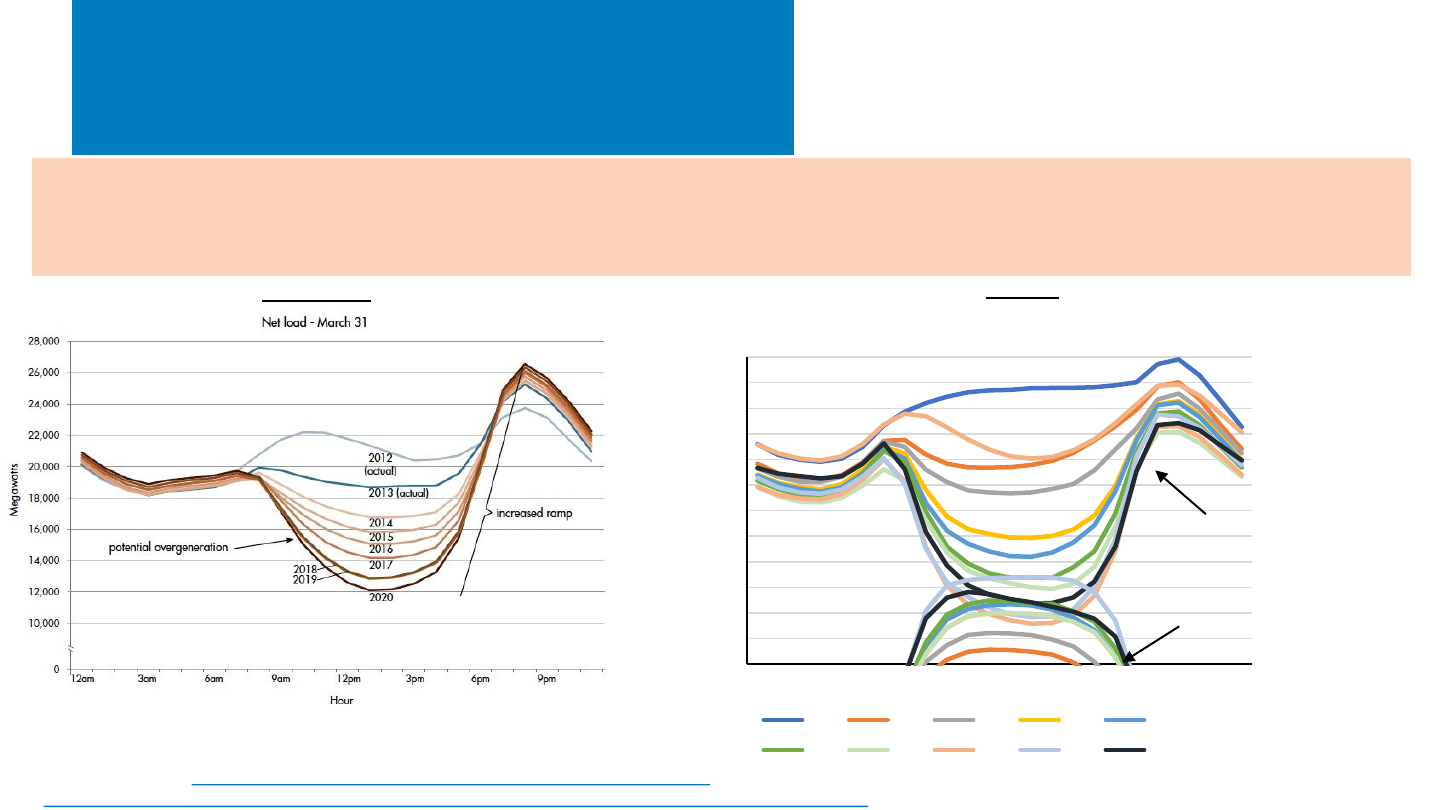
The “Duck Curve” graphic, developed in 2013, predicted that as solar became a larger part of CAISO’s electricity mix, there would
be potential periods of overgeneration and the need for an increased ramp rate―particularly in the springtime when PV is
generating a lot of energy in the middle of the day but demand is low (i.e., not hot enough for AC use). The Duck Curve has
generally come to pass―midday net load has dropped more than predicted, though evening peak has not been as great.
Predicted
Actual
Note: net load = load – solar & wind production. Includes curtailment.
Sources: CAISO: http://www.caiso.com/informed/Pages/ManagingOversupply.aspx; DOE:
https://www.energy.gov/eere/articles/confronting-duck-curve-how-address-over-generation-solar-energy.
Utility solar
generation
Net load
Duck Curve: Predicted vs.
Actual
NREL | 24
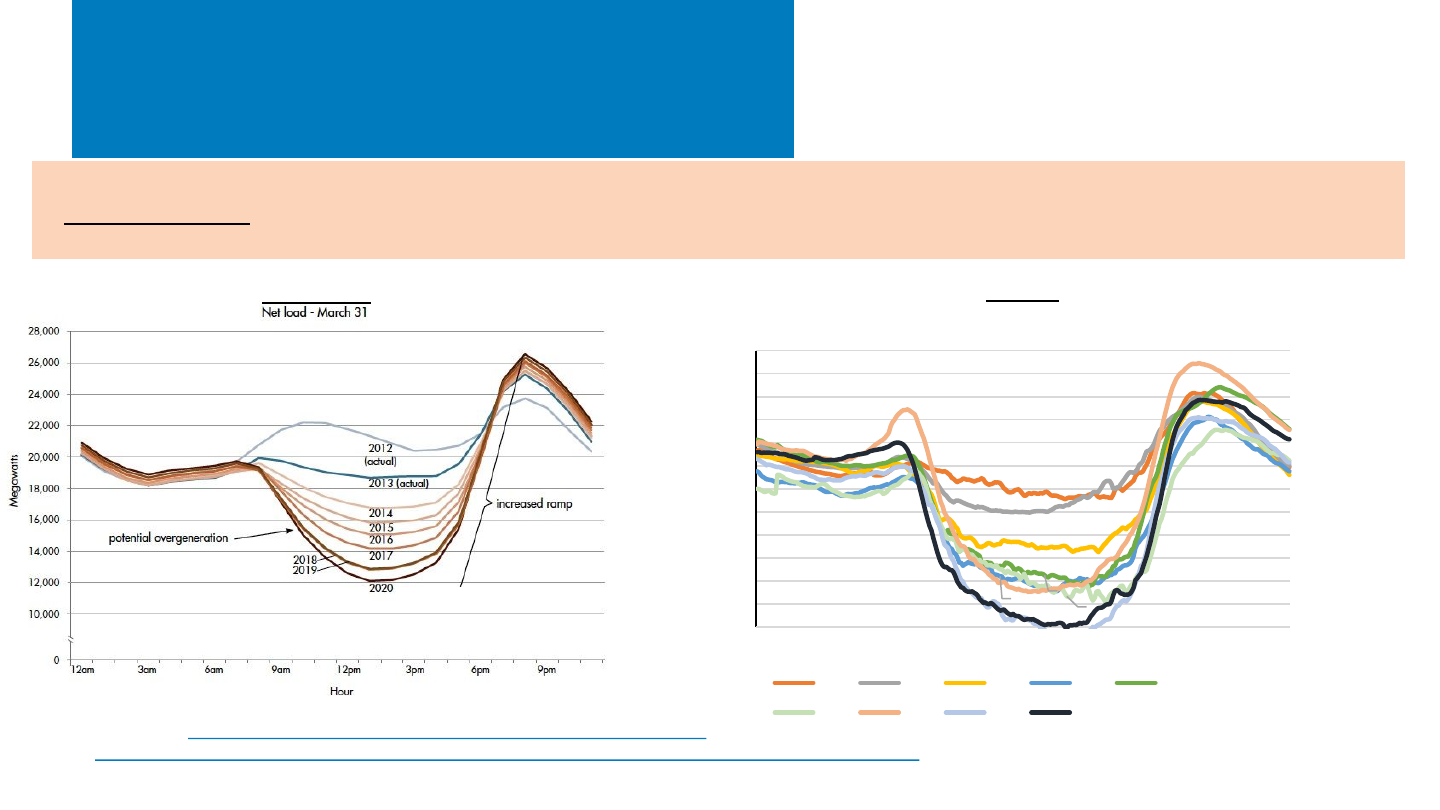
Individual days have experienced significantly lower minimum net load and larger evening ramps.
Predicted
Actual
Note: net load = load – solar & wind production.
Sources: CAISO: http://www.caiso.com/informed/Pages/ManagingOversupply.aspx
DOE: https://www.energy.gov/eere/articles/confronting-duck-curve-how-address-over-generation-solar-energy
2015
2016
2017
2018
2019
2020
4,000
6,000
8,000
10,000
12,000
14,000
16,000
18,000
20,000
22,000
24,000
26,000
28,000
12am 3am 6am 9am 12pm 3pm 6pm 9pm
Megawatts
Actual CAISO Net Load (individual days from March 15 - April 15
2015 2016 2017 2018 2019
2020 2021 2022 2023
Duck Curve – Predicted vs.
Actual (specific days of year)
NREL | 25
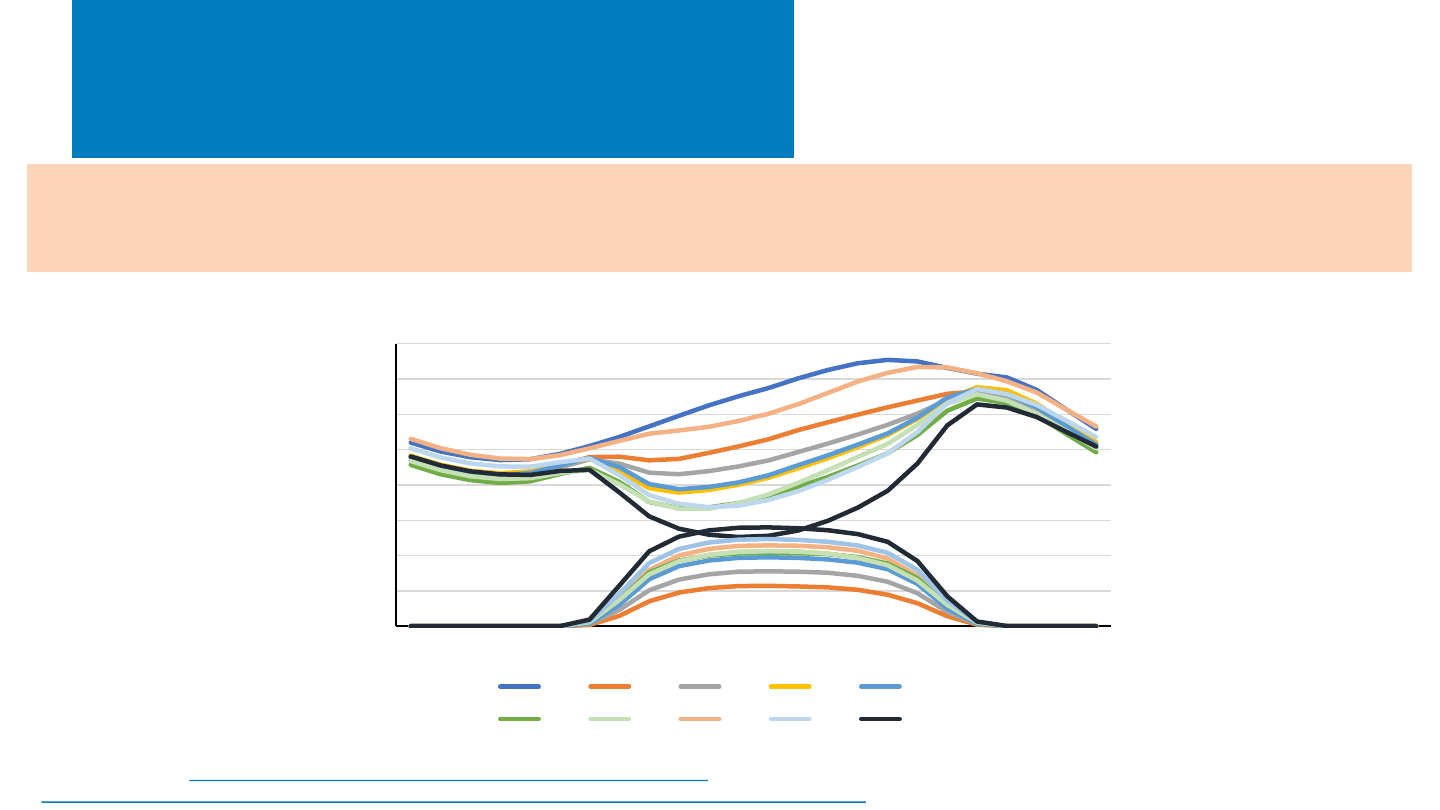
The “Duck Curve” problem is most severe at particular times of the year. In the summer, demand for cooling during the middle of the
day within CAISO mitigates much of the dip in net load. In other parts of the year, solar does not produce as much. Additionally, other
regions do not necessarily have the same solar production and demand profiles to cause such a problem.
Note: net load = load – solar & wind production.
Sources: CAISO: http://www.caiso.com/informed/Pages/ManagingOversupply.aspx; DOE:
https://www.energy.gov/eere/articles/confronting-duck-curve-how-address-over-generation-solar-energy.
0
5,000
10,000
15,000
20,000
25,000
30,000
35,000
40,000
12am 3am 6am 9am 12pm 3pm 6pm 9pm
Net Load (July–September)
2014 2015 2016 2017 2018
2019 2020 2021 2022 2023
Duck Curve: Seasonality
NREL | 26
CAISO has mostly dealt with overproduction through curtailment of solar electricity, but over the course of the year, this has not
represented a large amount of energy (though it reached 24% in March 2023). Curtailment has also been driven by other non–Duck
Curve factors, such as local transmission and reliability constraints. Ramping, though also an issue, is something that has been
managed.
Sources: CAISO: http://www.caiso.com/informed/Pages/ManagingOversupply.aspx
0%
1%
2%
3%
4%
5%
6%
7%
2015 2016 2017 2018 2019 2020 2021 2022 2023
CAISO Solar Curtailment (by % of capacity):
Annual
Duck Curve: Curtailment
0%
5%
10%
15%
20%
25%
May-14
Oct-14
Mar-15
Aug-15
Jan-16
Jun-16
Nov-16
Apr-17
Sep-17
Feb-18
Jul-18
Dec-18
May-19
Oct-19
Mar-20
Aug-20
Jan-21
Jun-21
Nov-21
Apr-22
Sep-22
Feb-23
Jul-23
CAISO Solar Curtailment (by % of capacity):
Monthly
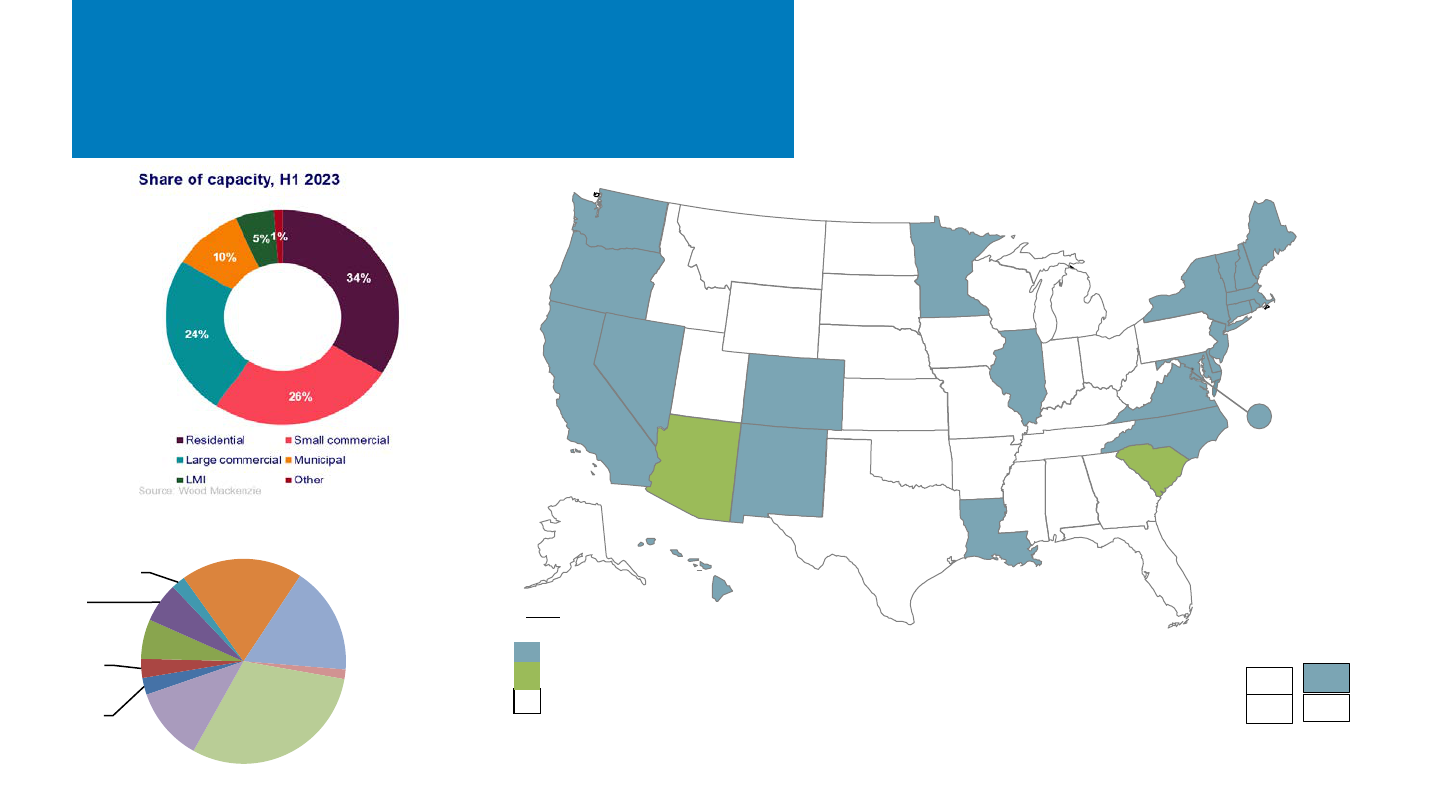
NREL | 27
California
3%
Colorado
3%
Illinois
6%
Maine
6%
Maryland
2%
Mass.
19%
Minnesota
17%
New Jersey
2%
New York
30%
Other
12%
Community Solar Capacity, H1 23 (6 GW)
Sources: DSIRE USA; Wood Mackenzie and SEIA.
22 States + DC
and PR currently have
adopted community
solar rules
Community solar policy adopted
No policy, but individual utilities may have programs
www.dsireusa.org/November 2023
*
KEY
U.S. Territories:
DC
GU
AS
PR
VI
Policy adopted providing community solar option
2 states have rules giving
utilities the option to create
community solar programs
*
New Orleans local policy also establishes
a community solar program
Community Solar Programs in
the U.S.

NREL | 28NREL | 28
Cost of Capital, Tax Equity
(Norton Rose Fulbright)
• Tax equity investors invested $20–$21 billion in 2023, with some of that
volume coming from 2022 transactions that were delayed:
• The deals were split relatively evenly between wind and
solar+storage.
• Upwards of 40% of solar deals used the PTC, and some transactions
involved solar using PTC and batteries using ITC.
• There was also another ~$4B in tax credit sales (which includes some non-
generation credits, such as 45X).
• Investors predicted additionality, as opposed to cannibalization of
the tax equity market, caused by tax credit sales.
• Tax credit sales prices started at 90%–93% but have recently been
seen as high as 97%. Price can depend on factors such as insurance
products associated with a deal.
• There are various reasons sponsors would still choose tax equity over
a credit sale: additional markup value; monetizing the accelerated
depreciation expense; timing of when money is received.
• Tax equity flip yields are up 100 to 200 basis points from summer 2022 (up to
an estimated 8%–9% level), as interest rates have increased and there is
more demand for tax equity than supply.
Sources: Norton Rose Fulbright Cost of Capital: 2024 Outlook; Proposed Basel II Rules.
• In July 2023, the federal government issued proposed rules to
large banks, similar to those passed internationally (i.e., “Basel
III”). These rules would require banks with tax equity
investments to quadruple the required cash on their balance
sheet (i.e., capital requirements) for making tax equity
investments compared to what they do now. This would
increase the cost of tax equity and drive some funders out of the
market. The regulations would impact PTC transactions less than
ITC transactions. Banks are hoping the regulators will make
changes for the final rules; however, if there is no resolution,
banks may pause funding midyear. Currently clauses are being
put in transactions that would allow banks to back out if the final
rules are unfavorable. The proposed rules would not take effect
until 2025.
0
5
10
15
20
25
30
2017 2018 2019 2020 2021 2022 2023
U.S. Tax Equity Investments ($B)
Tax credit sales
Tax equity investments

NREL | 29NREL | 29
Cost of Capital, Bank Debt
(Norton Rose Fulbright)
• Bank debt was >$115B in 2023 from 226 deals―similar to 2022, another record year.
Regional banks are beginning to lend again after issues in 2022 (e.g., Silicon Valley Bank).
• Banks are lending plain “vanilla” projects at 7% with a bank margin of 175 points―in June
2022, the same loan would be 3.5%–4.0%.
• A merchant deal would increase the cost by 75–150 basis points.
• The debt service coverage ratio (DSCR) is 1.25 (P50)/1.0 (P99) for solar projects, 1.15 for
storage projects, and 1.3–1.4 (P50)/1.0 (P99) for wind projects.
• For merchant projects, the DSCR increases to 1.75 (P50) for solar, 2.0 for storage,
and 1.8–2.0 (P50)/1.4-1.5 (P99) for wind.
Note: P50 represents an average level of energy production (or 50% likelihood to generate that much or more electricity), and P99 represents a
production level that the project has a 99% chance of exceeding.
Source: Norton Rose Fulbright Cost of Capital: 2024 Outlook.

NREL | 30
Global Solar Deployment1
U.S. PV Deployment
2
PV System Pricing
3
Global Manufacturing
4
Component Pricing
5
U.S. PV Imports
6
7 PV Waste and Toxicity
Agenda
From H2 2022 to H2 2023 (partial), the median reported
distributed PV system price in Arizona, California,
Massachusetts, and New York:
• Decreased 0.2% to $4.25/W
dc
for systems 2.5 to 10 kW
• Decreased 4% to $3.66/W
dc
for systems 10 to 100 kW
• Increased 2% to $2.49/W
dc
for systems 100 to 500 kW
• Increased 7% to $1.92/W
dc
for systems 500 kW to 5
MW.
NREL | 31NREL | 31
$2.84
$2.82
$2.84
$3.01
$3.42
$1.24
$1.17
$1.29
$1.10
$1.06
$0.15
$0.14
$0.17
$0.15
$0.15
1.86
2.32
1.6
1.6
1.4
0%
5%
10%
15%
20%
25%
30%
35%
$0.0
$1.0
$2.0
$3.0
$4.0
$5.0
$6.0
$7.0
Q3 '22 Q4 '22 Q1 '23 Q2 '23 Q3 '23
Sunrun
Battery Attachment Rate
Installed Cost ($/W
dc
)
Installation Sales G&A Net Value or Gross Margin Battery Attachment Rate
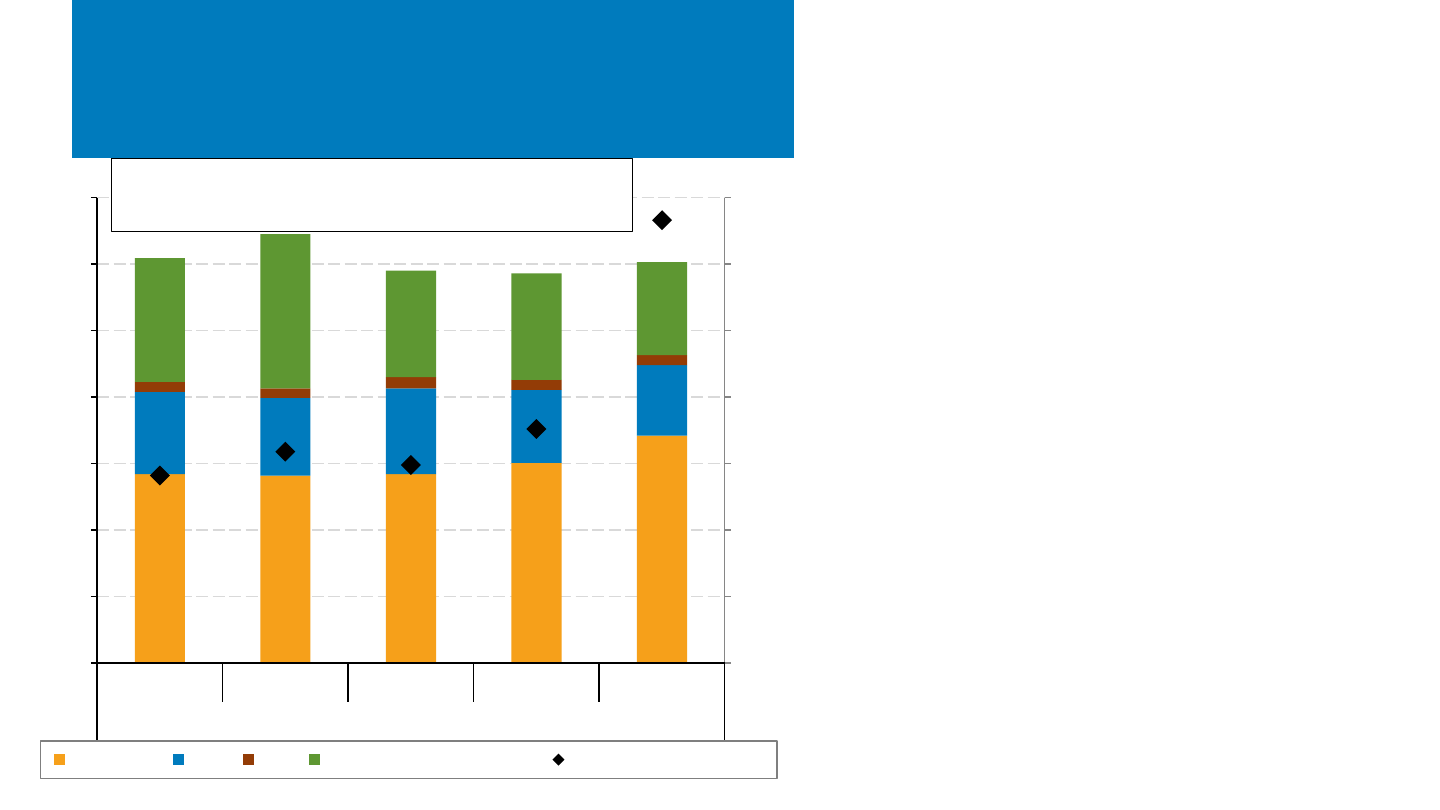
Large Residential Installer
Cost and Value, Q3 2023
Source: Corporate filings
Large residential installer Sunrun reported a system
value change of -1% y/y and +3% q/q.
Factors reported as supporting higher system value
and/or costs (for Sunrun, SunPower, and Sunnova):
• Increasing inflation and interest rates
• Increasing retail electricity rates
• Increasing battery attachment rates (batteries add
cost but can yield higher margins):
– Sunrun rate rose from 18% to 33% q/q (100%
in HI and PR, 44% in CA, 4% elsewhere)
– Up to 85%+ recent rate in California and 40%+
nationwide
– Sunrun reports “rapidly transitioning to a
storage-first company.”
Factors reported as supporting lower PV system costs
and/or higher margins now and in future:
• Forthcoming Investment Tax Credit adders
• Declining equipment prices
– Module and battery procurement costs down
by >20% compared with recent highs
– Cost reductions expected to have impact over
at least the next several quarters
• Process cost cutting via artificial intelligence
Mostly systems leases—bars represent subscriber value including the net
present value of contracted cash flows, tax credits, and other benefits,
including an assumed contract extension
NREL | 32NREL | 32
Distributed PV System Pricing From
Select States
From H2 2022 to H2 2023 (partial), the median
reported distributed PV system price—in nominal
U.S. dollars (USD)—across Arizona, California,
Massachusetts, and New York:
• Decreased 0.2% to $4.25/W
dc
for systems 2.5 to 10 kW
• Decreased 4% to $3.66/W
dc
for systems 10 to 100 kW
• Increased 2% to $2.49/W
dc
for systems 100 to 500 kW
• Increased 7% to $1.92/W
dc
for systems 500 kW to 5
MW.
From H2 2022 to H2 2023 (partial), the median
reported distributed PV system price—in 2022
(inflation-adjusted) dollars—across these states:
• Decreased 3% for systems 2.5 to 10 kW
• Decreased 7% for systems 10 to 100 kW
• Decreased 2% for systems 100 to 500 kW
• Increased 3% for systems 500 kW to 5 MW.
Adjusting for inflation reveals the continuing real
distributed PV price reductions over the past several
years of economic volatility.
2023 MW data YTD: Arizona (290), California (1,566), Massachusetts (77), New York (596).
Note: System prices above $10/W and below $0.75/W were removed from the data set. There were not enough
reported prices for systems above 5 MW in the data set to show a trend over time.
Sources: Arizona Goes Solar (1/2/24); California Distributed Generation (11/30/23); Massachusetts Lists of
Qualified Generation Units (12/6/23); Solar Electric Programs Reported by NYSERDA (1/4/24).
$0.0
$1.0
$2.0
$3.0
$4.0
$5.0
H1 H2 H1 H2 H1 H2 H1 H2 H1 H2 H1 H2
(part)
2018 2019 2020 2021 2022 2023
System Price ($/W
dc
)
2.5–10 kW (2022 USD) 10–100 kW (2022 USD)
100–500 kW (2022 USD) 500 kW – 5 MW (2022 USD)
2.5–10 kW (nominal USD) 10–100 kW (nominal USD)
100–500 kW (nominal USD) 500 kW – 5 MW (nominal USD)
NREL | 33NREL | 33
$0
$1
$2
$3
$4
$5
$6
$7
AZ CA MA NY AZ CA MA NY AZ CA MA NY AZ CA MA NY NY
2.5 kW–10 kW 10 kW–100 kW 100 kW–500 kW 500 kW–5 MW 5 MW+
System Price ($/W
dc
)
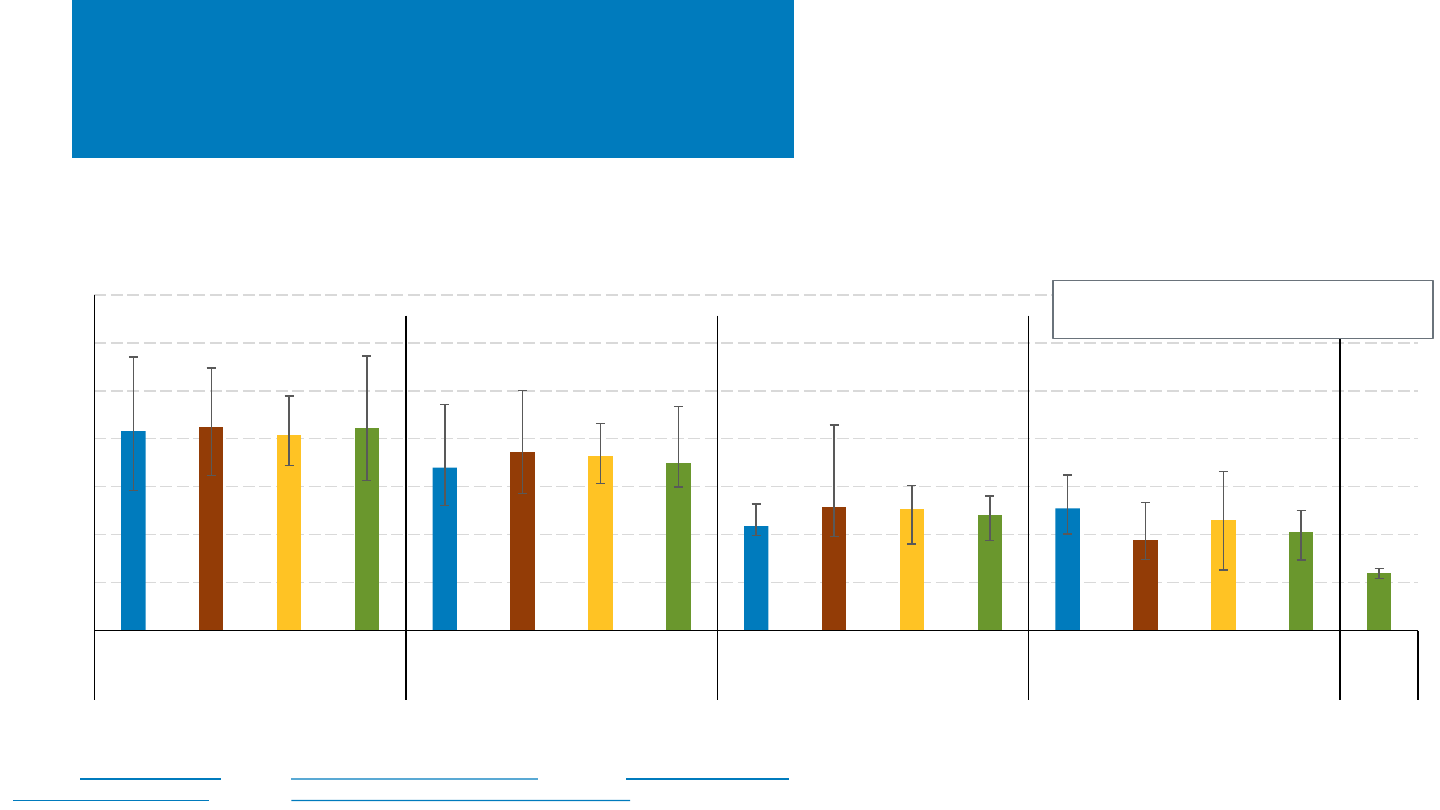
Distributed System Pricing From
Select States, H2 2023 (partial)
• For systems of 2.5–10 kW, nominal price changes varied
between H2 2022 and H2 2023 (partial):
– -5% in Arizona, no change in California, +4% in
Massachusetts, -1% in New York.
• In addition to price differences based on system size, there is variation
between states and within individual markets.
• Dollar-per-watt prices generally decrease as system size increases.
Bars represent the median, with error bars
representing 80
th
and 20
th
percentiles.
2023 MW data YTD: Arizona (290), California (1,566), Massachusetts (77), New York (596).
Note: System prices above $10/W and below $0.75/W were removed from the data set.
Sources: Arizona Goes Solar
(1/2/24); California Distributed Generation (11/30/23); Massachusetts Lists of
Qualified Generation Units
(12/6/23); Solar Electric Programs Reported by NYSERDA (1/4/24).
NREL | 34NREL | 34
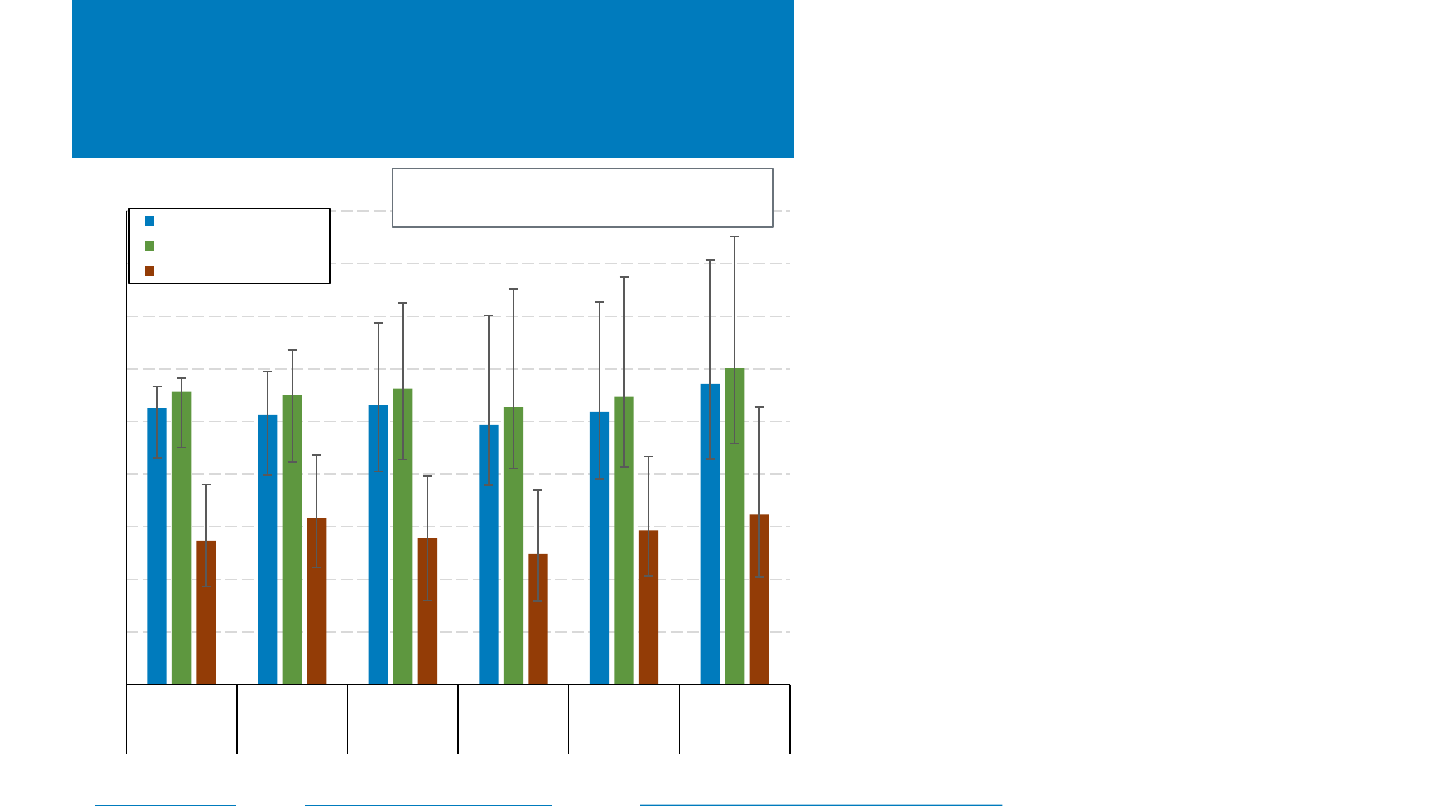
Residential U.S. PV+Storage Pricing
2023 YTD residential PV+storage sample, after data cleaning (MW
dc
): Arizona (16), California (106), Massachusetts (7).
Sources: Arizona Goes Solar (1/2/24); California Distributed Generation (11/30/23); Massachusetts Lists of Qualified Generation Units (12/6/23).
• In 2023 YTD, residential PV+storage systems
in Arizona, California, and Massachusetts
had a median system price of $3,235/kWh,
or $6,015/kW
ac
($5,719/kW
dc
)—an increase
of about 10% compared with full 2022
median values:
– Most of these systems offer 2–3 hours of
storage.
– Units represent total system price divided by
the capacity of the battery (kWh) or the
capacity of the PV system (kW).
$0
$1,000
$2,000
$3,000
$4,000
$5,000
$6,000
$7,000
$8,000
$9,000
2018 2019 2020 2021 2022 2023
n= 3,380 n= 4,248 n= 7,837 n= 13,299 n= 20,440 n= 13,873
System Price
PV+Storage ($/kWdc)
PV+Storage ($/kWac)
PV+Storage ($/kWh)
Bars represent the median, with error bars
representing the 80
th
and 20
th
percentiles.
NREL | 35NREL | 35
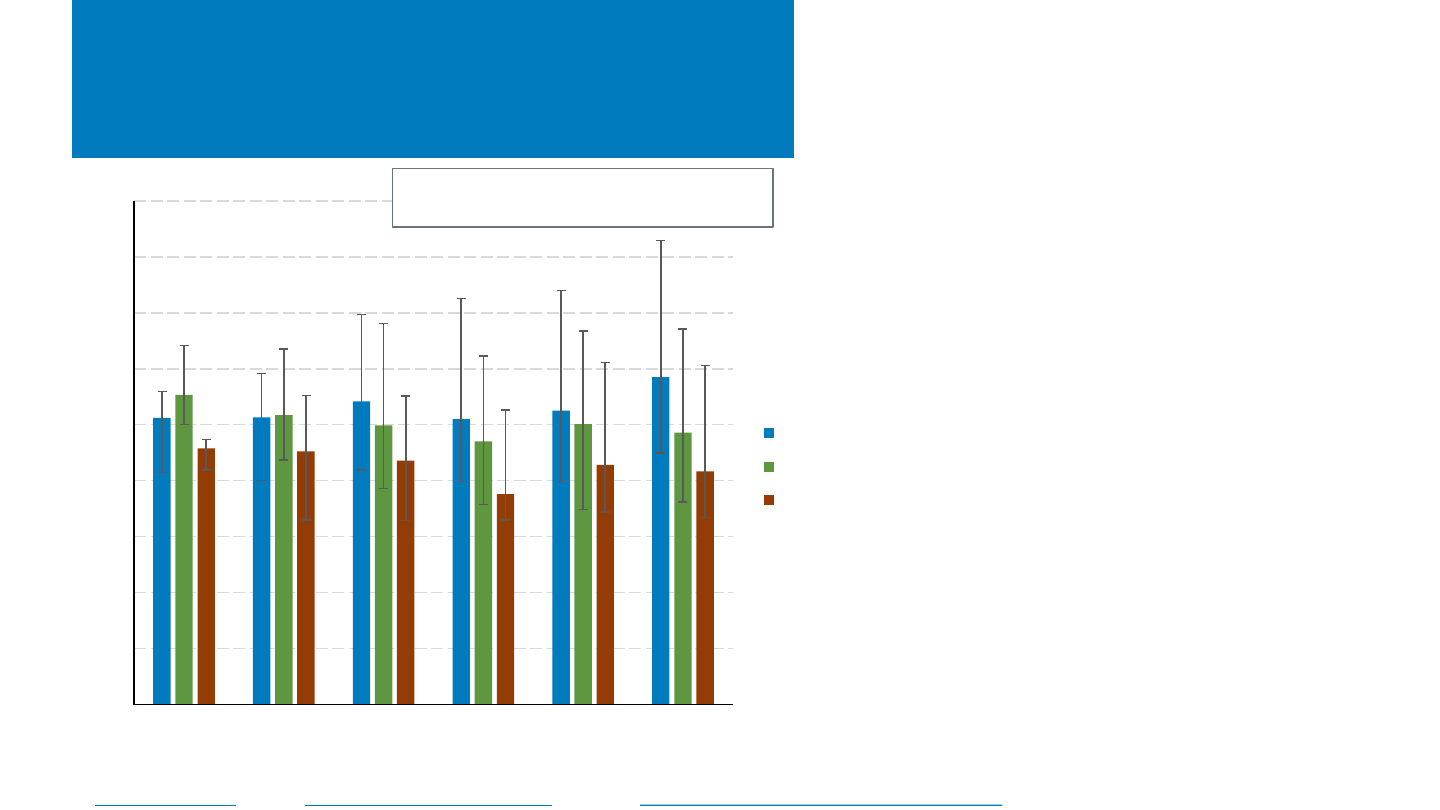
Residential U.S. PV+Storage Pricing
• During 2023 YTD, residential PV+storage
system prices in Arizona, California, and
Massachusetts varied between states and
internally.
– Prices may vary due to differences in storage
power and capacity, permitting and
interconnection differences, local competitive
factors, and installer experience.
• Compared with full median 2022 values,
prices (in dollars per kW
dc
of PV capacity)
increased in 2023 YTD in California (11%)
while decreasing in Massachusetts (3%) and
Arizona (3%).
2023 YTD residential PV+storage sample, after data cleaning (MW
dc
): Arizona (16), California (106), Massachusetts (7).
Sources: Arizona Goes Solar (1/2/24); California Distributed Generation (11/30/23); Massachusetts Lists of Qualified Generation Units (12/6/23).
$0
$1,000
$2,000
$3,000
$4,000
$5,000
$6,000
$7,000
$8,000
$9,000
2018 2019 2020 2021 2022 2023
System Price ($/kW
dc
)
CA
AZ
MA
Bars represent the median, with error bars
representing the 80
th
and 20
th
percentiles.
NREL | 36NREL | 36
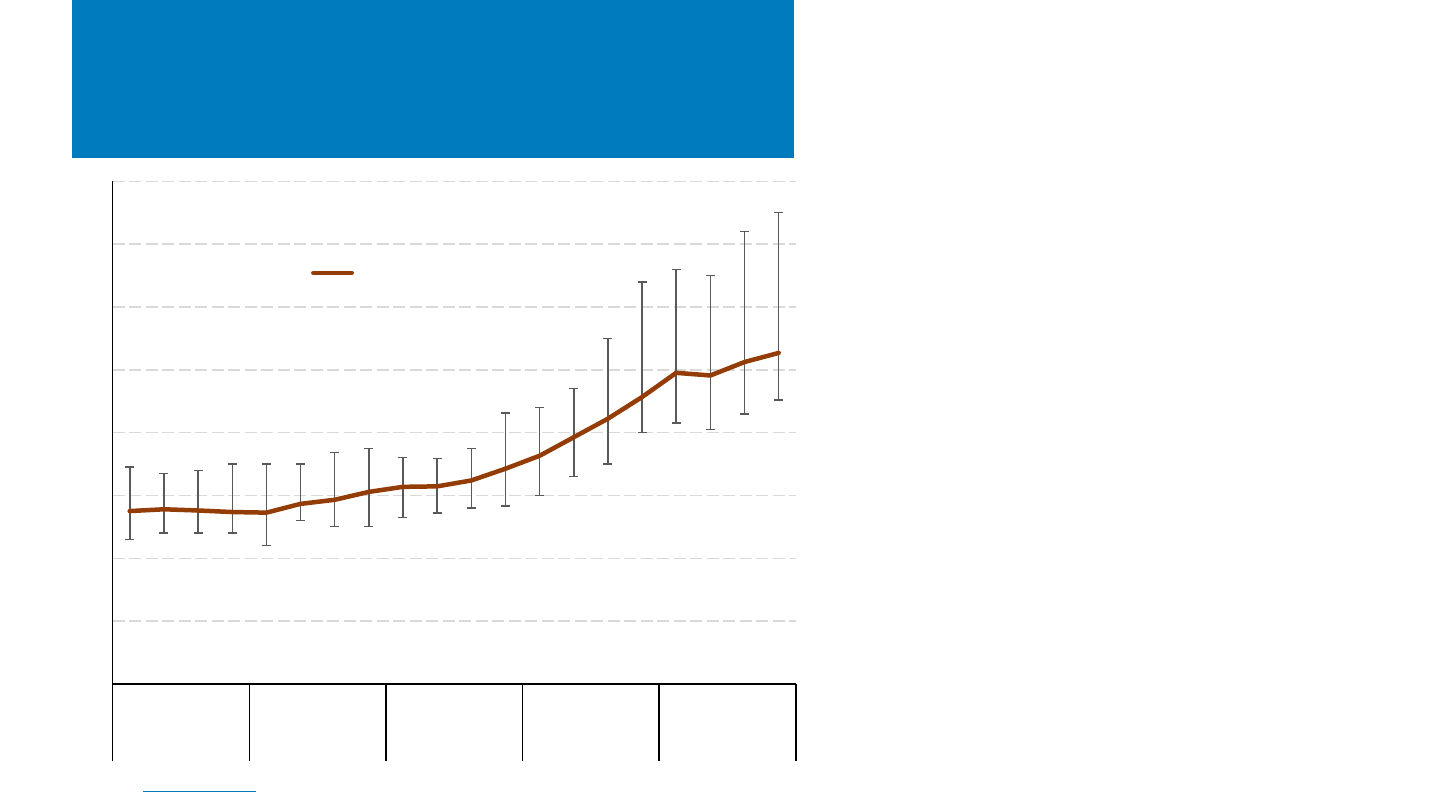
U.S. Solar PPA Pricing
(LevelTen)
Source: LevelTen, PPA Price Index.
• LevelTen reports that following a modest dip
in prices in Q2, U.S. utility-scale PV PPA prices
increased for the second straight quarter,
increasing 3% q/q and 15% y/y in Q4 2023.
• Market-level trends diverged with some
experiencing price declines and others seeing
price increases:
– ERCOT pricing was relatively low due in
part to low interconnection costs and low
REC pricing. Conversely, PJM pricing was
relatively high due to higher
interconnection and REC pricing.
• PPA prices were pushed down by a more
efficient solar supply chain and lower module
prices; however, high interest rates negated
any benefits of lower equipment pricing.
$0
$10
$20
$30
$40
$50
$60
$70
$80
Q1 Q2 Q3 Q4 Q1 Q2 Q3 Q4 Q1 Q2 Q3 Q4 Q1 Q2 Q3 Q4 Q1 Q2 Q3 Q4
2019 2020 2021 2022 2023
25th Percentile PPA Offer Price ($/MWh)
National average across
markets
NREL | 37NREL | 37
SREC Pricing
Source: SRECTrade, https://www.srectrade.com/, accessed 01/31/31.
• Solar renewable energy certificate (SREC) pricing has been relatively flat in 2023, particularly for legacy
programs such as New Jersey and Massachusetts, which are not accepting new projects.
• However, potential programmatic or supply/demand changes can still impact markets. A bill currently
being debated in Pennsylvania’s state House would increase its RPS from 8% to 30% and the solar
carveout from 0.5% to 4.0% by 2030.
$0
$10
$20
$30
$40
$50
$60
$70
$80
$90
Jan-19
Apr-19
Jul-19
Oct-19
Jan-20
Apr-20
Jul-20
Oct-20
Jan-21
Apr-21
Jul-21
Oct-21
Jan-22
Apr-22
Jul-22
Oct-22
Jan-23
Apr-23
Jul-23
Oct-23
Jan-24
Price Per SREC (Simple Average)
Lower-Priced Markets
PA MD OH In-state
$0
$100
$200
$300
$400
$500
Jan-19
Apr-19
Jul-19
Oct-19
Jan-20
Apr-20
Jul-20
Oct-20
Jan-21
Apr-21
Jul-21
Oct-21
Jan-22
Apr-22
Jul-22
Oct-22
Jan-23
Apr-23
Jul-23
Oct-23
Jan-24
Price Per SREC (Simple Average)
Higher-Priced Markets
NJ DC MA (SREC II)

NREL | 38
Global Solar Deployment1
U.S. PV Deployment
2
PV System Pricing
3
Global Manufacturing
4
Component Pricing
5
U.S. PV Imports
6
7 PV Waste and Toxicity
Agenda
• BNEF reports that at the end of 2023, global PV
manufacturing capacity was between 650 and 750
GW―a growth of 2–3x in the past 5 years, 90% of which
occurred in China. In 2023, global PV production was
between 400 and 500 GW.
• Despite global price drops across the PV supply chain, PV
manufacturers have generally remained profitable,
thanks to increases in sales volumes (particularly for N-
type cells).
NREL | 39NREL | 39
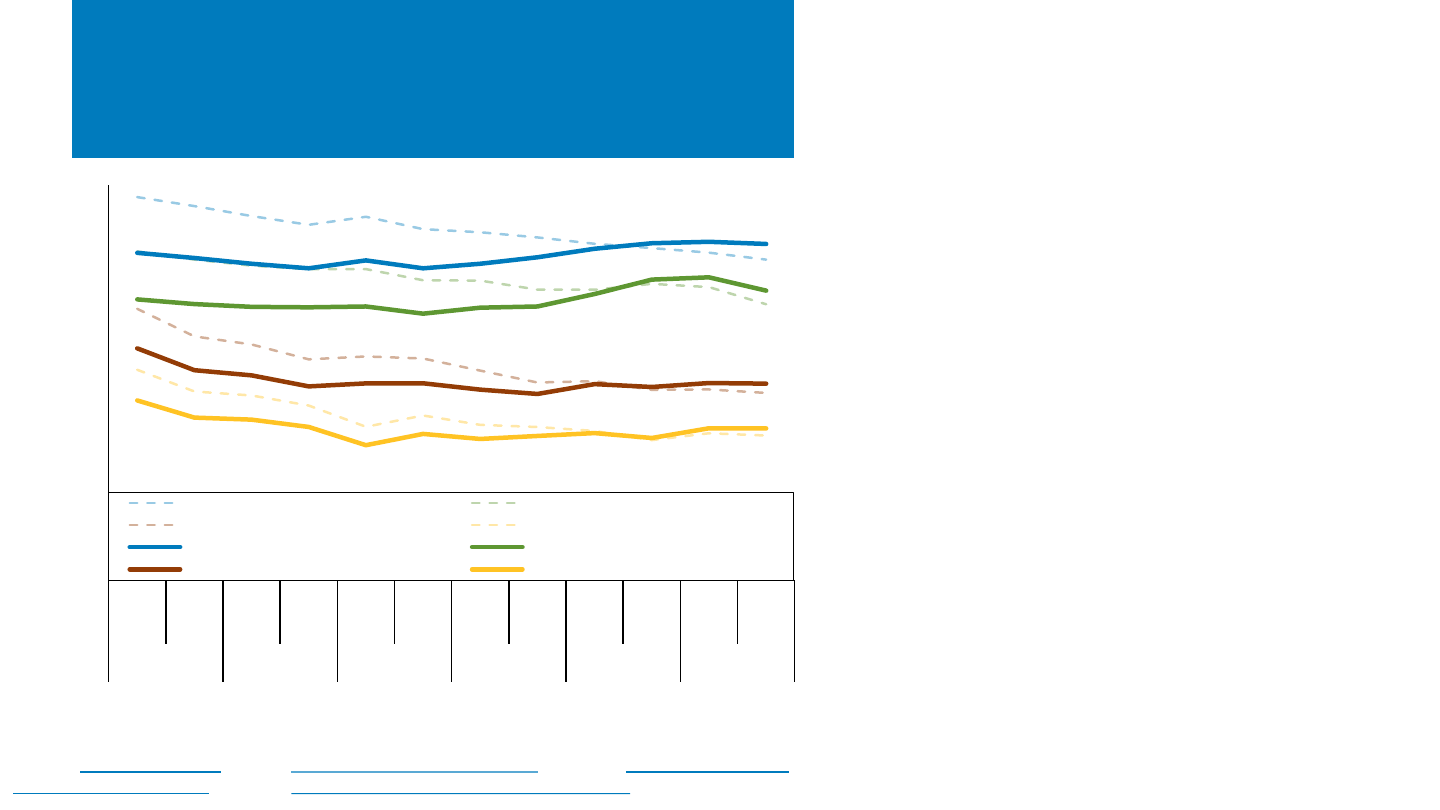
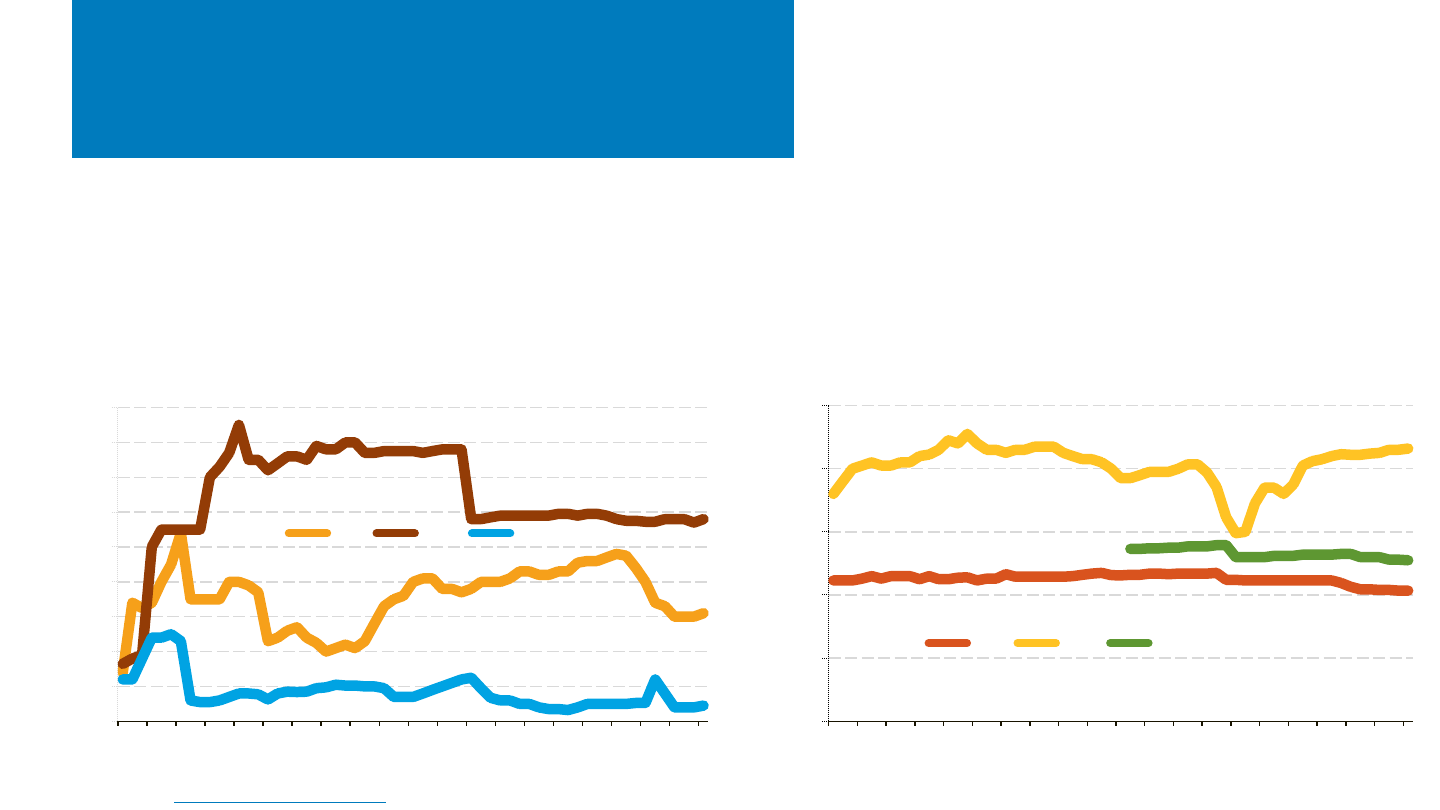
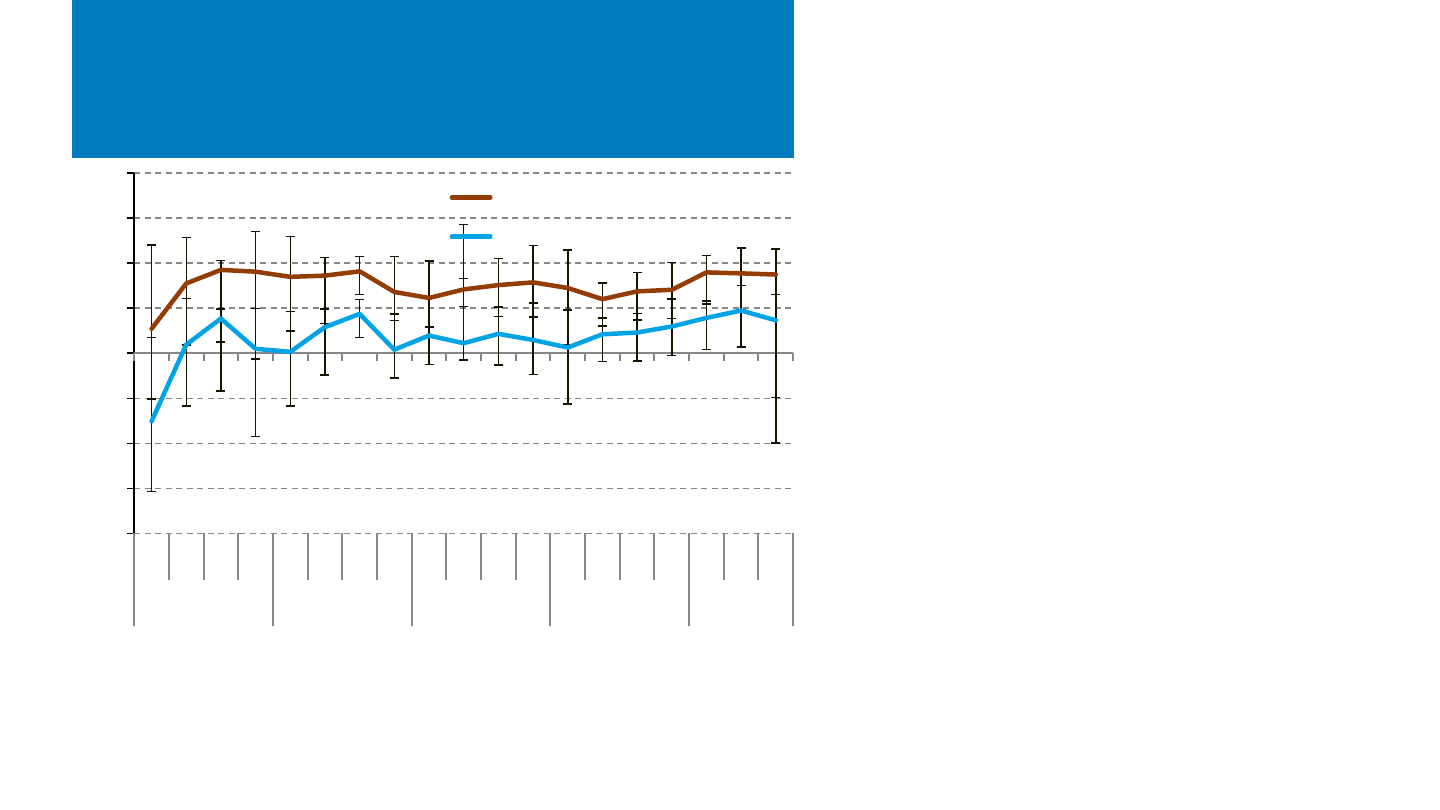
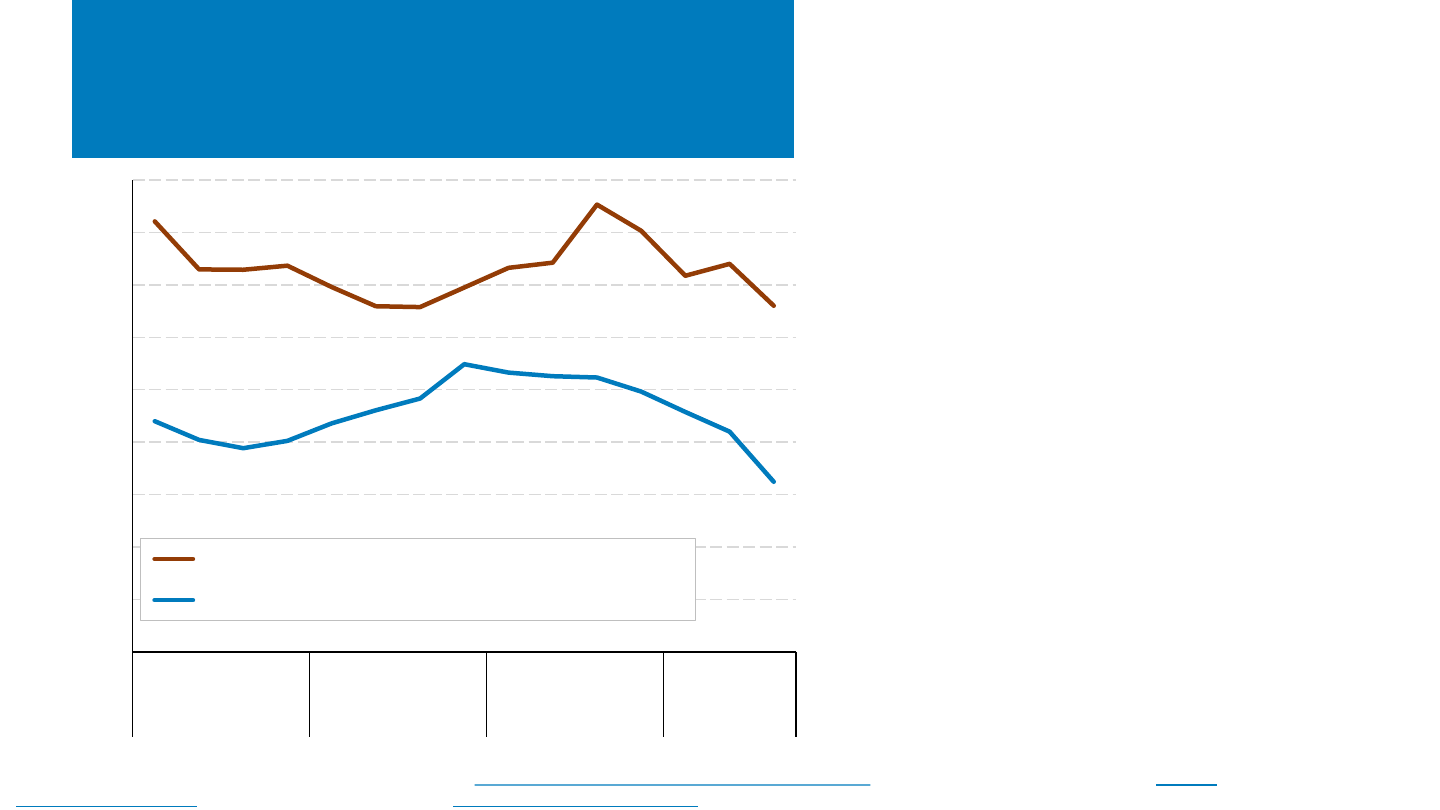
PV Manufacturers’ Margins
• Despite global price drops across the PV supply
chain, PV manufacturers have generally
remained profitable, thanks to increases in
sales volumes (particularly for N-type cells):
– Lower pricing upstream also means lower
costs downstream.
– At the end of Q3 2023, over half of
Canadian Solar capacity and Jinko Solar
production (57%) used N-type cell
architecture.
– Jinko reported mass-produced TopCon cell
efficiencies reaching 25.6%.
Lines represent the median, with error bars representing 80
th
and 20
th
percentiles for the following companies in Q3 2023: Canadian Solar, First Solar, JA Solar, Jinko Solar,
LONGi, Maxeon, Motech Industries, REC Silicon, Renesola, Risen, Shanghai Aiko, Shanghai Aerospace, Tongwei, Trina Solar, and United Renewable Energy.
Note: Gross margin = revenue minus cost of goods sold (i.e., the money a company retains after incurring the direct costs associated with producing the goods or services it
sells); operating margin = gross margin minus overhead and operating expenses (i.e., the money a company retains before taxes and financing expenses).
Sources: Company figures based on public filings and finance.yahoo.com.
-40%
-30%
-20%
-10%
0%
10%
20%
30%
40%
Q1 Q2 Q3 Q4 Q1 Q2 Q3 Q4 Q1 Q2 Q3 Q4 Q1 Q2 Q3 Q4 Q1 Q2 Q3
2019 2020 2021 2022 2023
Margins
gross margin
operating median
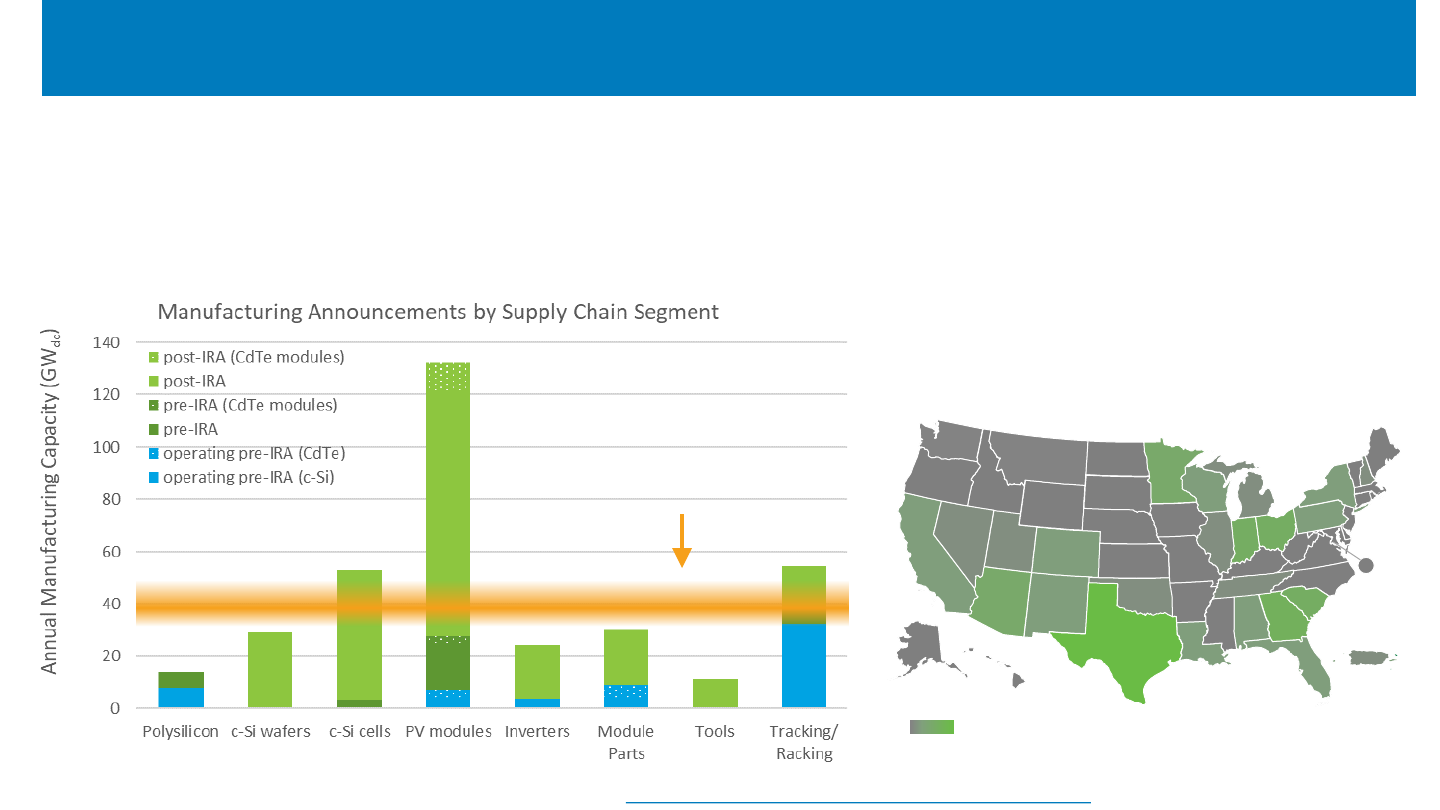
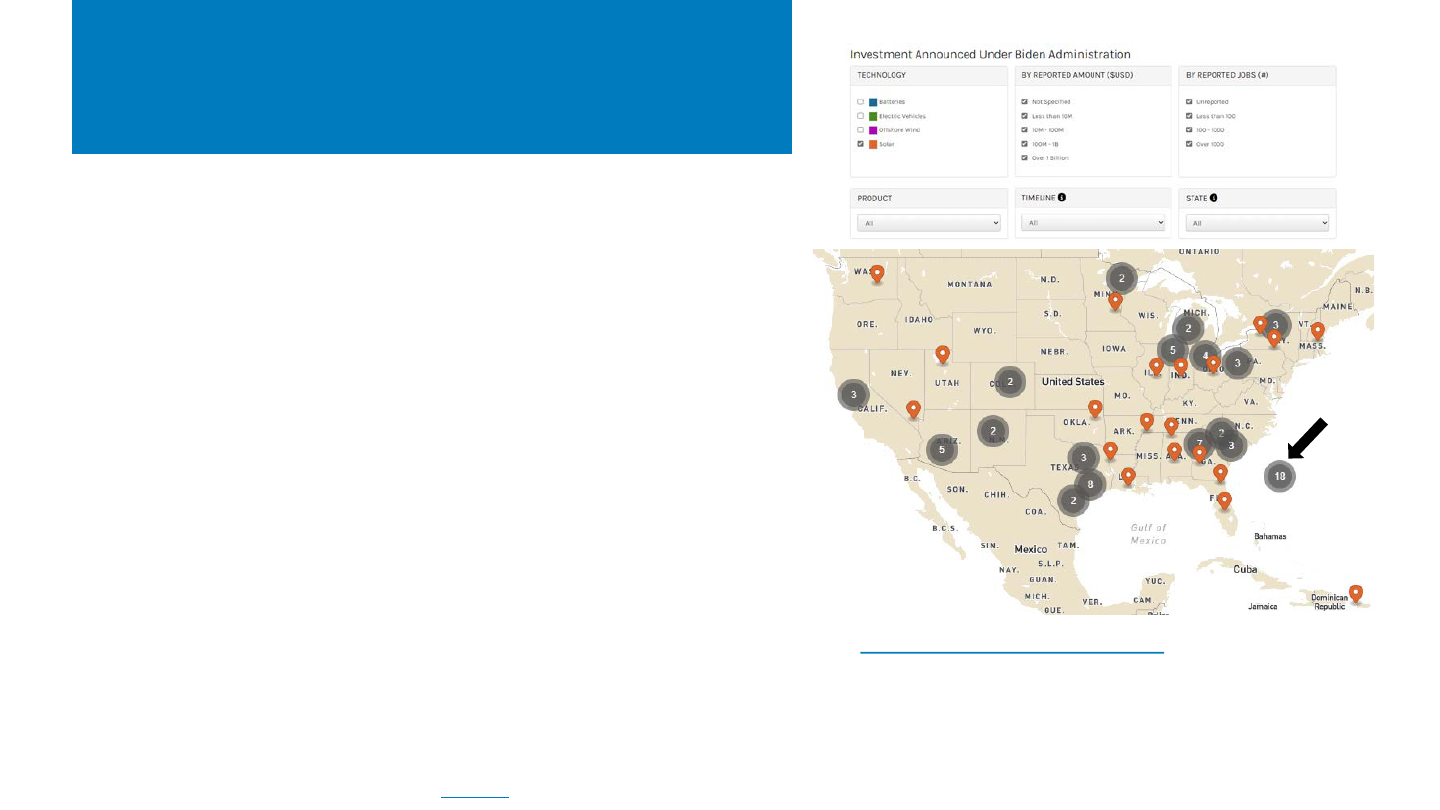
• Since the passage of the IRA, >250 GW of manufacturing capacity has been announced across the solar supply chain, representing
more than 27,000 potential jobs and more than $14 billion in announced investments across 80 new facilities or expansions.*
Sources: Internal DOE tracking of public announcements and BNEF Global PV Market Outlooks and Wood Mackenzie and SEIA Solar Market Insights Q2 2022 and Q2 2023.
*Not all announcements include facility locations, job, or investment numbers. See Building America's Clean Energy Future | Department of Energy.
IRA Impacts on U.S. Solar PV Manufacturing Capacity
These announcements post-IRA represent
potential investment in 23 states and Puerto Rico.
# of facilities* announced post-IRA
0 13
2
1
2
1
2
1
3
1
13
3
2
2
2
1
4
1
4
2
6
5
2
2
1
DC
1
Projected 2025
U.S. PV Deployment
– 105 GW of solar module capacity (including 11 GW of CdTe)
– 49 GW of c-Si cell capacity
– 29 GW of c-Si wafer capacity
– 69 GW of BOS (including glass, encapsulant, backsheet,
junction boxes, inverters, trackers, and tracker components)*
– Another 35 GW of solar manufacturing capacity had been
announced since the start of the Biden administration prior to
the passage of the IRA.
Recent Manufacturing News
• Notable announcements over the last several months include:
– Array Technologies announced solar tracker plans for Albuquerque,
New Mexico
– Canadian Solar announced plans for 5 GW of cells in Jeffersonville,
Indiana
– Heliene announced plans to expand in Mountain Iron, Minnesota
– NSG Glass North America announced plans to make glass for First
Solar in Rossford, Ohio
– Priefert Steel (Nevados) announced solar tracker plans for Mount
Pleasant, Texas
– SMA Solar announced plans to make 3.5 GW of inverters in the U.S.
– Soltec announced plans to make trackers within the U.S.
– Waaree Energies announced a location for its module
manufacturing in Brookshire, Texas, and announced plans to make
c-Si cells within the U.S. by 2025.
• In less positive manufacturing news, Enphase Energy also announced that it
plans to close its recently-opened Wisconsin facility in 2024.
https://www.energy.gov/invest, updated 1/11/24
Facilities
announced
without
locations
Source: Internal DOE tracking of announcements, PV Tech.
NREL | 42NREL | 42
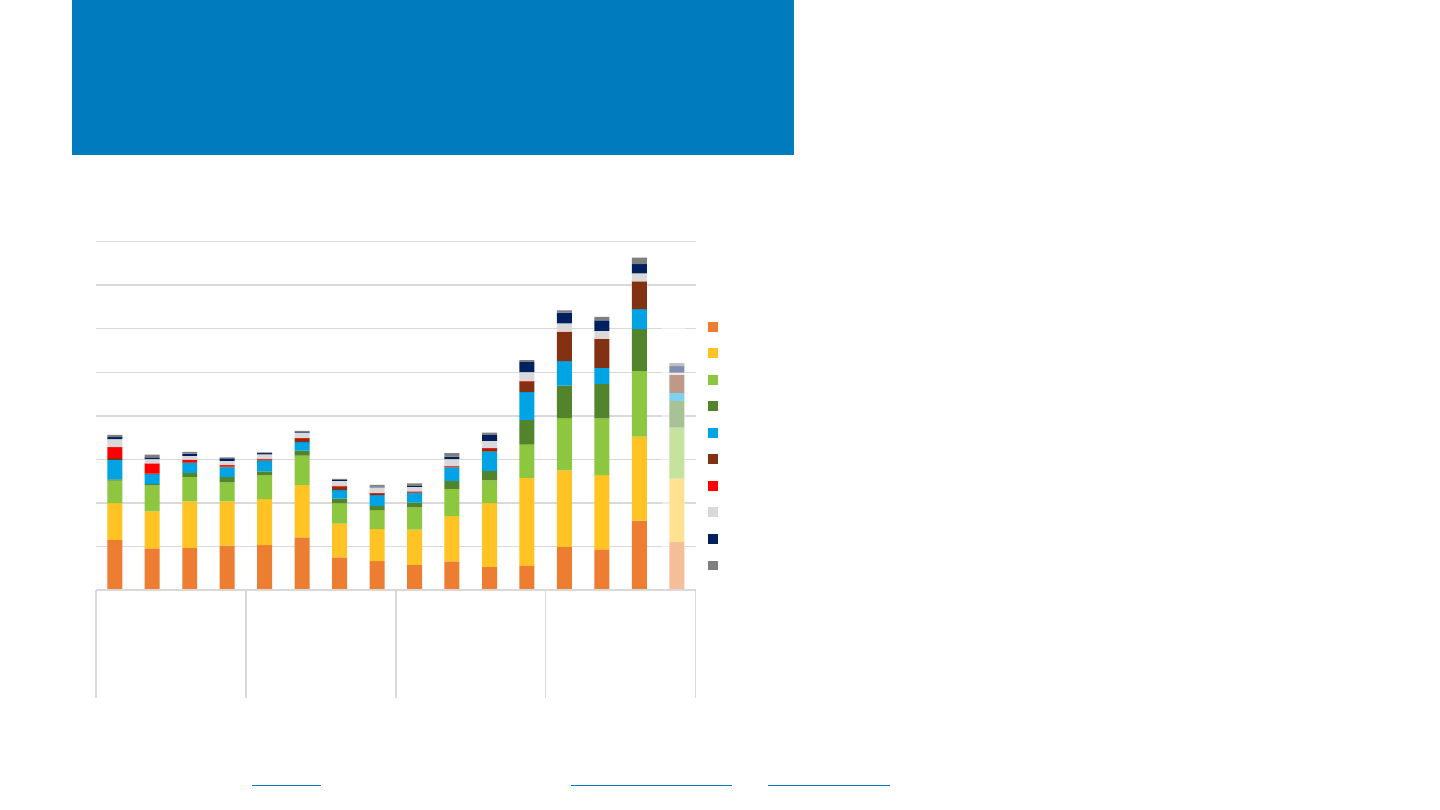
Growth in Global PV
Manufacturing Capacity
• PVTech and Goldman Sachs report that at the end of
2023, approximate global PV manufacturing
capacity was between 650 and 750 GW. In 2023,
global PV production was between 400 and 500 GW.
• In the past 5 years, PV manufacturing capacity has
grown 2–3x, with more than 90% of the growth
occurring in China:
– 20% (wafer) to 40% (polysilicon) of new
manufacturing capacity came online in 2023.
• The ratio of production as a percent of
manufacturing capacity fell slightly in 2023;
however, some of that might be explained by the
large amount of manufacturing capacity ramping up.
• Historically, the previous years’ manufacturing
capacity has been a good indicator of the next year’s
production, across manufacturing steps. However,r
analysts project that it may take a few years for the
industry to produce at the 2023 level of global
manufacturing capacity.
0
200
400
600
800
1,000
1,200
1,400
1,600
1,800
2,000
0
100
200
300
400
500
600
700
800
2019
2021
2023
2020
2022
2019
2021
2023
2020
2022
2019
2021
2023
2020
2022
2019
2021
2023
2020
2022
China Outside
China
China Outside
China
China Outside
China
China Outside
China
Modules Cells Wafers Polysilicon
MT (000s)
Gigawatts
Excess Capacity
Production
Note: Data represent median values from multiple sources.
Sources: Goldman Sachs (12/17/23), PVTech Research, “PV Manufacturing & Technology Quarterly Report - Release 31 - November 2023.”
NREL | 43NREL | 43
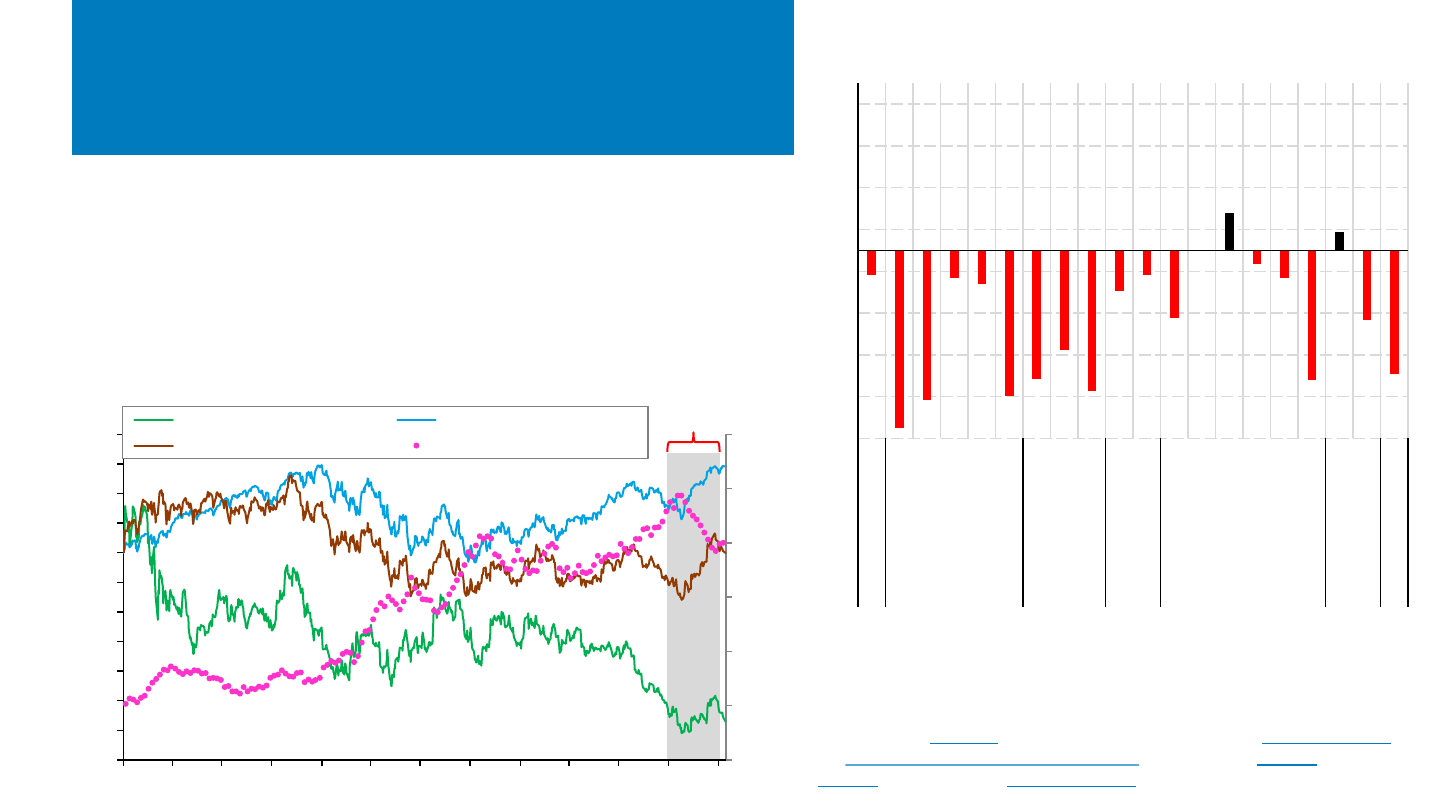
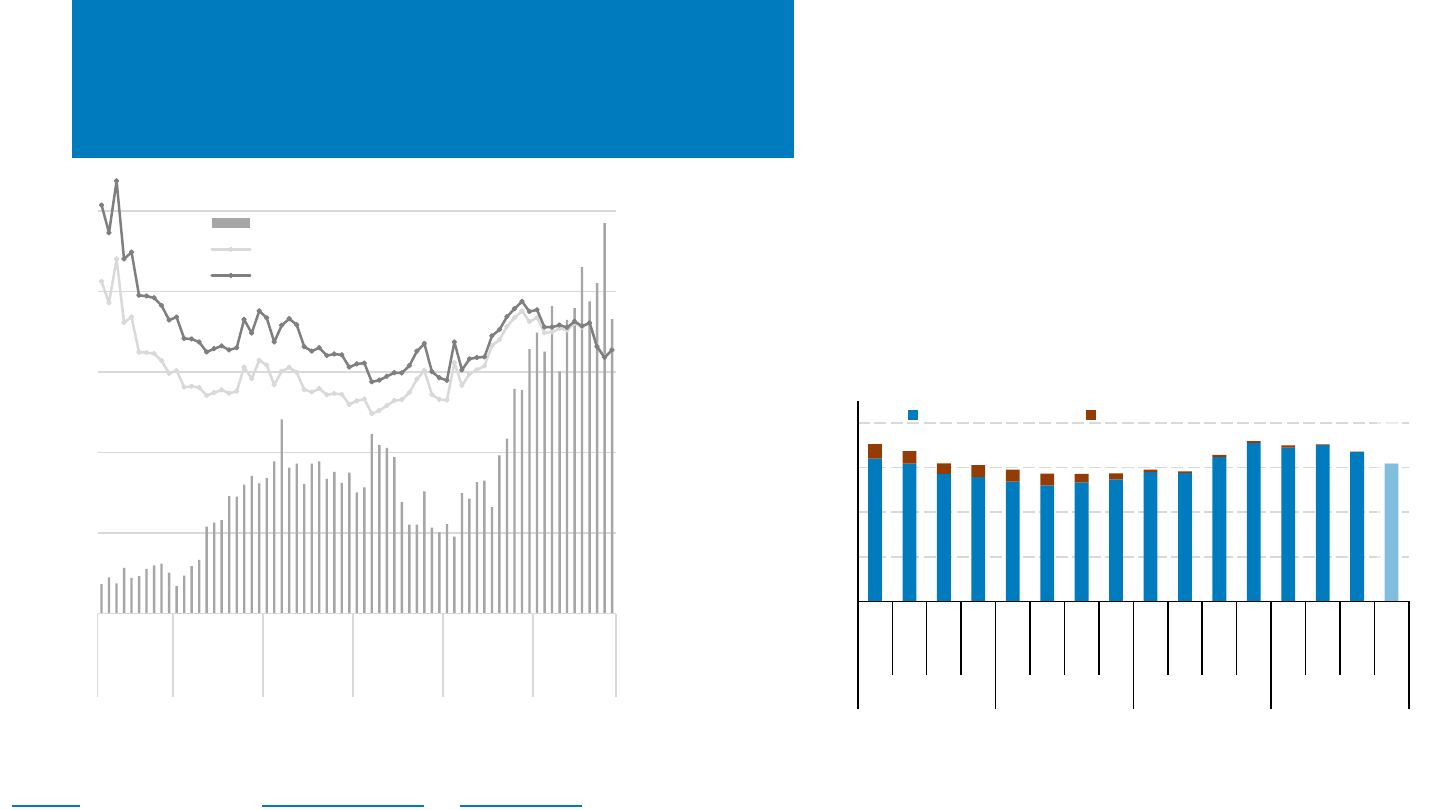
Stock Market Activity
Note: The TAN index is weighted toward particular countries and sectors. As of
1/16/24, 55% of its funds were in U.S. companies and 17% were in Chinese
companies. Its top 10 holdings, representing 62% of its value, were First Solar,
Enphase, SolarEdge, Sunrun, GCL, Hannon Armstrong, Xinyi, Shoals, Array
Technologies, and Encavis.
Sources: CNBC (11/15/23); Federal Reserve Bank of St. Louis (accessed 1/16/24);
IEA, Projected Costs of Generating Electricity, 2020; Invesco (1/16/24); Nasdaq
(1/13/24); Yahoo Finance (accessed 1/16/24).
Q4 2023
-90%
-70%
-50%
-30%
-10%
10%
30%
50%
70%
Atlantica Yield
Sunworks
SunPower
Sunnova
Sunrun
Azure Power
Ginlong
Enphase Energy
SolarEdge
Soltec Power
Array Tech.
Solargiga Energy
Tainergy Tech
First Solar
Jinko Solar
Canadian Solar
Shunfeng
Wacker Chemie
Daqo
Meyer Burger
Yieldcos Installers Inverters Trackers PV Manufacturers Poly Equip.
Individual Stock Performance (Q1–Q4 2023)
The Invesco Solar ETF rose 8% in Q4 2023 (-26% for the year) vs. an 11%–
15% increase across the broader market (+16% to +25% for the year). Rising
interest rates weighed on solar stocks for much of the year, reducing
profitability. A 5-percentage point increase in interest rates can increase
solar energy costs by one-third. Additional headwinds included California’s
NEM 3.0 policy, high labor costs, and large installer inventories of PV
equipment. Potential tailwinds going forward include falling interest rates,
strong demand for solar energy worldwide, and rapidly rising utility rates.
0
1
2
3
4
5
6
-70%
-60%
-50%
-40%
-30%
-20%
-10%
0%
10%
20%
30%
40%
Jan-21Apr-21 Jul-21 Oct-21Jan-22Apr-22 Jul-22 Oct-22Jan-23Apr-23 Jul-23 Oct-23Jan-24
10-Year Treasury Yield (%)
% Change (Index: 01/04/21
Adjusted Close)
Invesco Solar ETF (TAN) S&P 500 Index
iShares Russell 2000 ETF 10-Year Treasury Yield

NREL | 44
Global Solar Deployment1
U.S. PV Deployment
2
PV System Pricing
3
Global Manufacturing
4
Component Pricing
5
U.S. PV Imports
6
7 PV Waste and Toxicity
Agenda
• Global polysilicon spot prices fell 18% from mid-October
($10.53/kg) to mid-January ($8.70/kg), approaching their
lowest levels of the past several years.
• Global module prices reached yet another record low,
falling 22% between mid-October and mid-January to
$0.11/W
dc
.
• In Q3 2023, the average U.S. module price ($0.33/W
dc
)
was down 11% q/q and down 23% y/y but at a 100%
premium over the global spot price for monofacial
monocrystalline silicon modules.
NREL | 45NREL | 45
$0
$5
$10
$15
$20
$25
$30
$35
$40
$45
$0.00
$0.05
$0.10
$0.15
$0.20
$0.25
$0.30
Jan-20
Apr-20
Jul-20
Oct-20
Jan-21
Apr-21
Jul-21
Oct-21
Jan-22
Apr-22
Jul-22
Oct-22
Jan-23
Apr-23
Jul-23
Oct-23
Jan-24
Average Polysilicon Spot Price ($/kg)
Average Wafer, Cell, and Module Spot Price ($/
W
dc
)
Cells, mono ($/Wdc) Monofacial modules, mono ($/Wdc)
Bifacial modules, 210 mm, mono ($/Wdc) Wafers, mono M10 ($/Wdc)
Polysilicon ($/kg)
PV Value Chain Global Spot Pricing
Sources: BloombergNEF, Solar Spot Price Index (1/17/24); PV Magazine (9/25/23, 11/23/23, 11/28/23, 12/19/23); PV Tech (10/20/23).
Global polysilicon spot prices fell 18% from
mid-October ($10.53/kg) to mid-January
($8.70/kg), approaching their lowest levels of
the past several years:
• Additional polysilicon capacity scheduled to
come online in 2024 far exceeds the increase in
expected polysilicon demand, further increasing
global polysilicon overcapacity.
During the same period, global prices
decreased for wafers (27%) and cells (33%).
Global module prices reached yet another
record low, falling 22% between mid-October
and mid-January to $0.11/W
dc
:
• Decreasing supply chain costs, increasing module
manufacturing capacity, and large module
inventories in Europe as well as intense
competition among manufacturers depressed
demand and prices.
Monofacial modules
Cells
Wafers
Bifacial modules
Polysilicon (right axis)
NREL | 46NREL | 46
Module Prices:
Global vs. United States
Sources: BloombergNEF, Solar Spot Price Index (1/17/24); EIA, Monthly Solar Photovoltaic Module Shipments Report (1/19/24); Wood Mackenzie and SEIA, US Solar
Market Insight: Q3 2023 (9/23); Wood Mackenzie and SEIA, US Solar Market Insight: Q4 2023 (12/23).
In Q3 2023, the average U.S. module price
($0.33/W
dc
) was down 11% q/q and down 23%
y/y but at a 100% premium over the global spot
price for monofacial monocrystalline silicon
modules.
The directional trend in U.S. module prices
realigned with the trend in global module prices,
although the difference between the two prices
remained about the same ($0.16–$0.17/W
dc
).
• The U.S. premium has been maintained by
tariffs on Chinese modules as well as friction
on Southeast Asian module imports due to
the antidumping and countervailing duties
(AD/CVD) investigation as well as module
detainment under the Uyghur Forced Labor
Prevention Act (UFLPA).
• Decreasing UFLPA detainment periods have
contributed to recent declines in U.S. module
prices.
$0.00
$0.05
$0.10
$0.15
$0.20
$0.25
$0.30
$0.35
$0.40
$0.45
Q1 Q2 Q3 Q4 Q1 Q2 Q3 Q4 Q1 Q2 Q3 Q4 Q1 Q2 Q3
2020 2021 2022 2023
PV Module Price ($/W
dc
)
U.S. average module value
Global spot price, monofacial monocrystalline modules
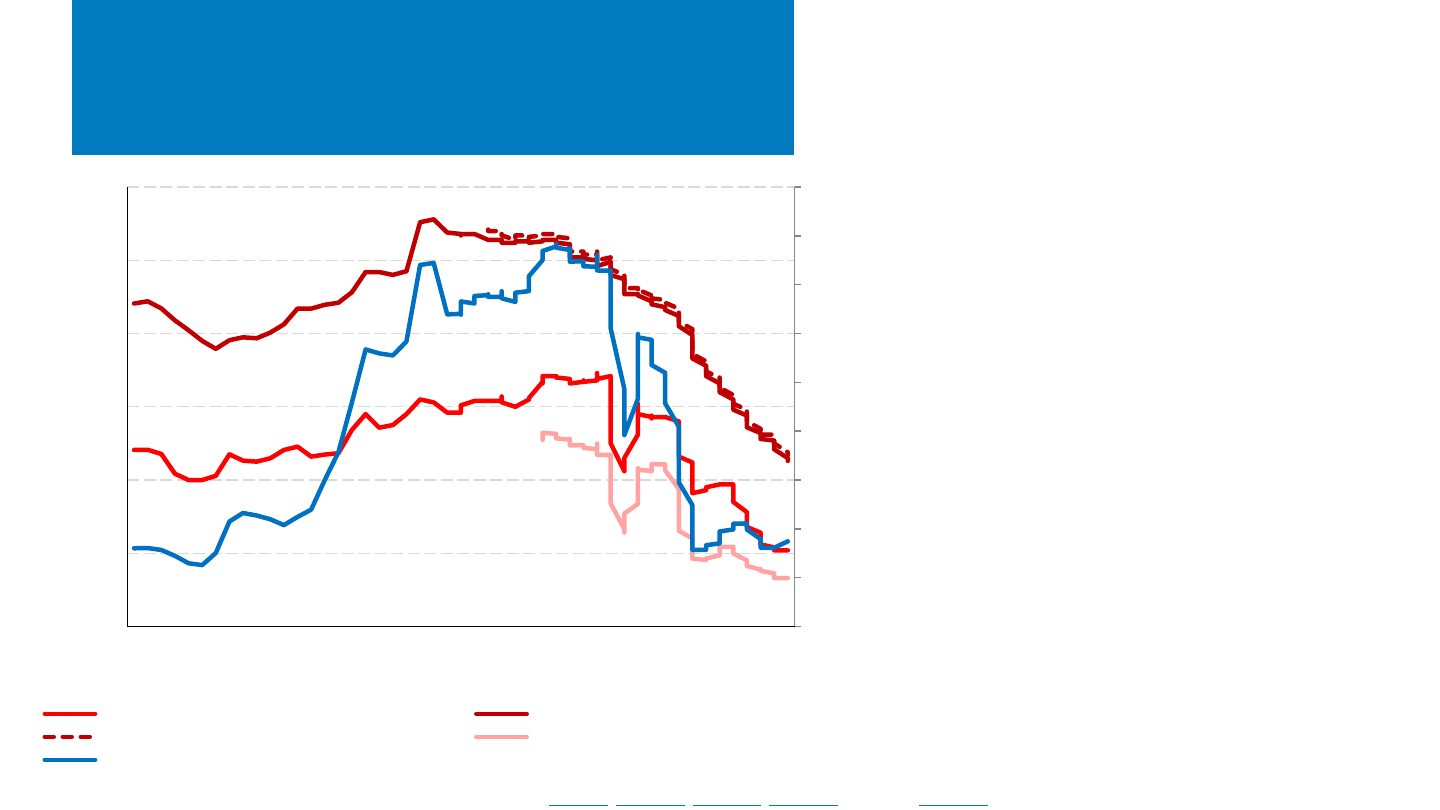
NREL | 47NREL | 47
$0.00
$0.10
$0.20
$0.30
$0.40
Q1
Q2
Q3
Q4
Q1
Q2
Q3
Q4
Q1
Q2
Q3
Q4
Q1
Q2
Q3
Oct-Nov
2020 2021 2022 2023
Nominal U.S. Module Price
Imported value/Watt "Effective" 201 Tariff Rate
Calculated U.S. Module Pricing
• As module imports rose at the end of 2022, prices rose
with them, but in Q3 2023, prices began to fall―although
they are still well within historical norms (in both real and
nominal price).
– Based on the reported value and capacity of imported PV
modules, the average price of a PV module in the United
States fell less than a cent q/q in Q3 2023 to $0.34/W and
is on track to fall back to $0.31/W in Q4, while the
effective Section 201 tariff has fallen below $0.01/W.
– Price fluctuations continue to vary by country, with
module prices from South Korea experiencing the most
significant changes and those from Malaysia remaining
the steadiest.
Note: Manual corrections were made to three values due to suspected data entry errors for HTS code 8541430010: Cambodia (February 2022), Malaysia (June 2020), and Vietnam (July 2019);
nominal price = the price paid at the time of transaction (i.e., not adjusted for inflation); real price = the price adjusted for inflation.
Sources: Imports by HTS code: 8541460015(2018-2021)/8541430010(2022-); Customs Value and Second Quantity (watts) from the U.S. International Trade Commission
DataWeb; the U.S. Census Bureau USA Trade Online tool and corrections page. Manual corrections were made to imports from India due to suspected data entry errors.
$0.00
$0.10
$0.20
$0.30
$0.40
$0.50
0.0
1.0
2.0
3.0
4.0
5.0
MAR
JUN
SEP
DEC
MAR
JUN
SEP
DEC
MAR
JUN
SEP
DEC
MAR
JUN
SEP
DEC
MAR
JUN
SEP
DEC
MAR
JUN
SEP
2018 2019 2020 2021 2022 2023
c-
Si Module Price (Nov 2023 US$/
W
dc
)
Imported c-Si Modules (GW
dc
)
Total c-Si import volume (GW)
Total c-Si imports nominal price ($/W)
Total c-Si imports real price ($/W)

NREL | 48NREL | 48
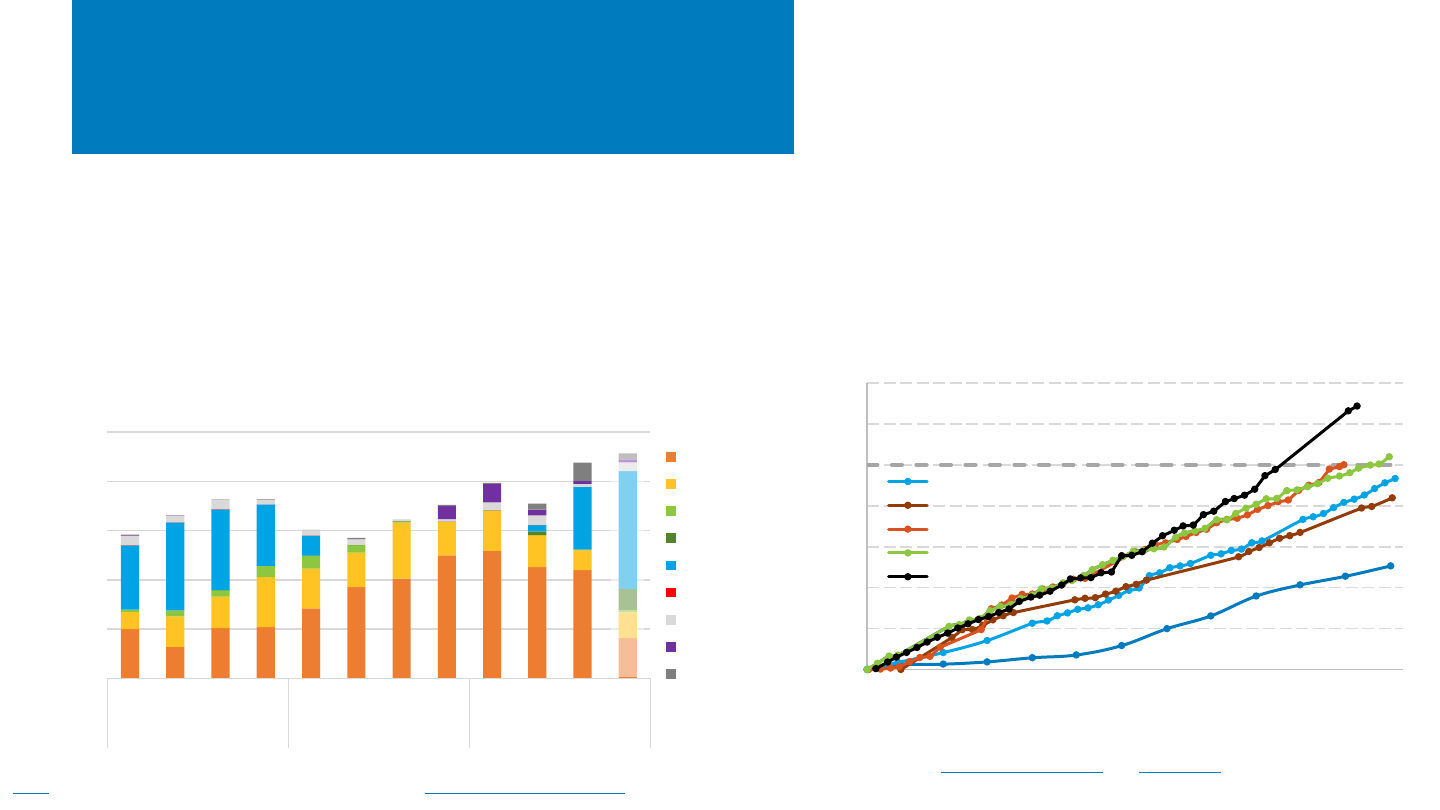
Average Lithium-Ion Battery
Pack Price, 2010–2023
• After a small increase in 2022, battery pack prices
continued their historical downward trend in
2023, falling 90% from 2010 to 2023, and 14%
between 2022 and 2023.
– From 2016 to 2023, average battery pack
prices within the stationary storage sector
decreased 64% and 17% from 2022 to 2023.
– BNEF reported the lowest price to date:
$82/kWh in China.
• BloombergNEF cited falling raw material and
component prices due to large increases in
manufacturing capacity throughout the supply
chain. Additionally, despite a growth in demand,
it may have been lower than expected.
• BloombergNEF reported that large stationary
storage providers are entering multiyear cell
supply agreements while allowing flexibility to
take advantage of low Chinese prices.
Source: BloombergNEF, “2023 Lithium-Ion Battery Price Survey.”
1,391
1,079
848
780
692
448
345
258
2…
183
160
150
161
139
415
369
272
256
207
173
180
150
2010 2011 2012 2013 2014 2015 2016 2017 2018 2019 2020 2021 2022 2023
Battery pack price (real 2023 $/kWh)
All Sectors
Stationary
Storage

NREL | 49
Global Solar Deployment1
U.S. PV Deployment
2
PV System Pricing
3
Global Manufacturing
4
Component Pricing
5
U.S. PV Imports
6
7 PV Waste and Toxicity
Agenda
• The United States imported 40.6 GW
dc
of PV modules in Q1–Q3
2023, setting a new single-quarter record of over 15 GW
dc
of
modules imported.
– Most panels imported were exempt from Section 201 duties
and were therefore likely bifacial. A significant number of thin-
film modules were also imported.
• 2.4 GW
dc
of cells were imported in Q1–Q3 2023, up 31% y/y.
– The U.S. is not on pace to reach the 5-GW
dc
quota exemption
limit for Section 201 tariffs, although it has exceeded 3 GW
dc
of
imports in a single year for the first time.
NREL | 50NREL | 50
0.0
2.0
4.0
6.0
8.0
10.0
12.0
14.0
16.0
Q1
Q2
Q3
Q4
Q1
Q2
Q3
Q4
Q1
Q2
Q3
Q4
Q1
Q2
Q3
Oct-Nov
2020 2021 2022 2023
Modules Imported (GW
dc
)
U.S. Module (c-Si + CdTe) Imports by Region
Malaysia
Vietnam
Thailand
Cambodia
South Korea
India
China
Rest of Asia
N. America
ROW
Module Imports and
Calculated Prices by Region
Sources: Imports by HTS code: 8541460015(2018-2021)/8541430010(2022-) and 8541460035(2018-2021)/8541430080(2022-), Second Quantity (watts) from the U.S.
International Trade Commission DataWeb as well as the U.S. Census Bureau USA Trade Online tool and corrections page as of 1/10/24. Manual corrections were made to
imports from India due to suspected data entry errors.
• In Q3 2023, U.S. module imports achieved new record-
high levels at 15.3 GW
dc
(+111%, or 8 GW
dc
y/y), totaling
40.6 GW
dc
in Q1–Q3 2023.
– Import levels decreased after the withhold release order
(WRO) on PV cells and modules was announced in late
Q2 2021. Additionally, many manufacturers in Southeast
Asia had reduced production levels earlier in the year
with the announcement of a U.S. anti-circumvention
investigation and when the 2-year waiver was
announced in June; however, the supply chain appears
to have recovered from those disturbances.
– The Q3 q/q increase (+22%, +2.72 GW
dc
) was mainly the
result of increased imports from Malaysia (+71% q/q,
+1.3 GW
dc
) as well as more modest increases from the
other southeast Asian countries of import.
• Though Q4 is not yet complete, it looks to be another
strong quarter for module imports.
– This has been mainly the result of imports from Vietnam,
Malaysia, and Thailand all exceeding 2 GW
dc
in just 2
months, with Vietnam at nearly 3 GW (2.3 GW
dc
c-Si and
0.7 GW
dc
).
NREL | 51NREL | 51
0.0
0.2
0.4
0.6
0.8
1.0
Q1 Q2 Q3 Q4 Q1 Q2 Q3 Q4 Q1 Q2 Q3 Q4*
2021 2022 2023
Imported c-Si Cells (GW
dc
)
U.S. Cell Imports by Region
Malaysia
Vietnam
Thailand
Cambodia
South Korea
China
Taiwan
Indonesia
ROW
(previous) 2.5 GWdc PV Cell Import Quota Exemption
0.00
0.50
1.00
1.50
2.00
2.50
3.00
3.50
7-Feb
9-Mar
8-Apr
9-May
8-Jun
9-Jul
8-Aug
8-Sep
8-Oct
8-Nov
8-Dec
7-Jan
7-Feb
PV Cells Imported Into U.S. (
GW
dc
)
U.S. Cell Imports by Tariff Year
2019
2020
2021
2022
2023
c-Si Cell Import Data
Sources: Imports by HTS code: 8541460025(2018-2021)/8541420010(2022-), Second Quantity (watts) from U.S. Census Bureau USA Trade Online tool and corrections
page
as of 1/10/24; U.S. Customs and Border Protection Commodity Status Reports Feb 2019–Jan 2024.
• According to U.S. Census data, 875 MW
dc
of cells were imported in Q3
2023 (2.4 GW in Q1–Q3 2023, +31% y/y), setting a record for imports in a
single quarter. However, that record has already been broken by the first 2
months of imports in Q4.
– This was mainly the result of increased imports from South Korea in Q3 (+228
MW
dc
q/q) and again the first 2 months of Q4 (+225 MW
dc
q/q), although there
was also a noticeable increase in imports from Cambodia (+84 MW
dc
) in Q4,
after having been responsible for less 4 MW total imports prior to Q2 2023.
• According to CBP Commodity Status Reports, starting in
mid-September of 2023, there was a noticeable uptick in
the import of cells relative to prior years. In mid-
November, imports exceeded the previous 2.5 GW
dc
PV
cell import quota level, which was significantly earlier
than in any prior year.
• As of early January, cell imports had exceeded 3 GW
dc
for
the first time, although it would be unlikely for imports to
hit the new 5.0 GW
dc
quota before it resets on February
7.

NREL | 52
Global Solar Deployment1
U.S. PV Deployment
2
PV System Pricing
3
Global Manufacturing
4
Component Pricing
5
U.S. PV Imports
6
7 PV Waste and Toxicity
Agenda
• The United States imported 40.6 GW
dc
of PV modules in Q1–Q3
2023, setting a new single-quarter record of over 15 GW
dc
of
modules imported.
– Most panels imported were exempt from Section 201 duties
and were therefore likely bifacial. A significant number of thin-
film modules were also imported.
• 2.4 GW
dc
of cells were imported in Q1–Q3 2023, up 31% y/y.
– The U.S. is not on pace to reach the 5-GW
dc
quota exemption
limit for Section 201 tariffs, although it has exceeded 3 GW
dc
of
imports in a single year for the first time.
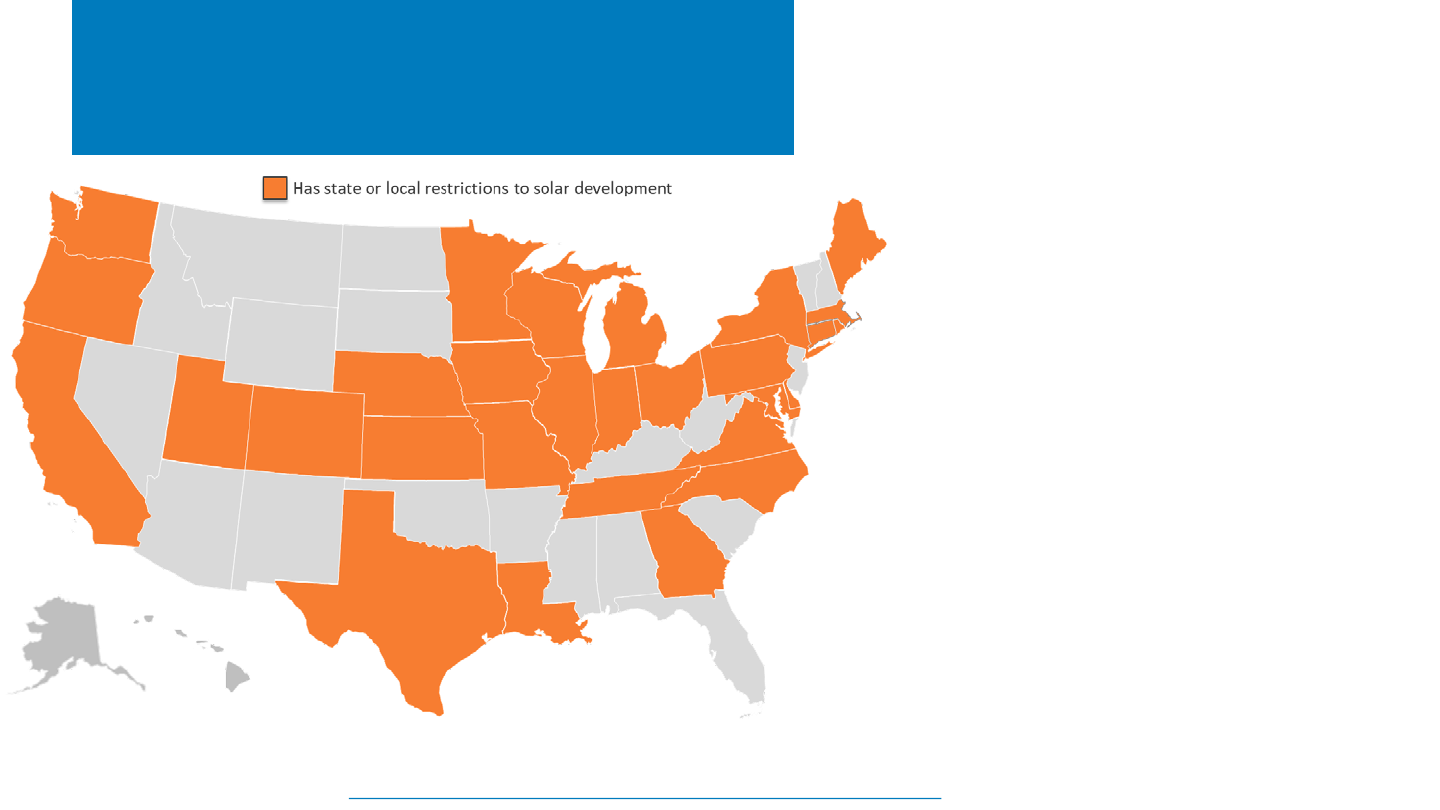
NREL | 53NREL | 53
State and Local Restrictions on PV
Development
Source: Sabin Center for Climate Change Law. Opposition to Renewable Energy Facilities in the United States: May 2023 Edition.
Opposition to PV development is
increasing:
• Between 2022 and 2023, the number of
renewable energy projects facing
organized opposition increased 39%.
• At least one restriction on PV
development exists in 29 states.
The fate of PV modules at the end of their
lives as well as module toxicity are among
multiple reasons given for opposing PV
projects, for example:
• “County Council members also raised
concerns about decommissioning and
whether landfills would accept solar
panels.”
• “A local group … claimed that the solar
array would pose risks to the health of
area residents due to toxic chemicals in
the panels.”
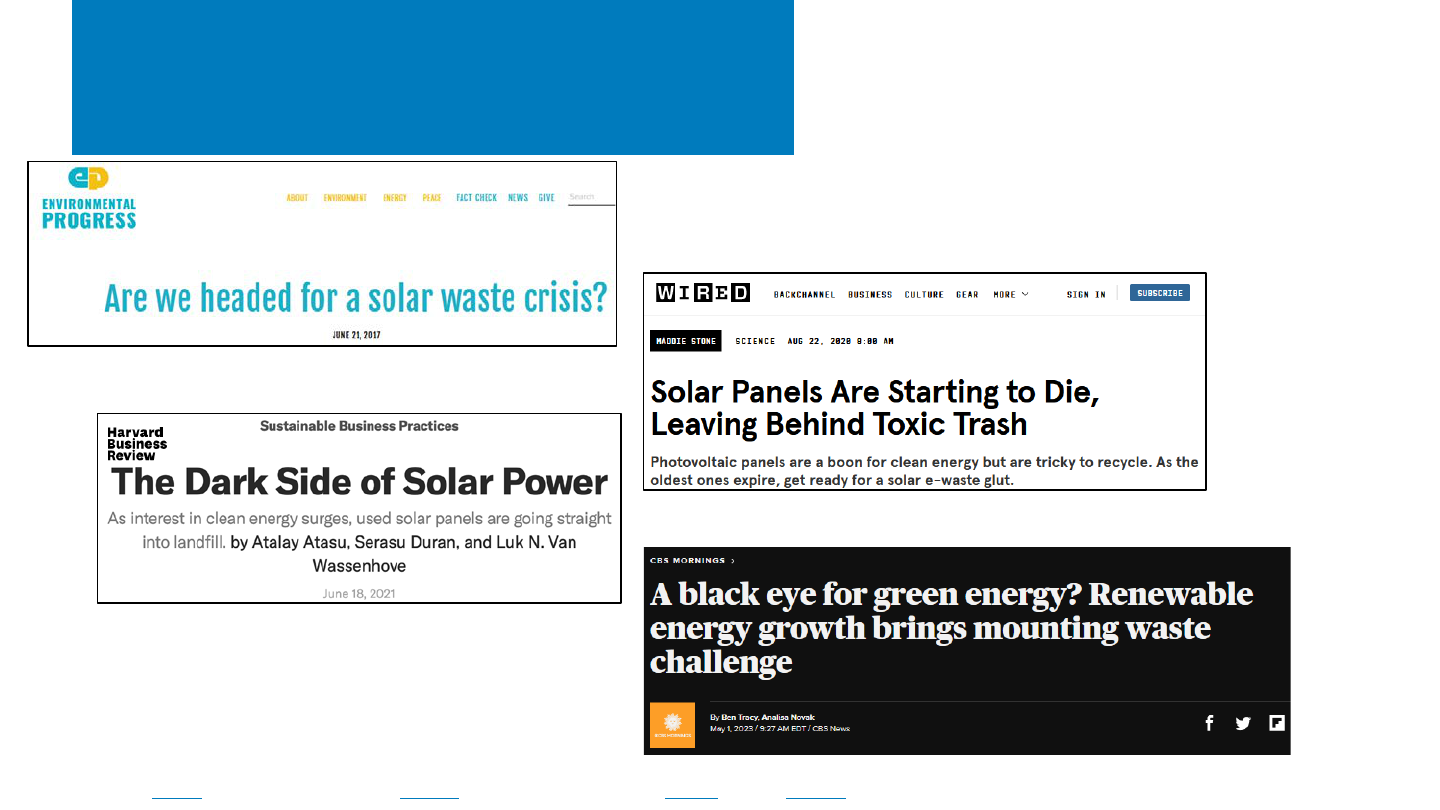
NREL | 54NREL | 54
Media Coverage of
PV Waste and Toxicity
Source: CBS News (5/1/23); Environmental Progress (6/21/17); Harvard Business Review (6/1821); Wired (8/22/20).
Media coverage about waste and toxicity
has appeared as U.S. and global PV
deployment has grown.
• Frequently lacks context and/or
intro
duces inaccurate information
2023
2017
2020
2021

NREL | 55NREL | 55
Global PV Module Deployment
and Waste Projections
Source: Mirletz et al., “Energy in the Balance: PV Reliability to Power the Energy Transition.” PV Reliability Workshop, 2023.
Globally, about 75 TW
dc
of PV must be
deployed by 2050 to achieve
decarbonization goals.
Timing of end-of-life module material
generation depends on module lifetimes.
• A 20-year lifetime results in 160 million
metric tons of end-of-life module material
by 2050 worldwide.
• A 45-year lifetime results in 54 million
metric tons.
• These values assume no module recycling
or other circular-economy strategies.
Cumulative Installed Capacity (TW)

NREL | 56NREL | 56
PV Module Waste in Context
Source: Mirletz et al. “Unfounded concerns about photovoltaic module toxicity and waste are slowing decarbonization.” Nature Physics, Oct 2023.
Compared with the amount of PV
module material projected
through 2050, the projected
amounts of other waste
categories are much larger, for
example:
• Coal ash, 300–800 times larger
• Municipal waste, 440–1,300
times larger.
Circular economy strategies
being developed—such as
improved module longevity and
module recycling—will reduce
the generation of end-of-life
module material.
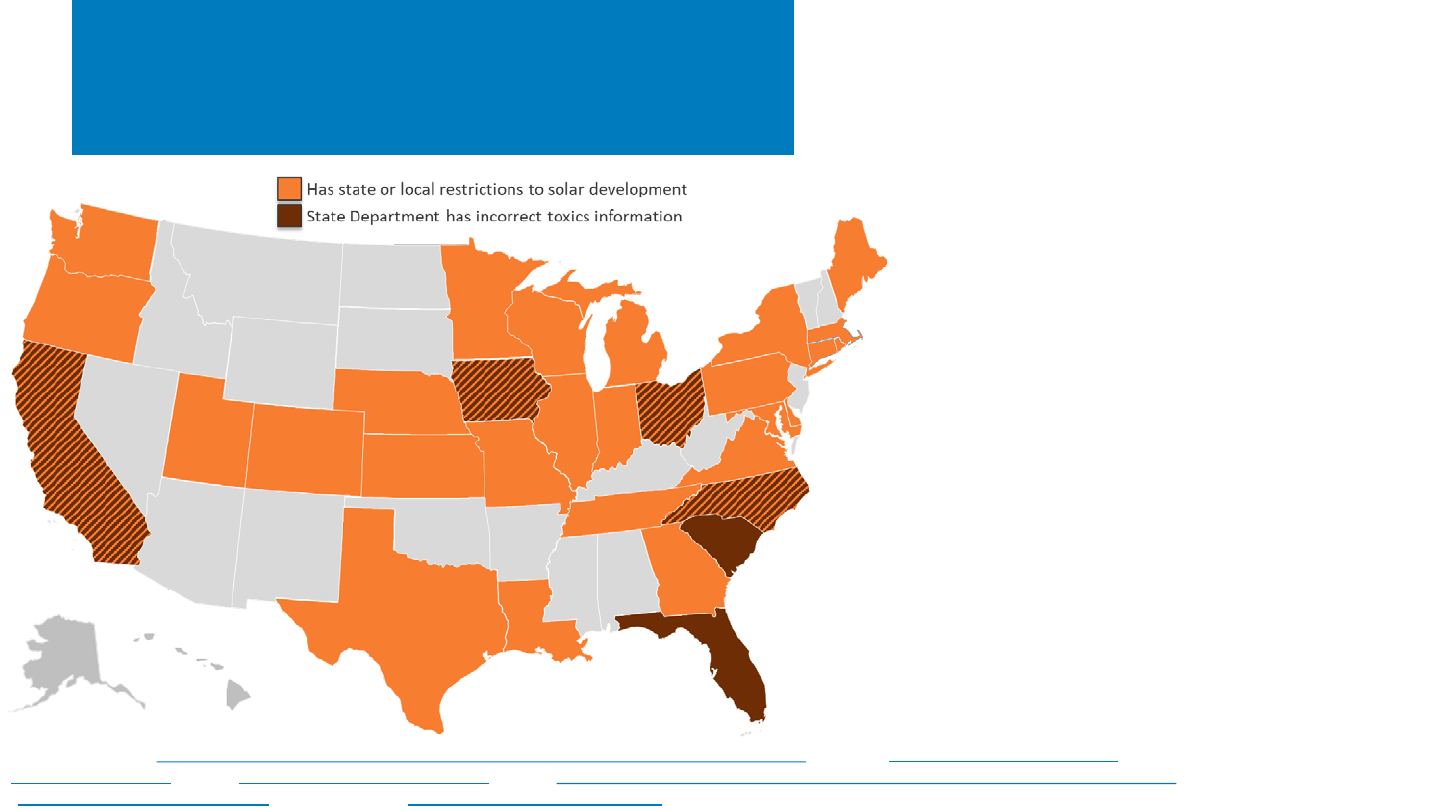
NREL | 57NREL | 57
Presence of Inaccurate PV Toxicity
Information on State Websites
Source: California, “Photovoltaic (PV) Modules (Including Solar Panels) Universal Waste Management – FAQs”; Florida, “Managing Unwanted or Broken
Solar Panels in Florida”; Iowa, “Solar Panel Recycling and Disposal”; Ohio, “Ohio Department of Health Solar Farm and Photovoltaics Summary and Assessments”; North Carolina,
“Solar Panel Recycling and Disposal”; South Carolina, “Shining Some Light on Solar Panels.”
Online resources provided by at
least six states—intended to
guide the public on end-of-life
module treatment—contain
inaccurate information about PV
module toxicity:
• California
• Florida
• Iowa
• Ohio
• North Carolina
• South Carolina.
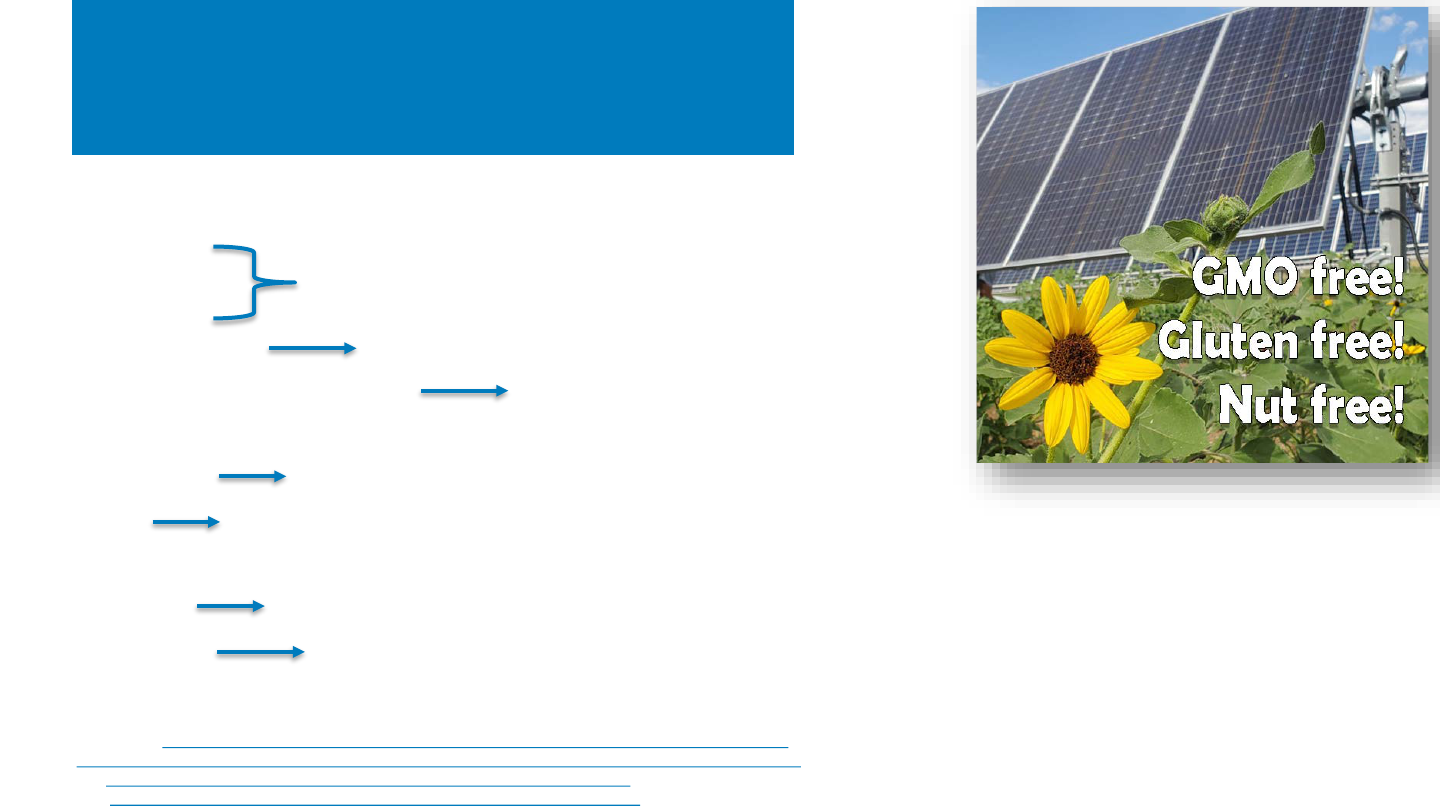
NREL | 58NREL | 58
Presence of Inaccurate PV Toxicity
Information on State Websites
Sources: Mirletz et al. “Unfounded concerns about photovoltaic module toxicity and waste are slowing decarbonization.” Nature Physics, Oct 2023.
Zhi et al. “
Ga-doped Czochralski silicon with rear p-type polysilicon passivating contact for high-efficiency p-type solar cell.” Solar Energy Materials and Solar Cells, 2021.
Munshi et al. “Polycrystalline
CdSeTe/CdTe absorber cells with 28 mA/cm2 short-circuit current.” IEEE Journal of Photovoltaics, 2017.
Ablekim et al. “
Thin-film solar cells with 19% efficiency by thermal evaporation of CdSe and CdTe.” ACS Energy Letters, 2020.
Seven materials are mentioned in the state resources.
Irrelevant to commercial PV applications:
1. Arsenic
2. Gallium*
3. Germanium
4. Hexavalent chromium
Managed materials:
5. Cadmium
6. Lead
Alloying/doping materials:
2. Gallium
7. Selenium
III-V cells for aerospace
Not used in PV modules
Once used in amorphous silicon PV; not at scale
Used in cadmium telluride PV, closed-loop recycling
Used in solder coating in silicon PV (<0.1% by mass; much lower content than in e-waste)
*Dopant (100 ppb) in p-type silicon PV; reduces light-induced degradation (replacing boron)
<2% alloy in a stable layer 250x thinner than a human hair of cadmium telluride PV cell;
closed-loop recycling. Used in copper indium gallium selenide PV, not at scale.
www.nrel.govwww.nrel.gov
Thank You
NREL/PR-7A40-88780
Special thanks to Nate Blair, Daniella Frank, Madeline Geocaris, and Adam Warren.
This work was authored in part by the National Renewable Energy Laboratory, operated by Alliance for
Sustainable Energy, LLC, for the U.S. Department of Energy (DOE) under Contract No. DE-AC36-
08GO28308. Funding provided by the U.S. Department of Energy Office of Energy Efficiency and
Renewable Energy Solar Energy Technologies Office. The views expressed in the article do not
necessarily represent the views of the DOE or the U.S. Government. The U.S. Government retains and
the publisher, by accepting the article for publication, acknowledges that the U.S. Government retains a
nonexclusive, paid-up, irrevocable, worldwide license to publish or reproduce the published form of this
work, or allow others to do so, for U.S. Government purposes.

NREL | 60NREL | 60
List of Acronyms and Abbreviations
AD: antidumping
ac: alternating current
ASP: average selling price
BBB: U.S. Better Business Bureau
BOS: balance of system
BNEF: Bloomberg New Energy Finance
CAISO: California Independent System Operator
CapEx: capital expenditures
CESA: Clean Energy States Alliance
C&I: commercial and industrial
CBP: U.S. Customs and Border Protection
CdTe: cadmium telluride
CPI: consumer price index
CPUC: California Public Utilities Commission
c-Si: crystalline silicon
CSP: concentrating solar power
CVD: countervailing
dc: direct current
DEWA: Dubai Electricity & Water Authority
DNI: direct normal irradiance
DOE: U.S. Department of Energy
DSCR: debt service coverage ratio
EIA: U.S. Energy Information Administration
ERCOT: Electric Reliability Council of Texas
ETF: exchange traded fund
GW: gigawatt
GWh: gigawatt-hour
H1: first half of year
H2: second half of year
HTS: harmonized tariff schedule
IEA: International Energy Agency
ILR: inverter loading ratio
IRA: Inflation Reduction Act
IREC: Interstate Renewable Energy Council
IRS: Internal Revenue Service
ISO: independent system operator
ITC: investment tax credit
kW: kilowatt
kWh: kilowatt-hour
LBNL: Lawrence Berkeley National Laboratory
mono c-Si: monocrystalline
MW: megawatt
MWh: megawatt-hour
NEM: net energy metering
NREL: National Renewable Energy Laboratory
PPA: power purchase agreement
PTC: production tax credit
PV: photovoltaics
Q: quarter
q/q: quarter over quarter
R&D: research and development
SEIA: Solar Energy Industries Association
SREC: solar renewable energy certificate
TAN: Invesco Solar ETF
TOPCon: tunnel oxide passivated contact
UFLPA: Uyghur Forced Labor Prevention Act
USD: U.S. dollars
W: watt
WRO: withhold release order
y/y: year over year
YTD: year to date
