Solar Photovoltaics
Supply Chain Deep Dive Assessment
U.S. Department of Energy Response to Executive
Order 14017, “America’s Supply Chains”
February 24, 2022

SOLAR PHOTOVOLTAIC S SUPPLY CHAI N DEEP DIVE ASSESSMENT
ii
About the Supply Chain Review for the
Energy Sector Industrial Base
This is one of a series of reports and deep dive assessments produced in response to Executive Order 14017
“America’s Supply Chains,” which directs the Secretary of Energy to submit a report on supply chains for the
energy sector industrial base. The Executive Order is helping the federal government to build more secure and
diverse U.S. supply chains, including energy supply chains.
To combat the climate crisis and avoid the most severe impacts of climate change, the U.S. is committed to
achieving a 50 to 52 percent reduction from 2005 levels in economy-wide net greenhouse gas pollution by
2030, creating a carbon pollution-free power sector by 2035, and achieving net zero emissions economy-wide
by no later than 2050. The U.S. Department of Energy (DOE) recognizes that a secure, resilient supply chain
will be critical in harnessing emissions outcomes and capturing the economic opportunity inherent in the
energy sector transition. Potential vulnerabilities and risks to the energy sector industrial base must be
addressed throughout every stage of this transition.
The DOE energy supply chain strategy report summarizes the key elements of the energy supply chain a s well
as the strategies the U.S. government is starting to employ to address them. Additionally, it describes
recommendations for Congressional action. DOE has identified technologies and crosscutting topics for
analysis in the one-year time frame set by the Executive Order. Along with a policy strategy report, DOE is
relea sing 11 deep dive assessment documents, including this one, covering the following technology sectors:
• carbon capture materials,
• electric grid including transformers and high voltage direct current (HVDC),
• energy storage,
• fuel cells a nd electrolyzers,
• hydropower including pumped storage hydropower (PSH),
• neodymium magnets,
• nuclear energy,
• platinum group metals and other catalysts,
• semiconductors,
• solar photovoltaics (PV), and
• wind
DOE is a lso relea sing two deep dive assessments on the following crosscutting topics:
• commercialization and competitiveness, and
• cybersecurity and digital components.
More information can be found at
www.energy.gov/policy/supplychains.
I n addition to the solar energy-related policy strategies laid out in DOE's companion
en ergy supply chain policy strategy report, this deep dive assessment includes its
own section focused on policy strategies and recommendations.
SOLAR PHOTOVOLTAIC S SUPPLY CHAI N DEEP DIVE ASSESSMENT
iii
Executive Summary
The Important Role of Solar Power
Over the past decade, solar power has gone from an emerging, niche technology to a mature energy industry.
By 2035, sola r power could supply 40% or more of U.S. electricity demand, dramatically accelerating the
decarbonization of buildings, transportation, and industry; and, if current technology trends continue, it could
do so without increasing the price of electricity.
∗
The rapid expansion of solar energy has the potential to yield broad benefits in the form of economic activity
and workforce development. The solar industry already employs roughly 230,000 people in the United States,
at an average wage that is higher than the national average for most comparable positions. By decarbonizing
the electricity sector by 2035, the U.S. solar industry could employ 500,000–1,500,000 people by 2030.
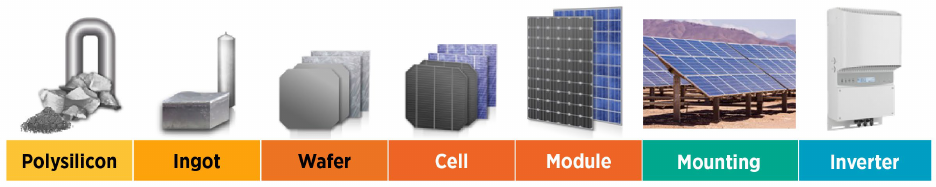
The Solar Photovoltaics Supply Chain
The components that are assembled to install a photovoltaic power system are produced by a global supply
chain. Photovoltaic (PV) modules (also called panels) are made of cells that use a variety of technologies.
There are two leading types of solar modules used in the United States, with crysta lline silicon (c-Si) modules
representing 84% of the market and ca dmium telluride (CdTe) modules representing 16% of the market.
Modules of either type require mounting structures to provide mechanical support (racking), which may be
configured to follow the sun (tracking). The output of any PV module is direct current (dc), which is a lm ost
always converted to alternating current (ac) by an inverter.
The supply chain for c-Si modules starts with the refining of high-purity polycrystalline silicon (polysilicon).
The primary input material for polysilicon is metallurgical-gra de silicon (MGS). MGS (a lso ca lled silicon
metal) is a commodity material produced from high-grade quartz. About 12% of the world’s MGS is refined to
make high-purity polysilicon for the solar supply chain. Polysilicon is melted to grow monocrystalline silicon
ingots, which are sliced into thin silicon wafers. Silicon wafers are processed to make the solar cells that are
interconnected and sandwiched between glass and plastic sheets to make c-Si modules.
About 97% of the world’s production of silicon wafers occurs in China. Those wafers are shipped from China
and made into solar cells. About 75% of the silicon solar cells incorporated into modules installed in the
United States are made by Chinese subsidiaries located in just three Southeast Asian countries: Vietnam,
Malaysia, and Thailand. As of this writing, the United States has no active c-Si ingot, wafer, or cell production.
∗
Solar Futures Study, U.S. Department of Energy, September 2021.
SOLAR PHOTOVOLTAIC S SUPPLY CHAI N DEEP DIVE ASSESSMENT
iv
The United States does have production capacity for thin-film CdTe modules, which do not rely on obtaining
ma teria ls from Chinese companies. The U.S. PV installations using CdTe modules (16% of the total) were all
supplied by a single U.S. company that produced roughly one-third of those modules in the United States.
The concentration of the c-Si supply chain in companies with close ties to China, a country with documented
human rights violations and an unpredictable trade relationship with the United States, poses a significant risk
of disruption to the c-Si supply chain. Given the rate at which the U.S. economy will need to deca rbonize, it is
unlikely that any alternate PV technology, including CdTe, could displace c-Si before 2035.
Strategies, Actions, and Recommendations
Significant financial support and incentives from the U.S. government as well as strategic actions focused on
workforce, manufacturing, human rights, and trade will facilitate a global solar industry aligned with U.S.
interests and the reestablishment of robust U.S. domestic solar manufacturing leadership –thus leading to
tremendous benefits for the climate as well as for U.S. workers, employers, and the economy. Three strategies,
actions, and recommendations are critical to U.S. success in building a robust solar supply chain:
Enact legislation to provide tax incentives to support domestic manufacturing, including
incentives for building new facilities and for the ongoing operation of those facilities.
Tax incentives are needed to provide a clear demand signal and help U.S. manufacturers build and maintain a
competitive edge in clean energy technologies such as solar photovoltaics. To reestablish domestic solar
manufacturing in the United States, companies that produce and sell solar components will require financial
support to offset the 30 to 40% higher cost of domestic solar production. Expansion of ingot and wafer
production should receive the highest incentive because nearly all the world’s capacity currently exists inside
China, and expansion in these sectors would have the compounding effect of creating demand for existing U.S.
polysilicon producers to run at full capacity. These tax credits should be enacted for at least a decade to
provide the long-term signal for companies to establish new production facilities. Renewal for some time
thereafter, perhaps at a reduced level, could be required to maintain domestic competitiveness.
Enact legislation to encourage domestic solar adoption and deployment
Extend and revise credits for clean energy deployment, such as the Production Tax Credit (PTC) and
Investment Tax Credit (ITC) to provide stronger incentives for clean energy projects that support domestic
manufacturing and increase family-sustaining jobs. To provide demand certainty in support of domestic
manufacturing investments, these tax credits should be in place for at least 10 years and should not phase out
until significant progress has been made toward domestic competitiveness and decarbonization goals.
Enhance coordination of trade policy across the U.S. government to create fair conditions for
the U.S. solar industry and its workers
U.S. solar manufacturers have too often faced unfair – a nd illega l - competition from firms that benefit from
foreign, non-market practices such as dumping. The United States has responded with trade remedies designed
to protect domestic manufacturing. Transparent, effective coordination and implementation of these policies is
critical to supporting domestic manufacturing as well as clean energy deployment. The U.S. government will
continue to conduct expert analysis and engage with relevant stakeholders to refine implementation of trade
policies to optimize their effectiveness in leveling the playing field across the supply chain, while removing
barriers to solar deployment.
Supplement these strategies and recommendations with supportive policy actions.
See Section 3.4 for detailed strategies starting to be implemented by the U.S. government and
recommendations for Congressional action related to the solar energy supply chain.

SOLAR PHOTOVOLTAIC S SUPPLY CHAI N DEEP DIVE ASSESSMENT
v
Find the policy strategies to address the vulnerabilities and
opportunities covered in this deep dive assessment, as well as
assessments on other energy topics, in the Department of Energy 1-
year supply chain report: “America’s Strategy to Secure the Supply
Chain for a Robust Clean Energy Transition.”
For more information, visit www.energy.gov/policy/supplychains
.
SOLAR PHOTOVOLTAIC S SUPPLY CHAI N DEEP DIVE ASSESSMENT
vi
Table of Contents
1 Solar Photovoltaics............................................................................................................... 1
1.1 The Solar Photovoltaic System .........................................................................................1
1.2 U.S. Solar Photovoltaics Strategy......................................................................................2
1.3 The Global Role of Solar Photovoltaics .............................................................................7
2 Supply Chain Mapping ....................................................................................................... 13
2.1 Input Materials............................................................................................................. 13
2.2 Polysilicon Refining ..................................................................................................... 23
2.3 Ingots/Wafers .............................................................................................................. 29
2.4 Solar Cell Fabrication ................................................................................................... 35
2.5 Module Assembly ........................................................................................................ 43
2.6 Mounting Structures ..................................................................................................... 50
2.7 PV Inverters ................................................................................................................ 56
2.8 Cadmium Telluride Technology ..................................................................................... 63
3 Policy Considerations ......................................................................................................... 72
3.1 Opportunities and Challenges ......................................................................................... 72
3.2 Current Policies in the United States................................................................................ 75
3.3 Current Policies in Other Countries ................................................................................. 79
3.4 Policy Actions ............................................................................................................. 81
Appendix................................................................................................................................ 84
Stakeholder Outreach
List of Acronyms
Lists of Tables and Figures
References
Acknowledgements
SOLAR PHOTOVOLTAIC S SUPPLY CHAI N DEEP DIVE ASSESSMENT
1
1 Solar Photovoltaics
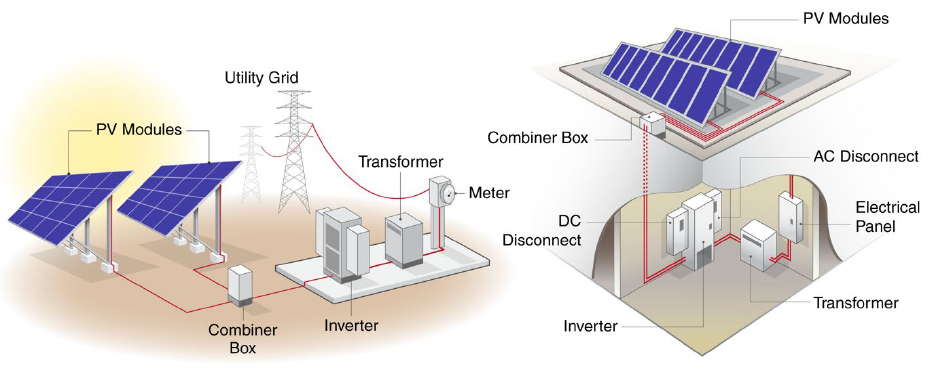
1.1 The Solar Photovoltaic System
To create a grid-connected photovoltaic (PV) system, multiple PV modules (panels) are electrically
interconnected and mounted to a support structure. The module (panel) is the core component of a photovoltaic
(PV) system. The vast majority of global PV module shipments (96% in 2020) use crystalline silicon (c-Si)
technology, made from melting chunks of polysilicon into ingots (i.e., blocks of polysilicon), slicing those
ingots into thin wafers, converting the wafers into PV cells (which convert light into energy), and then
assembling a series of cells into a PV module. The remaining PV module shipments mostly use cadmium
telluride (CdTe) technology, which is typically manufactured by directly depositing the CdTe cell onto the
glass of the PV module. A higher percentage of CdTe is installed in the United States (16% compared to 4%
globa lly), with c-Si representing the remaining 84% (Feldman and Margolis 2021).
Additional components are added to manage the flow of electricity. Inverters, which convert direct current (dc)
electricity from the modules into alternating current (ac) for connection to the grid, are the most important and
expensive balance-of-system component. Other components include wiring, meters, junction boxes, ac and dc
disconnects, combiner boxes, transformers, electrical panels, and mounting structures.
System components and designs vary by installation type (Figure 1). For example, the mounting structures
used for residential rooftop PV systems can differ substantially from those used for commercial rooftop
systems, and the mounting structures used for both categories of rooftop systems are much different than those
used for ground-mounted systems. Increasingly, batteries are being combined with PV systems, which requires
additional or substitute components such as battery-based inverters and charge controllers.
Beyond hardware components, various activities are required to create PV systems, such as customer
acquisition, land acquisition, system installation by trained installers, permitting, and grid interconnection.
These activities result in “soft” costs, which make up more than half of total system costs for residential and
com m ercia l PV insta lla tions.
Figure 1. Illustrations of a utility-scale PV system (left) and a commercial rooftop system (right).
SOLAR PHOTOVOLTAIC S SUPPLY CHAI N DEEP DIVE ASSESSMENT
2
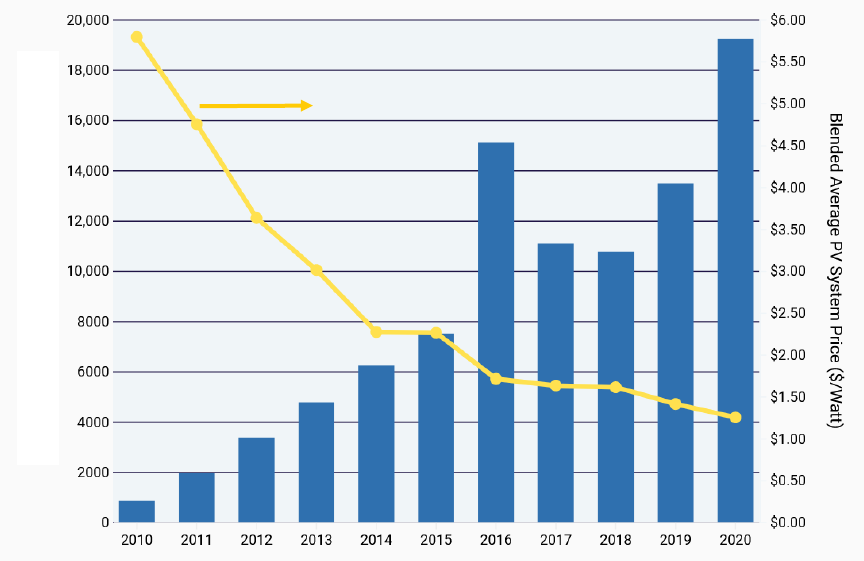
1.2 U.S. Solar Photovoltaics Strategy
Solar photovoltaics is an important technology in U.S. efforts to reduce greenhouse gas emissions and
minimize climate change impacts. Decades of innovation and cost reductions have made PV one of the lowest-
cost forms of electricity generation, and PV deployment has grown in concert with falling prices (Figure 2).
Figure 2. U.S. PV price reductions and annual deployment growth.
Source: (“Solar Industry Research Data” n.d.)
In 2010, solar power represented approximately 5% of new U.S. electric generation capacity additions; by
2020, it had grown to 40% and EIA expects it to further grow above 50% in 2022 (EIA 2021a; 2021b; 2022).
Sola r power is a critical, affordable, and reliable energy option for America, supplying more than 8% of energy
generation in six U.S. states (with California leading the way at almost 23%) (Feldman and Margolis 2021;
IEA 2021).
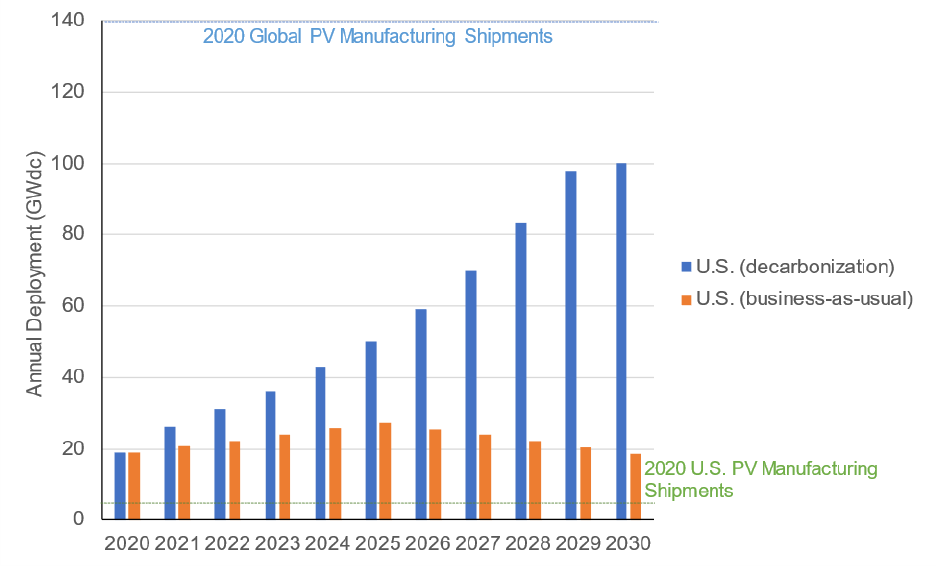
Despite this growth, decarbonizing the electricity sector in the United States would require significa nt
acceleration of annual PV deployment. Compared with 19 giga wa tts (GW
dc
) of PV deployed in the United
States in 2020, annual PV deployment would need to double in the early 2020s and to quintuple by the end of
the decade in the most aggressive grid decarbonization scenario, as demonstrated in Figure 3 (Ma rgolis et a l.
2021). This would greatly dwarf current U.S. PV manufacturing and represent a significant portion of current
global PV manufacturing shipments. That said, global shipments are projected to grow to close to 200 GW
dc
per year by 2030, in a business-as-usual case, and could grow above 500 GW
dc
by 2030 under a globa l
decarbonization scenario (BloombergNEF 2021; IEA 2020).
Annual Installed New Capacity (MW
dc
)
Use right axis
SOLAR PHOTOVOLTAIC S SUPPLY CHAI N DEEP DIVE ASSESSMENT
3
Source: (Adapted from Ma rgolis et a l. 2021)
Further substantial technological and cost improvements are expected over the coming years which should
facilitate the growth of the PV sector. In addition, the modularity of PV enables deployment at a wide range of
scales—from a few kW
dc
on residential rooftops to one or more GW
dc
in utility-scale solar parks—and creates
unique roles for PV in the buildings, industrial, and transportation sectors. In such a decarbonized scenario
with continued PV cost reductions, solar power could supply 40% or more of U.S. electricity demand,
dramatically accelerating the decarbonization of buildings, transportation, and industry; and doing so without
increasing the price of electricity.
The solar-driven clean energy transition could yield broad economic benefits in the form of jobs and workforce
development. The solar industry already employs around 230,000 people in the United States, at an average
wa ge that is higher than the national average for most comparable positions. With such a dramatic increase in
domestic demand, there is potential for significant expansion in U.S. PV manufacturing. At the growth rate
necessary to achieve power-sector decarbonization by 2035, the U.S. solar industry could employ 500,000–
1,500,000 people by 2030.
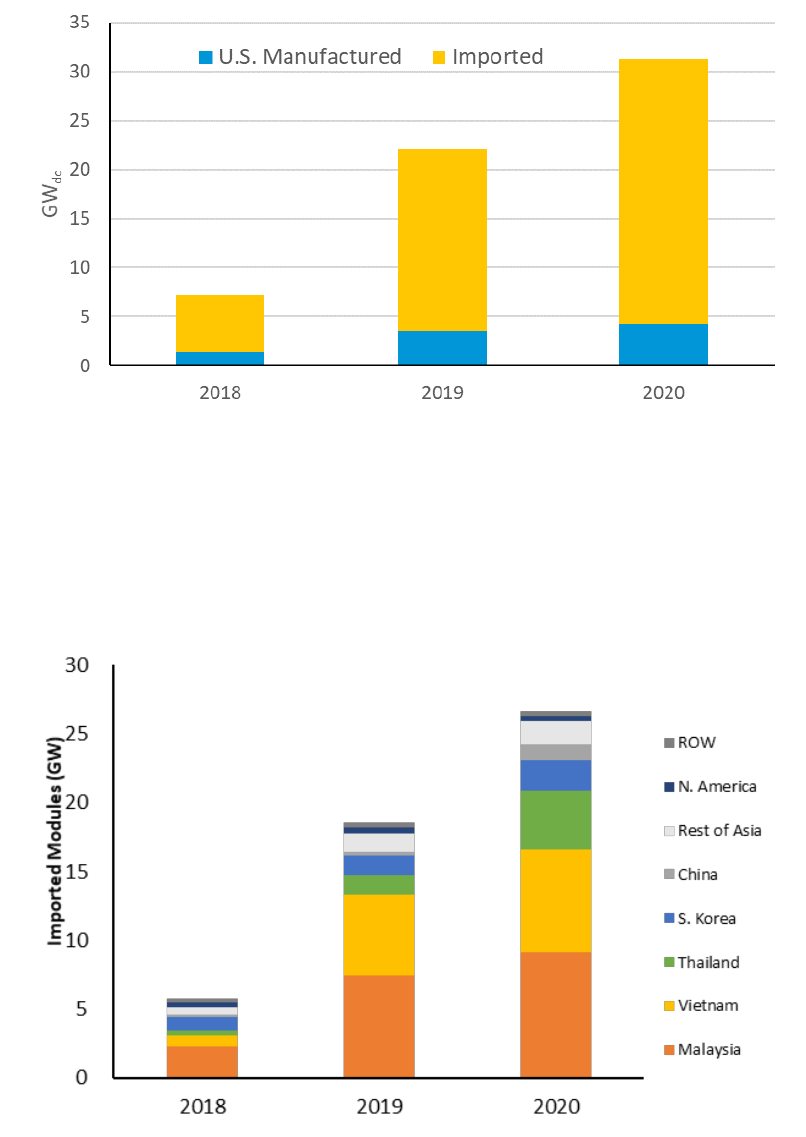
Recently, the vast majority of PV modules installed in the United States were imported (Figure 4), with U.S.
manufacturing of c-Si and CdTe modules together supplying just 14% of U.S. PV insta lla tions in 2020.
SOLAR PHOTOVOLTAIC S SUPPLY CHAI N DEEP DIVE ASSESSMENT
4
Figure 4. U.S. PV module production and imports.
Figure 5 and Figure 7)
More than 75% of the modules imported in 2020 (counting both c-Si and CdTe) came from just three
Southeast Asian countries: Malaysia, Vietnam, and Thailand (Figure 5). These Southeast Asian manufacturers
rely heavily on an upstream Chinese supply chain.
Figure 5. U.S. PV module imports by region.
SOLAR PHOTOVOLTAIC S SUPPLY CHAI N DEEP DIVE ASSESSMENT
5
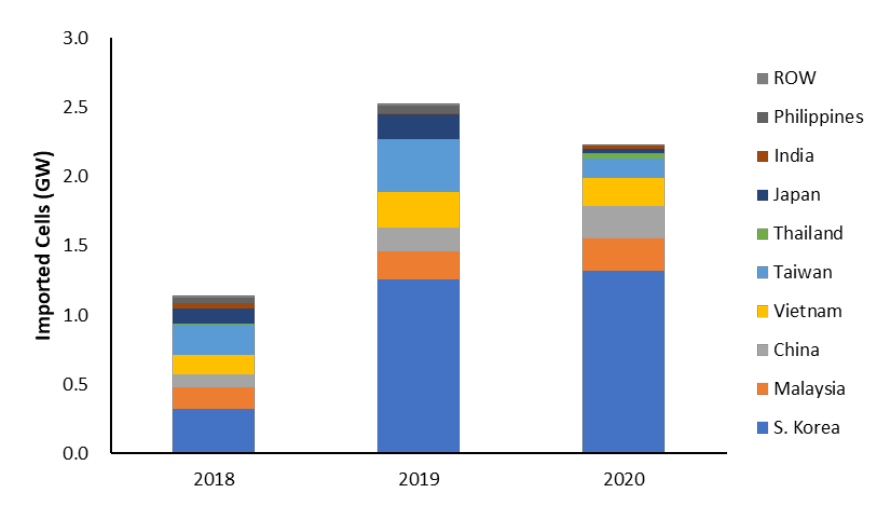
In addition, all of the silicon sola r cells that are assembled into modules in the United States are imported
(Figure 6). The United States has no operating capacity for making silicon solar cells. Considering both
imported c-Si modules and domestic c-Si module assembly, about 75% of the silicon solar cells installed in the
United States in 2020 came from Southeast Asia (Vietnam, Malaysia, and Thailand), with the majority of the
remainder coming from South Korea.
Figure 6. U.S. silicon cell imports by region.
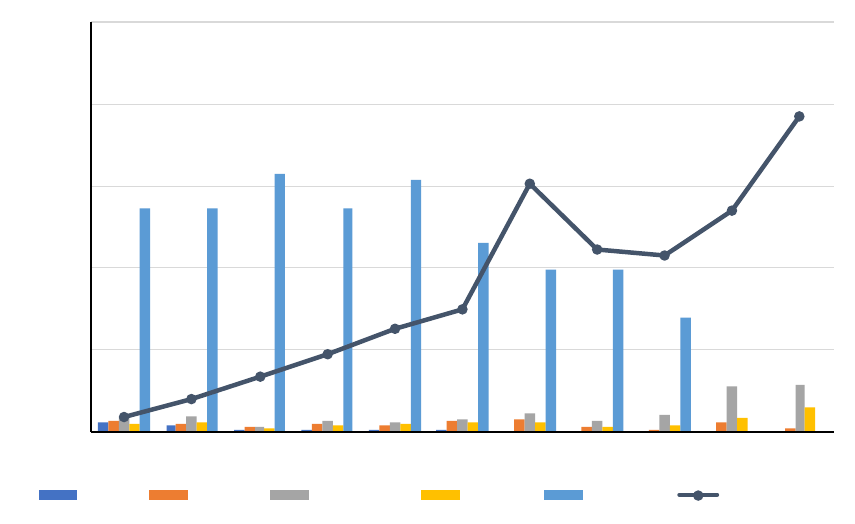
Historically, the U.S. PV market was not as heavily dependent on imports, however from 2010 to 2020, U.S.
manufacturers faced multiple challenges related to low-cost imports or imposed tariffs. Capacity for module
assembly stagnated for most of the past decade due to market availability of low-cost imported PV modules;
first, largely from China, and then mostly Southeast Asia. Wafer production in the United States ended
altogether in 2015 due to lower-cost imports. Production of cells varied year to year, but cell producers
suffered a series of bankruptcies in 2018, again due to the availability of low-cost imports.
In 2019, cell production started to rebound in part because of the new tariffs; however, the tariffs were not
sufficient to enable the existing cell manufacturers to continue and, in Q4 2020, cell production stopped,
having produced 198 MW
dc
for the year. As of this writing, the United States has no active ingot, wafer, or c-
Si cell manufacturing capacity. The considerable polysilicon production capacity, which could be a part of the
U.S. PV supply chain, is also mostly idle because China, which hosts the vast majority of all wafer
manufacturing, placed tariffs on U.S.-produced polysilicon in 2014, forcing them to scale-back production to
supply only the semiconductor (integrated-circuit) industry. Over this same period, as U.S. PV manufacturing
was shrinking, the U.S. PV installation rate grew from 0.8 GW
dc
to 19 GW
dc
(Figure 7).
SOLAR PHOTOVOLTAIC S SUPPLY CHAI N DEEP DIVE ASSESSMENT
6
Figure 7. U.S. production of PV components and U.S. PV installations over time.
Using im ported cells, U.S. c-Si module assembly did began scaling up significantly in 2018 and 2019, due in
pa rt to U.S.-placed tariffs on imported modules. In 2020, the United States assembled a record 4.3 GW
dc
of PV
modules, up 24% over 2019, mostly because of a doubling of production capacity by thin-film ma nufacturer
First Solar. If U.S. PV demand growth continues, there may be an opportunity for further domestic
manufacturing expansion, particularly given the disruptive nature that global politics can have on the PV
supply chain. The impact of restrictions imposed in 2021 on importing solar products potentially traceable
back to a company in China linked to human rights abuses illustrates the importance of having multiple
sources of supply. Developing the U.S. PV supply chain could also mitigate challenges related to production
disruptions, competing demand from other industries or countries, and global politics (Margolis et al. 2021).
Beyond domestic supply chain growth, to fully realize the benefit of solar power to society, its costs and
benefits must be distributed equitably, the entire supply chain must be operated in a safe and socially
responsible manner, the input materials must be produced without forced labor, and recycling at end-of-life
must become standard practice.
Like all energy technologies, solar power generates negative externalities throughout its life cycle, though they
are trivial compared to the externalities of fossil fuel technologies that solar technology displa ces. The negative
externa lities of sola r power can be mitigated through measures to promote a circular economy in solar
manufacturing, installation, and disposal. For example, periodic repairs can extend solar system lifetimes
beyond the conventional useful life of 20–30 years and degraded solar panels can be transferred and reused in
applications compatible with lower system output. By extending useful lifetime, repair and reuse can delay the
need for new resource extraction and manufacturing and delay end-of-life disposa l. Further, certa in sola r
system components and materials can be recycled, avoiding raw material extraction and disposal (Ma rgolis et
al. 2021).
0
5
10
15
20
25
2010 2011 2012 2013 2014 2015 2016 2017 2018 2019 2020
(GW)
Wafe rs c-Si Cells c-Si Modules Thin- Polysilicon
SOLAR PHOTOVOLTAIC S SUPPLY CHAI N DEEP DIVE ASSESSMENT
7
Solar energy also presents an opportunity to remedy historic injustices in the energy sector. Low- and medium-
income communities and communities of color have been disproportionately harmed by the fossil-fuel-based
energy system, with exposure to poor air quality and other harmful pollution disproportionately higher in
communities of color. Further, low- and medium-income communities and communities of color have
historically had to dedicate a greater share of household income toward energy expenses than white and
higher-income households. Solar deployment—at the scale necessary to decarbonize the U.S. electricity
sector—presents an opportunity to maintain the benefits of the modern energy system while distributing
mitigated costs and larger rewards more equitably. The growth in the use of solar technologies presents many
potential benefits including climate change mitigation, improved air quality, job creation, and local wea lth
building. New approaches to energy policy and development may be needed to ensure that the benefits of the
zero-carbon system are equitably distributed (Margolis et al. 2021).
1.3 The Global Role of Solar Photovoltaics
A significant portion of PV-component supply, varying by the stage of the supply chain, comes from China.
While a considerable (but minority) portion of cells, modules, and polysilicon can be sourced outside of China,
the global PV supply chain is almost entirely dependent on ingot and wafers from China. Additionally, many
of the other pieces of the module supply chain, such as the manufacturing of production-facility equipment and
balance-of-module components (e.g., glass, aluminum frames), are predominantly located in China. China also
manufactures a significant share of balance-of-PV-system components, including inverters (which convert the
dc output from PV modules to ac power used by the electrical grid) as well as aluminum and steel used for
mounting PV modules.
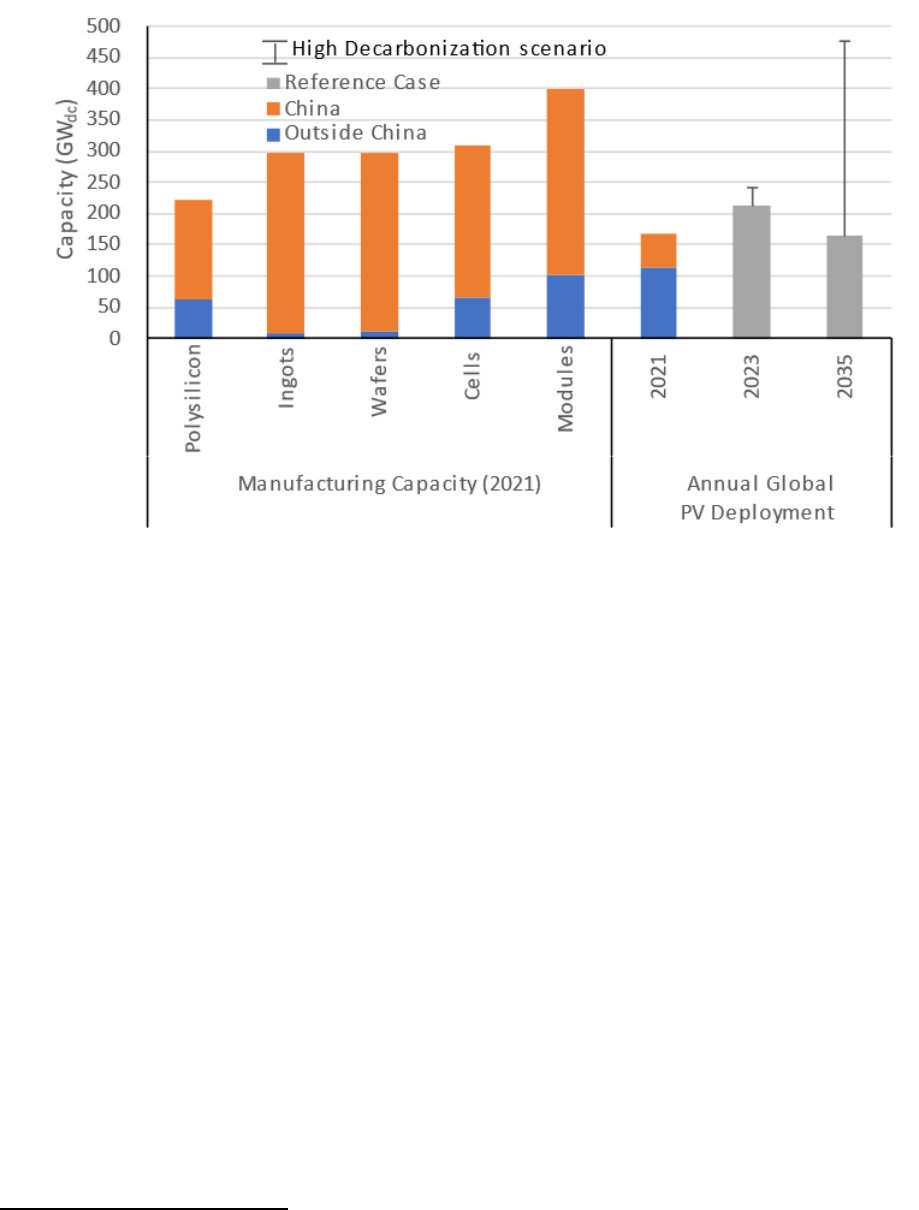
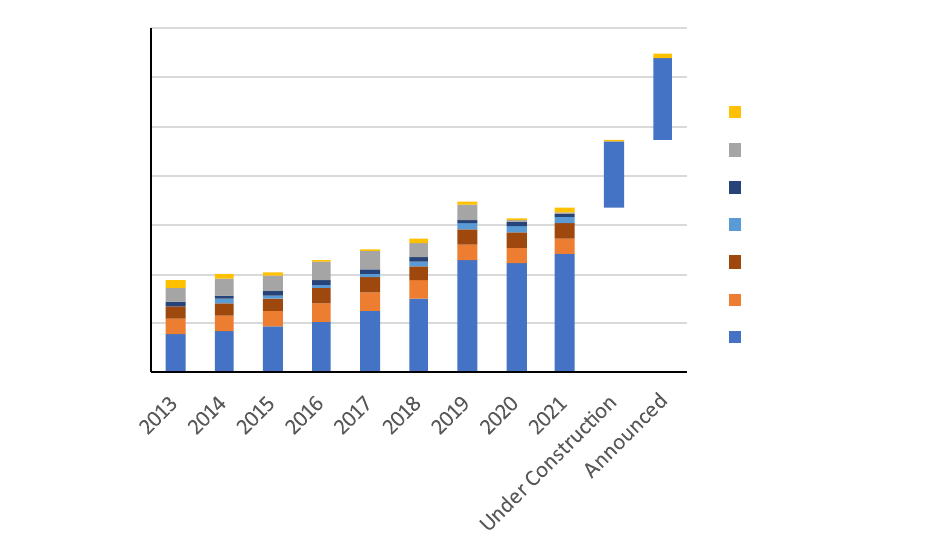
Current PV module manufacturing capacity is well above current deployment levels. By 2035, a high-
decarbonization scenario would require significant expansion of several parts of the supply chain (Figure 8).
Regardless of capacity increases, existing manufacturing capacity will likely be replaced or refurbished by
lines that will produce more efficient and/or cheaper panels.
SOLAR PHOTOVOLTAIC S SUPPLY CHAI N DEEP DIVE ASSESSMENT
8
Figure 8. PV manufacturing capacity and deployment, inside and outside China.
1
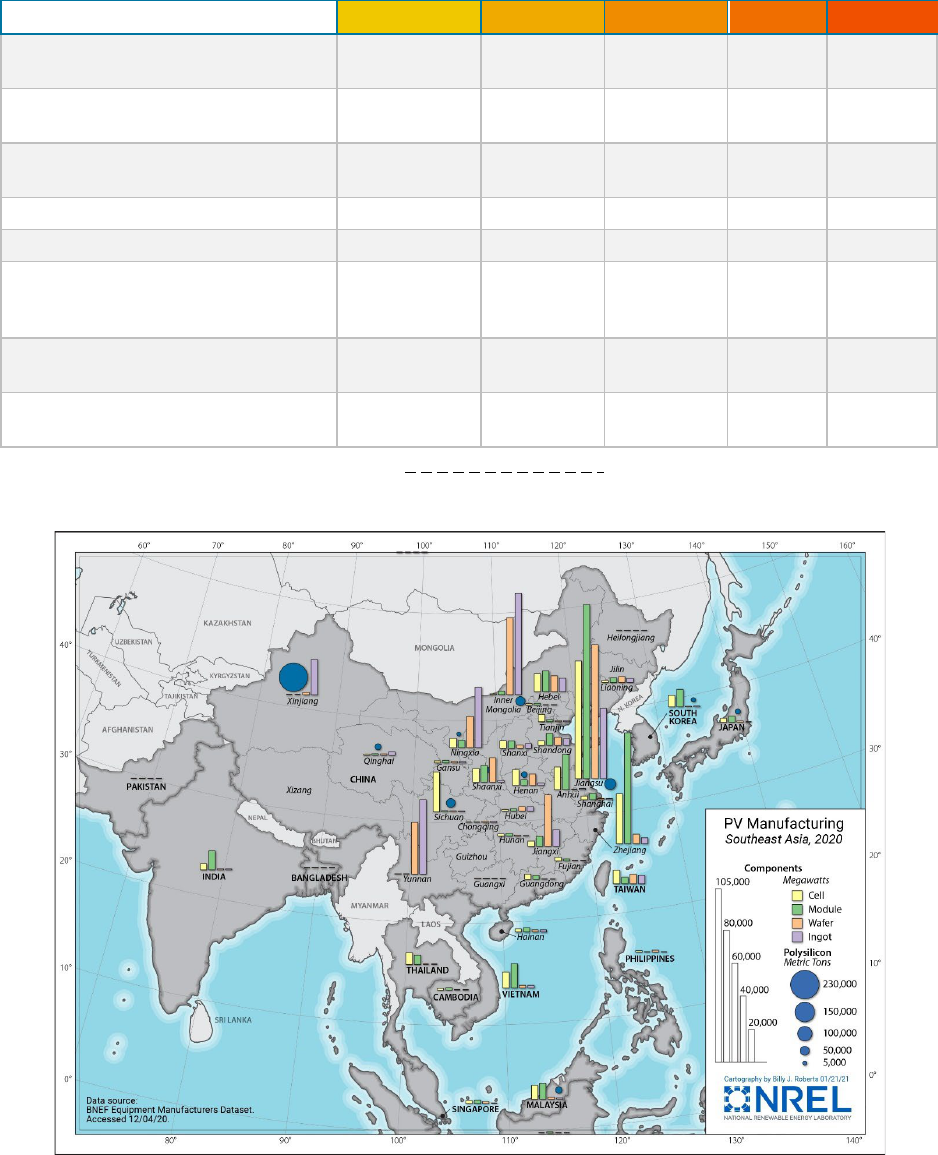
Within China, PV production is clustered in a handful of provinces, representing 80%-93% of total Chinese
manufacturing and 64%-81% of total global manufacturing (Ta ble 1, Figure 9). Some provinces span multiple
PV manufacturing steps, but many tend to focus on one manufacturing step.
Labor, electricity price, and proximity to shipping correlate with provincial strength and manufacturing needs.
Western Chinese provinces, with cheap labor and electricity, have high levels of manufacturing for steps that
use significant amounts of electricity (polysilicon, ingots) or labor (ingots, wafers). Eastern provinces, with
easier access to global shipping and proximity to Chinese populations, are more likely to have PV
manufacturing steps later in the process, in preparation for the exports or domestic end-use development
(wafers, cells, modules). Some provinces have significant market share across components, due to the benefits
of integrating manufacturing steps, and economies of scale a ssocia ted with la rger-sca le fa cilities a nd supply
chains.
Forced labor in the mining and processing of raw materials in China’s Xinjiang province adds a new
dimension of uncertainty to the solar supply chain’s reliance on Chinese production. Metallurgical-gra de
silicon (MGS) and the coal used to produce electricity have been highlighted by the U.S. government as direct
beneficiaries of government-sponsored forced-labor programs in that region.
1
Assumes 3 grams of polysilicon per watt.
SOLAR PHOTOVOLTAIC S SUPPLY CHAI N DEEP DIVE ASSESSMENT
9
Table 1. Chinese PV manufacturing by component and province.
Province Rank in China
Polysilicon
Ingots
Wafers
Cells
Modules
1
Xinjiang
Inner
Mongolia
Jiangsu
Jiangsu
Jiangsu
2
Inner
Mongolia
Yunnan
Yunnan
Zhejiang
Zhejiang
3
Jiangsu
Ningxia
Inner
Mongolia
Sichuan
Anhui
4
Sichuan
Jiangsu
Jiangxi
Shaanxi
Hebei
5 Qinghai Sichuan Ningxia Henan Jiangxi
Chinese Frac t i o n of Global
Manufacturing Capacity by
Component
72% 98% 97% 81% 77%
To p -5 Provinces Fraction of
Chinese Manufacturing Capacity
93%
83%
81%
80%
84%
To p -5 Provinces Fraction of Global
Manufacturing Capacity
67%
81%
78%
65%
64%
Source: (BloombergNEF 2021)
Figure 9. PV manufacturing in Southeast Asia, 2020.
Source: (BloombergNEF 2021f)
SOLAR PHOTOVOLTAIC S SUPPLY CHAI N DEEP DIVE ASSESSMENT
10
Due to China’s low labor costs, concentrated supply chain, a nd non-market practices, it has been difficult for
the United States to compete against China across c-Si PV components. The capital cost of production
fa cilities is a minor a dditiona l factor in China’s favor, with capital expenditure representing 8% of the
production cost in China versus 10% in the United States. Figure 10 compares Chinese and U.S. production
costs across the c-Si PV supply chain.
Figure 10. Production costs for c-Si PV manufacturing in the United States and China.
Source: NREL
Labor expenses are the principal source of difference between calculated PV manufacturing costs in the United
States and China, particularly for labor intensive manufacturing steps (see Ta ble 2). Labor costs represent 22%
of total U.S. manufacturing costs versus 8% in China, 33% of U.S. cell manufacturing costs versus 8% in
China, and 36% of U.S. wafer manufacturing costs versus 23% in China.
There are pathways to reduce the cost delta by introducing more automation in the United States. These
include more-automated approaches being developed by ingot and wafer factories, as well as more-automated
approaches being used to manufacture state-of-the-art cell and module technologies. Automation should be
considered as part of a holistic workforce approach that accounts for job quality and the ability of incumbent
workers to maintain their livelihood, in addition to a company’s long-term growth plan. Such a strategy has
proven to be successful for the production of CdTe panels in the United States. As demonstrated in Figure 11,
the cost to produce a CdTe in the United States is approximately the same as that of Southeast Asia, when
accounting for shipping.
$0.00
$0.05
$0.10
$0.15
$0.20
$0.25
$0.30
$0.35
$0.40
China U.S. China U.S. China U.S. China U.S. China U.S.
Polysilicon
Wafer
Ce l l
Module To ta l
($/Wdc)
Shipping
Maintenance
Labor
Materials
SOLAR PHOTOVOLTAIC S SUPPLY CHAI N DEEP DIVE ASSESSMENT
11
Table 2. Labor cost drivers across the c-Si and CdTe supply chain.
Labor Cost
Drivers
c-Si Supply Chain
CdTe Module
Production
Polysilicon
Ingot and
Wafer
Cell
Conversion
Module
Assembly
Labor Intensity
(Direct full-time
employees (FTE) per
MW
dc
of production)
0.035—0.070
(40—85 MT per
year per FTE for
Siemens to FBR.
@ 2.8 g/W)
0.40—0.80
(Labor intensity
in U.S or
Europe to
China)
0.15—0.45
(Advanced
technology to
PERC)
0.50—0.70
(Advanced
technology to
PERC)
0.40—0.60
Direct
Manufacturing
Jobs at 1 GW
dc
Scale
35—70 400—800 150—450 500—700 400—600
Assumed Hourly
Labor Rates for
Cost Models
($2020 USD)
$4.1—5.0 per hour for direct operators in China
$6.2—7.5 per hour for first-line supervisors in China
Housing, cafeteria, and insurance expenses included.
$14.3—22.0 per hour for direct operators in electronics assembly in the United
States
$23.3—38.8 per hour for first-line supervisors in the United States
Additional 35% benefits expense assumed for workers in the United States
Source: NREL update of (Smith et al. 2021)
Figure 11. Production costs for CdTe PV manufacturing in the United States and Southeast Asia.
Source: NREL update of (Smith et al. 2021)
$0.00
$0.05
$0.10
$0.15
$0.20
$0.25
$0.30
$0.35
Southea s t Asia U.S.
CdTe
($/Wdc)
Shipping
Maintenance
Labor
Materials

SOLAR PHOTOVOLTAIC S SUPPLY CHAI N DEEP DIVE ASSESSMENT
12
Because of the current gaps in the domestic PV supply chain, virtually all c-Si manufacturing inputs are
imported (i.e., “Import Costs” in Figure 10), from the aluminum frame and glass to the PV cells. These import
costs add 11% to the total U.S. PV manufacturing costs. A build-up in domestic PV supply chain would
significantly reduce these costs. The time to build new fa cilities, minim um sca le of fa cilities, a nd ca pita l
expenditures, vary by manufacturing step (Ta ble 3), with certain steps less expensive and faster (module
assembly) to scale than others (ingot and wafer).
Table 3. Fixed cost drivers across the c-Si and CdTe supply chain.
Fixed Cost
Drivers
c-Si Supply Chain
CdTe Module
Production
Polysilicon
Ingot and
Wafer
Cell
Conversion
Module
Assembly
Initial Capital
Expenditure
($USD per Watt of
annual capacity)
for equipment:
for balance-of-plant
or factory
$0.11-0.14/W
($40—50/kg,
2.8 g/W)
$0.06—0.08/W
$0.04—0.06/W
$0.08-0.10/W
($0.54/wafer, 6.0
W for M6)
$0.06—0.07/W
$0.02—0.03/W
$0.05-0.13/W
(PERC to
Advanced
technology)
$0.03—0.10/W
$0.02—0.03/W
$0.05-0.08/W
(Standard to
Busbarless)
$0.03—0.05/W
$0.02—0.03/W
$0.28-0.36/W
(430-W series)
$0.25—0.30W
$0.03—0.06/W
1 GW
dc
Investment
for equipment:
for balance-of-plant
or factory
$110—140M
$65—80 M
$45—60 M
$80—100M
$60—70 M
$20—30 M
$50—130M
$30—100M
$20—30M
$50—80M
$30—50M
$20—30M
$280—360M
$250—300M
$30—60M
Time to Build
(Engineering to
production)
3—4 years
(All-new, not
retrofit)
1—3 years
1—3 years
1—3 years
1—3 years
Source: NREL update of (Smith et al. 2021)
SOLAR PHOTOVOLTAIC S SUPPLY CHAI N DEEP DIVE ASSESSMENT
13
2 Supply Chain Mapping
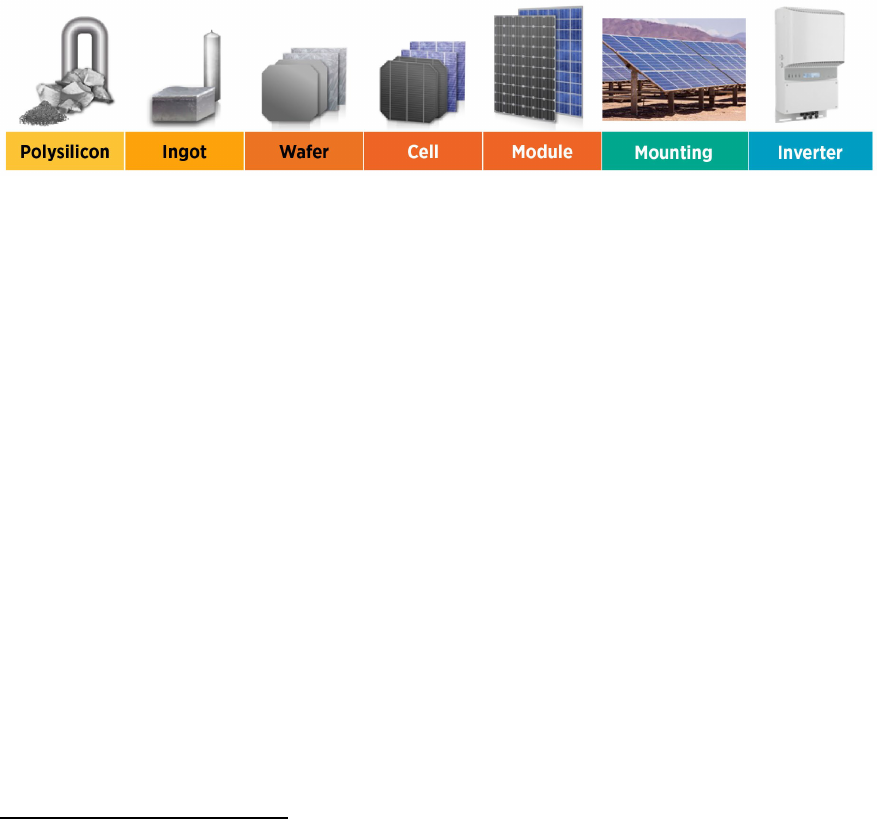
Figure 12 illustra tes the steps in the c-Si supply chain, from polysilicon to modules, which are physically
attached to mounting structures and electrically attached to inverters. This chapter provides supply chain
details for each step, followed by a section addressing ca dm ium telluride thin-film technology.
Figure 12. Principal sectors of the c-Si supply chain.
Source: NREL
2.1 Input Materials
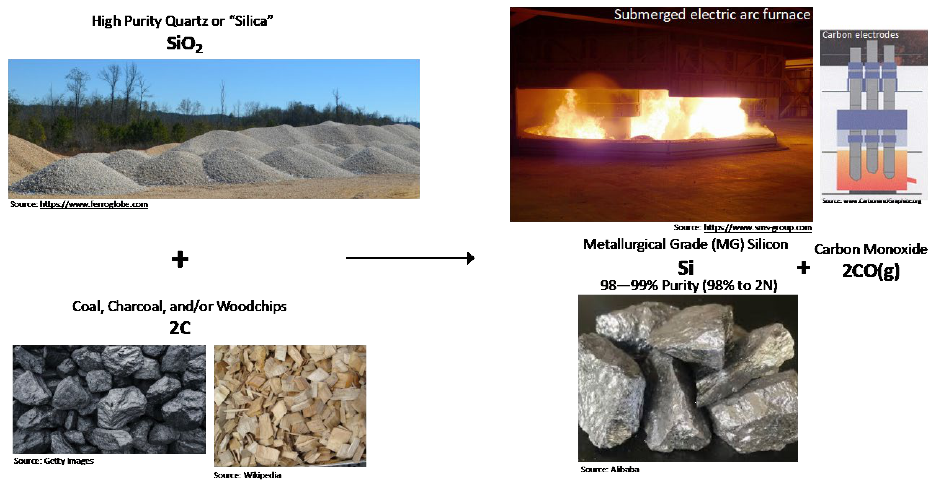
2.1.1 Metallurgical-Grade Silicon
2.1.1.1 Technology Overview
The silicon incorporated into c-Si modules initia lly comes f rom silicon dioxide (or silica ), the second most
abundant mineral in the Earth’s crust (Honsberg and Bowden 2019). Silica occurs naturally in the form of
quartz, but there are limitations on the type of quartz (and quartz mines) that can be used, due to the need for
high levels of purity. While some elements, such as aluminum and calcium, are easy to extract from silica,
other elements—such as iron, phosphorus, titanium, and boron—have deleterious effects on solar cell
performance and are very difficult to remove; therefore, manufacturers of m eta llurgica l-gra de silicon (MGS)
must be selective with the quartz they use. Sand, for example, is made of quartz but tends to have too many
impurities. There are typically two ways quartz is mined for silica:
1) Riverbeds often have quartz from broken mountain ranges. Quartz can be collected from such sites, but
there can be environmental considerations for active waterbeds due to the connection with water supply. This
type of mining is common in the United States, as are other dry excavation and mining approaches.
2) Quartz veins are often found and mined below ground. This can be a dangerous process as fine quartz dust
particles from mining can be lethal if inhaled. This type of quartz mining requires great care and typically also
leaves a big scar where the land was blasted.
While quartz is the main input to MGS refining, it is relatively inexpensive and represents less than 10% of the
cost. For this reason, companies do not typically explore for high-quality quartz mines, but rather find them
when looking for something more valuable, such as gold (gold is often associated with quartz). Therefore, the
amount of world reserves for quartz is unknown; however, there does not appear to be any shortage globally.
While quartz can be transported, sourcing quartz close to where it is needed minimizes shipping costs. China,
the leader in MGS production, does not have abundant resources of quartz. Conversely, Spain and Brazil have
the lowest-cost quartz. India has good quartz but high energy costs, making MGS production uneconomical.
In addition to quartz, low-ash coal and woodchips are necessary for producing MGS, and these are somewhat
specia lized ma teria ls. Low-ash coal can be found in the United States for domestic MGS production, but a
SOLAR PHOTOVOLTAIC S SUPPLY CHAI N DEEP DIVE ASSESSMENT
14
significant portion of international MGS production relies on low-ash coal from the Cerrejón mine in
Colombia. There are also key washing operations in the Netherlands, Spain, and Portugal. Charcoal may be a
substitute for Colom bia n coa l.
Figure 13 shows the principal input materials and process for MGS production. Quartz, or silicon dioxide, is
made into MGS by removing the oxygen using carbon (i.e., coal and woodchips), which produces the
byproduct carbon monoxide, which can later be processed into carbon dioxide. This process is very energy
intensive and requires the use of an electric arc furnace; 10–15 MWh of power are required for each ton of
MGS produced.
Many producers of MGS can also make ferrosilicon by adding in iron during the process. As most silicon
production is actually ferrosilicon production, capacity could be switched over, and even brownfield existing
sites could currently pick up any solar demand. Unless there are restrictions against particular production
locations (e.g., Xinjiang or China more broadly), MGS is not believed to be a bottleneck material.
Figure 13. Principal input materials and process for MGS production.
Source: NREL
MGS is used to make polysilicon for solar wafers and semiconductors, silicones, and aluminum alloys (Figure
14). While the process is in principle flexible, polysilicon producers oftentimes impose expectations of MGS
chemistry (impurity tracing) and size. To guarantee supply and purity levels, MGS manufacturers often
backwardly integrate, owning a significant portion of the mines in which they source quartz. Additionally,
because of the energy-intensive nature of the process, MGS processing typically occurs in locations with
abundant and cheap sources of electricity including the United States, Malaysia, Norway, and the Xinjiang
region of China. In 2021, the U.S. government determined that Hoshine Silicon’s MGS operation in Xinjiang
was benefiting from forced labor and imposed a Withhold Release Order (WRO) to prevent products
incorporating Hoshine’s MGS from being imported into the United States (see Section 3.2.3).
SOLAR PHOTOVOLTAIC S SUPPLY CHAI N DEEP DIVE ASSESSMENT
15
Figure 14. Global demand for MGS by application.
Sources: USGS, Sandia, CRU Group, BloombergNEF, ITRPV, NREL
The competing uses for MGS are silicones and aluminum alloys. Growth in demand for aluminum alloys is
difficult to determine currently. On the one hand, demand should increase due to population growth; however,
there could also be less demand for aluminum as recycling becomes more efficient globally.
Silicon demand from the sola r industry is a function of deployment targets and silicon utilization. Based upon
technology advancements outlined within the International Technology Roadmap for Photovoltaic (ITRPV),
the net MGS utilization is expected to drop from 3.4 g/W in 2020 to 2.1 g/W by 2030 (J Trube 2021).
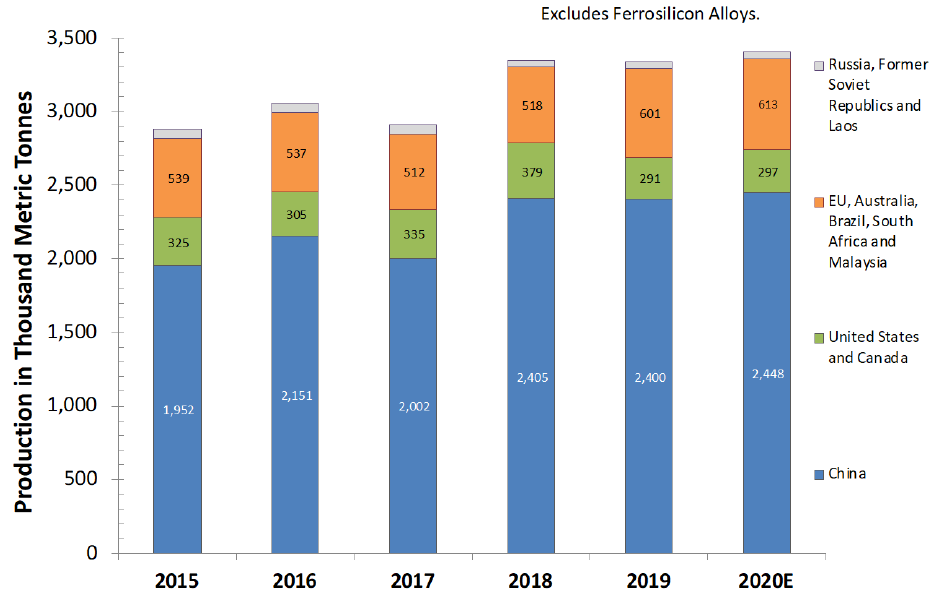
2.1.1.2 Industry Overview
There are currently about 15 countries with MGS capacity (Figure 15) (BGS 2021; USGS 2021b). These
include: China, Norway, Iceland, Brazil, the United States, France, Canada, Australia, Malaysia, Russia,
Kazakhstan, Bosnia and Herzegovina, Laos, and Thailand (U.S. International Trade Commission 2018). South
Africa had production facilities, but those recently closed. Production in Malaysia began in 2019 due to access
to a new hydropower hub. Location is limited to places with cheap and abundant electricity, access to quartz
(domestically or near a port), and access to buyers without prohibitive trade restrictions.
1,277
1,507
1,453 1,453 1,453 1,453
816
1,009
1,017
1,178
1,503
1,918
48
78
87
101
129
164
232
235
402
473
672
945
0
500
1,000
1,500
2,000
2,500
3,000
3,500
4,000
4,500
2013 2015 2017 2020E 2025E 2030E
Demand (kilitonnes)
Polysilicon for
Solar (High
Projected
Scenarios)
Polysilicon for
Solar (Historical)
Polysilicon for
(5% CAGR)
Silicones and
Silanes
(5% CAGR)
(0% CAGR)
Demand (kilotonnes/year)
SOLAR PHOTOVOLTAIC S SUPPLY CHAI N DEEP DIVE ASSESSMENT
16
Figure 15. Principal locations of MGS production.
Sources: USGS, British Geologica l Survey
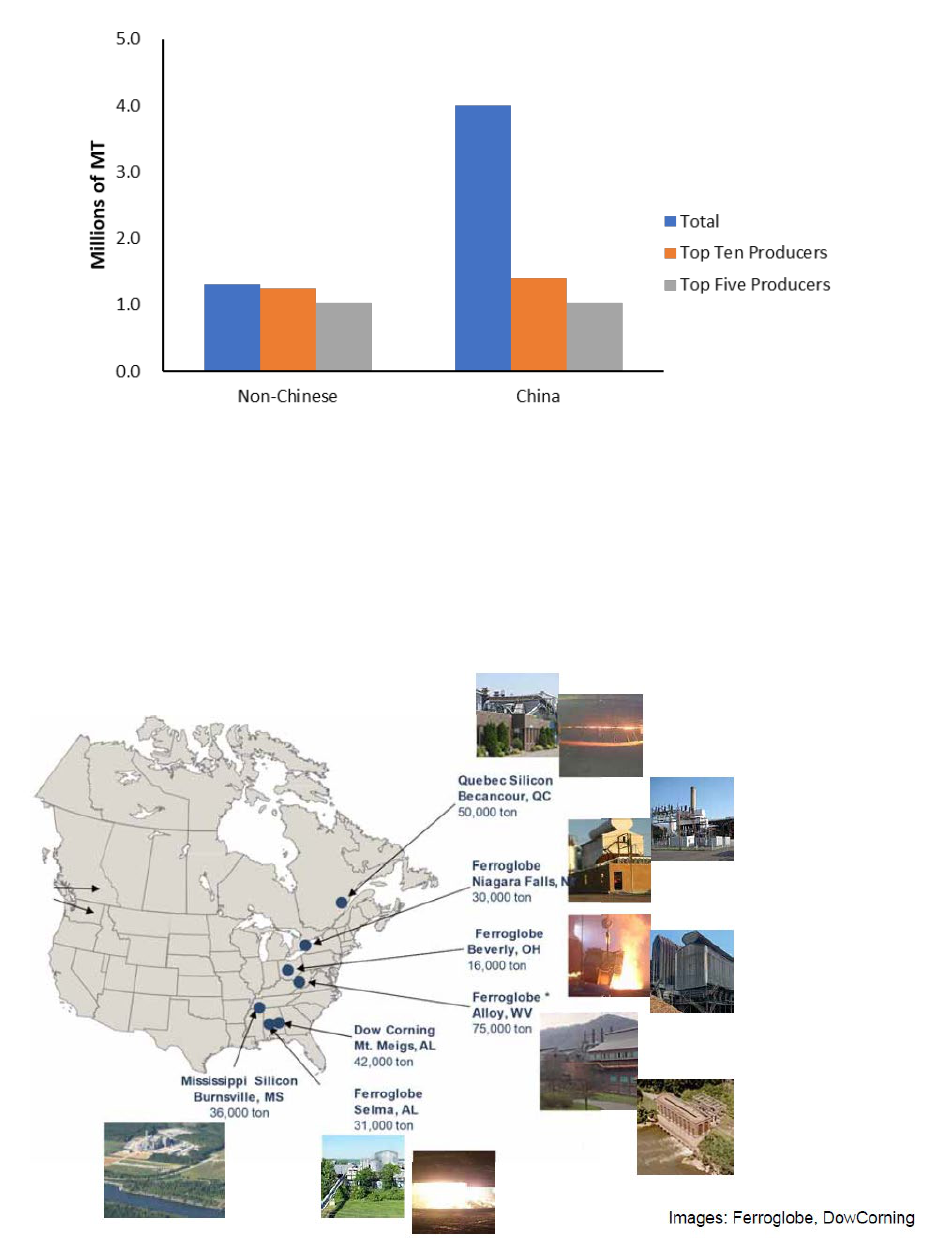
China currently has around 70% of global MGS production capacity and hundreds of companies of varying
size (USGS 2021b; BGS 2021). As of 2017, the top 10 Chinese producers owned approximately 35% of
domestic capacity and the top five approximately 25% (Normann 2018). Non-Chinese silicon manufacturers
are consolidated, with the top 10 manufacturers holding 96% of non-Chinese manufacturing capacity (Figure
16).
SOLAR PHOTOVOLTAIC S SUPPLY CHAI N DEEP DIVE ASSESSMENT
17
Figure 16. China and non-China MGS manufacturing capacity, 2017.
Source: (Normann 2018)
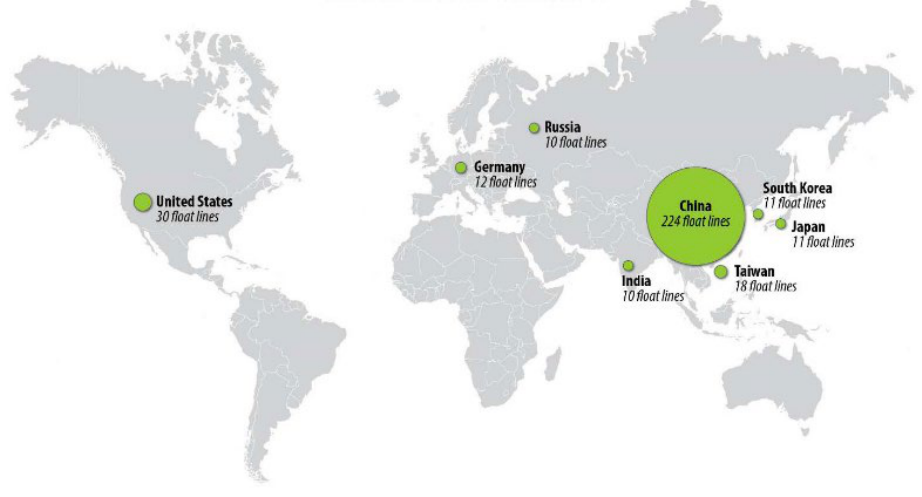
There are currently four companies with seven plants producing MGS in North America, as shown in Figure
17, but the Dow Corning plant has been shut down for some time. Many of the plants improve their
competitiveness and keep their greenhouse gas emissions low by sourcing inexpensive hydropower electricity
(even in coal-rich West Virginia ).
Figure 17. North American MGS plants.
SOLAR PHOTOVOLTAIC S SUPPLY CHAI N DEEP DIVE ASSESSMENT
18
Source: (Chalamala 2018)
2.1.2 Glass
2.1.2.1 Technology Overview
The fla t gla ss used for PV module assembly typically has low iron content for optimal transmissivity of
sunlight and is both tempered and anti-reflective coated. Silica sand is typically reported to be the primary
input material for solar-gra de gla ss (Heidari and Anctil 2021).
• The front glass typically used on crystalline silicon PV modules (also known as “coverglass”) is
typically 3.2-m m rolled gla ss, which is slightly dimpled on one side to improve encapsulant adhesion.
This glass is produced between two rollers, one of which is patterned.
• The front glass on thin-film PV m odules is typica lly 3.2-mm float glass produced on a float line, due to
the need for a highly flat surface to act as a superstrate or substrate.
Rea r gla ss for thin film or bifa cia l c-Si modules is typically 2.0-mm soda lime glass, since it does not need
high optical transmittance and is less expensive.
2.1.2.2 Industry Overview
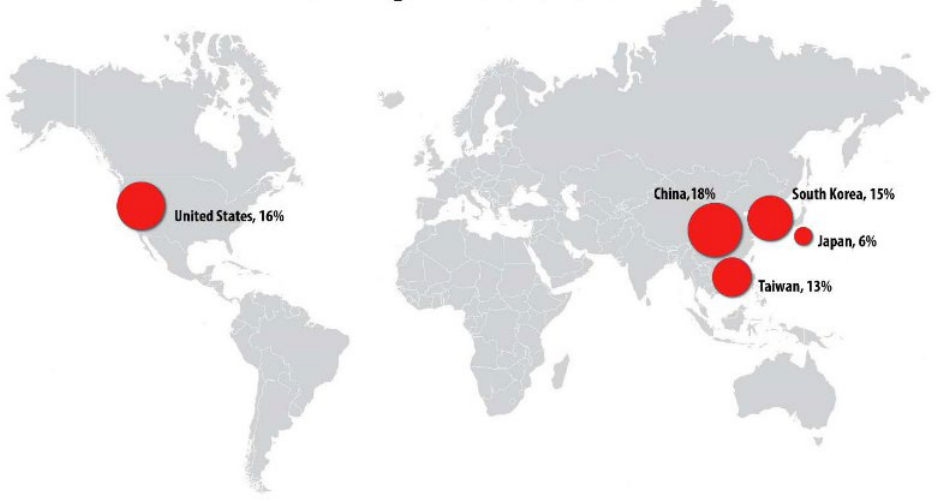
Float lines are most common in China and the United States as shown in Figure 18, but little detail is known
about the distribution of rolled glass production, aside from the fact that most PV coverglass is produced in
China. The United States currently does not have significant excess capacity to produce rolled glass, though
float glass lines may be able to be built in a relatively short time, as demonstrated by First Solar’s exclusive
gla ss line in Ohio.
Figure 18. Flat glass production by country and number of float lines, 2017.
Source: (B. Smith and Margolis 2019)
Float glass is generally reported to be more expensive than rolled glass, and larger facilities are necessary to
achieve the necessary economies of scale. A single float line would produce approximately 2 GW
dc
of
SOLAR PHOTOVOLTAIC S SUPPLY CHAI N DEEP DIVE ASSESSMENT
19
covergla ss per yea r and would require a capital investment of approximately $150 million. To produce the
low-iron pattern glass that is typically used as coverglass for c-Si PV, the float line would have to be slowed
down considerably, which worsens the economic performance of the float line. Because rolled gla ss has a
higher proportion of labor costs as compared to float gla ss, it is much cheaper when produced in areas with
low-wage labor, such as China.
2.1.3 Encapsulant
2.1.3.1 Technology Overview
In a PV module, front and back layers of encapsulant film form a protective barrier around the PV cells,
essentially laminating the cells. The predominant resins used to make encapsulant are ethylene vinyl acetate
(EVA), which is primarily used for monofacial PV modules, and polyolefin elastomers (POE), which is
primarily used for bifacial or thin-film modules. EVA is synthesized by polymerizing vinyl acetate monomers
and ethylene (B. Smith and Margolis 2019). Natural gas is the primary feedstock to produce both ethylene a nd
POE.
Typically, EVA or POE is produced by a petrochemical company in resin form and sold to a film extruder
which extrudes the resin into the film needed in the module assembly process. These two steps are typically
not vertically integrated, though some vertically integrated firms exist, such as Hanwha and Mitsui.
2.1.3.2 Industry Overview
Generally, resin is produced globally, but extrusion capabilities are concentrated in China (Figure 19). Some
Southeast Asian countries have encapsulant production established by Chinese corporations to support the
module industry in those countries. Similarly, encapsulant extrusion exists in India, but is often owned by
Chinese companies. Hangzhou First (or “First Applied Material”) is the largest global encapsulant producer,
though it also supplies backsheets. HIUV, Sveck, and Cybrid are also major encapsulant producers in China,
while Borea lis is a smaller producer in Austria.
The United States has significant capability to produce encapsulant resin, but extrusion capabilities are less
common. DOW Chemical is focused on POE resin for PV applications, though it produces EVA resin as well.
Na tural gas is the feedstock for both POE and ethylene, so low U.S. gas prices can be an advantage for U.S.
production.
SOLAR PHOTOVOLTAIC S SUPPLY CHAI N DEEP DIVE ASSESSMENT
20
Figure 19. Largest EVA-producing countries, 2017.
Source: (B. Smith and Margolis 2019)
2.1.4 Backsheets
2.1.4.1 Technology Overview
Backsheets are used in monofacial c-Si modules as the final back layer of the module, but some clear
backsheets are now starting to be used as the backing for bifacial c-Si m odules a s well. Backsheets are
intended to electrically insulate the module and protect it from moisture and wind da m age.
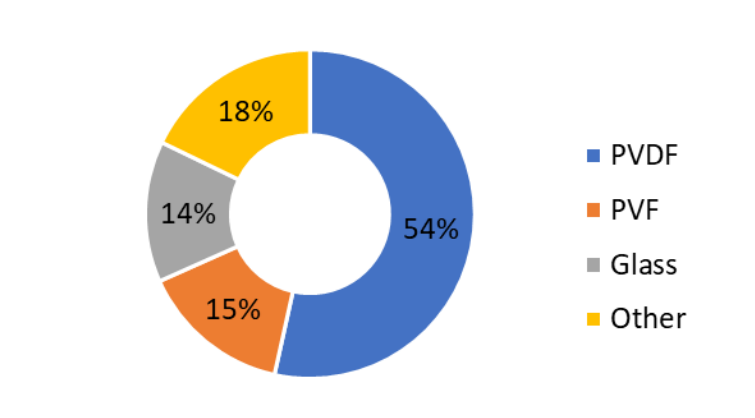
The materials used in backsheets vary significantly across the market (Figure 20). Almost all backsheets use
polyester (PET), typically in some combination with polyvinyl fluoride (PVF), polyvinylidene fluoride
(PVDF), polyethylene, or less commonly polyolefin or polypropylene (Chunduri and Schmela 2020).
Like encapsulants, backsheet materials are typically first produced as bulk resins and are then extruded into
films. Backsheets are typically made of three films laminated together: the inner layer (touching the
encapsulated cells), the core (middle) layer, and the outer layer which is exposed to air. The core layer is
typically PET, while the outer layer is frequently PVF or PVDF. Firms often operate as independent laminators
by purchasing films and laminating desired stacks together into backsheets.
SOLAR PHOTOVOLTAIC S SUPPLY CHAI N DEEP DIVE ASSESSMENT
21
Figure 20. Market share of backsheet materials, 2019.
Source: (Chunduri and Schmela 2020)
2.1.4.2 Industry Overview
PVDF-based backsheets are reported to dominate the backsheet market; Fumotech, ZTT, and Arkema are
major suppliers of PVDF resin. Some examples of vertical integration include ZTT in China, which produces
PVDF resin and consumes about 50% of its own resin to produce completed backsheets (Chunduri and
Schmela 2020).
Conversely, Cybrid was first known as a major backsheet supplier and now operates a PVDF
resin production facility. DuPont reports that all its PVF (Tedlar) production occurs in the United States, and
approximately 50% goes to PV backsheet applications. It supplies the extruded film to backsheet laminators.
Jinko and LONGi, two of the largest PV module producers, use PVF-based backsheets for most of their
products.
There are a few major PET suppliers, mostly located in China, though the DuPont-Asia PET supplier is loca ted
in Japan. DTF is a major supplier of the PET core layer for backsheets.
Very few backsheet laminators exist in the United States, but examples include Dunmore, Tomark Worthen,
and FLEXcon. Most laminators are located in China, with some appearing in India more recently.
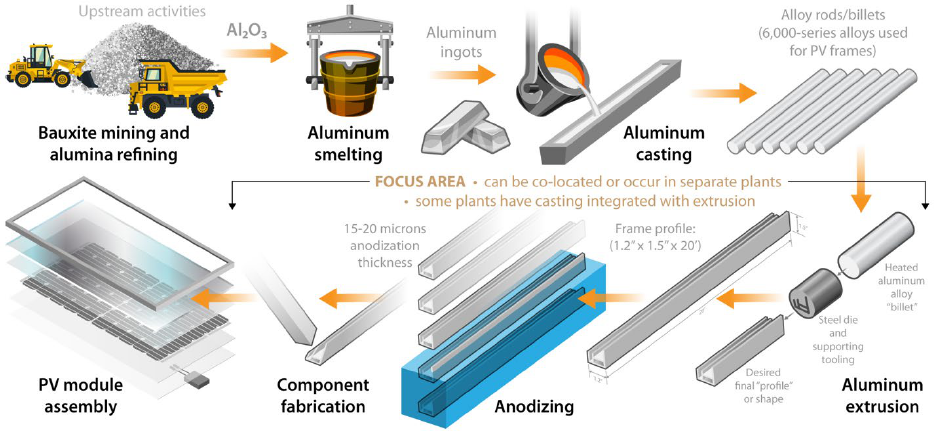
2.1.5 Aluminum Frames
2.1.5.1 Technology Overview
The aluminum used in PV module frames or PV system racking can either be sourced from primary extraction
(mining) or secondary extraction (recycled content). Module frames and aluminum racking (typically used for
residential systems) have similar production processes, which rely on extrusion and anodization or other
coatings (Figure 21).
SOLAR PHOTOVOLTAIC S SUPPLY CHAI N DEEP DIVE ASSESSMENT
22
Figure 21. Production process for aluminum module frames, assuming primary aluminum extraction.
Source: NREL
The raw input aluminum must be alloyed appropriately for its intended application. Alloying occurs during the
casting stage when smelted ingots are cast into billets. The most popular extrusion alloy class, which is
typically used in solar applications, is the 6000 series (Werner 2013). This alloy class is created by varying a
combination of magnesium and silicon, depending on the strength required by the end use of the extruded
aluminum profile. Once the desired alloy has been produced, it is extruded into the desired shape, then coated
and cut (fabricated) as needed.
The general structure of the aluminum extrusion industry encompasses production of the desired alloy,
extrusion into the desired shape, then coating or anodization, and finally fabricating or cutting as needed.
Extrusion, coating/anodization, and fabrication processes are often co-located but may occur in separate
facilities operated by different firms.
2.1.5.2 Industry Overview
Some countries subsidize aluminum, which would result in PV frames and racking at lower cost. Both
extrusion and anodizing use large amounts of water, for cooling as well as cleaning and rinsing. Stricter
regulations regarding water treatment will add to the cost of producing PV frames and racking. The United
States has significant capacity to produce aluminum for frames.
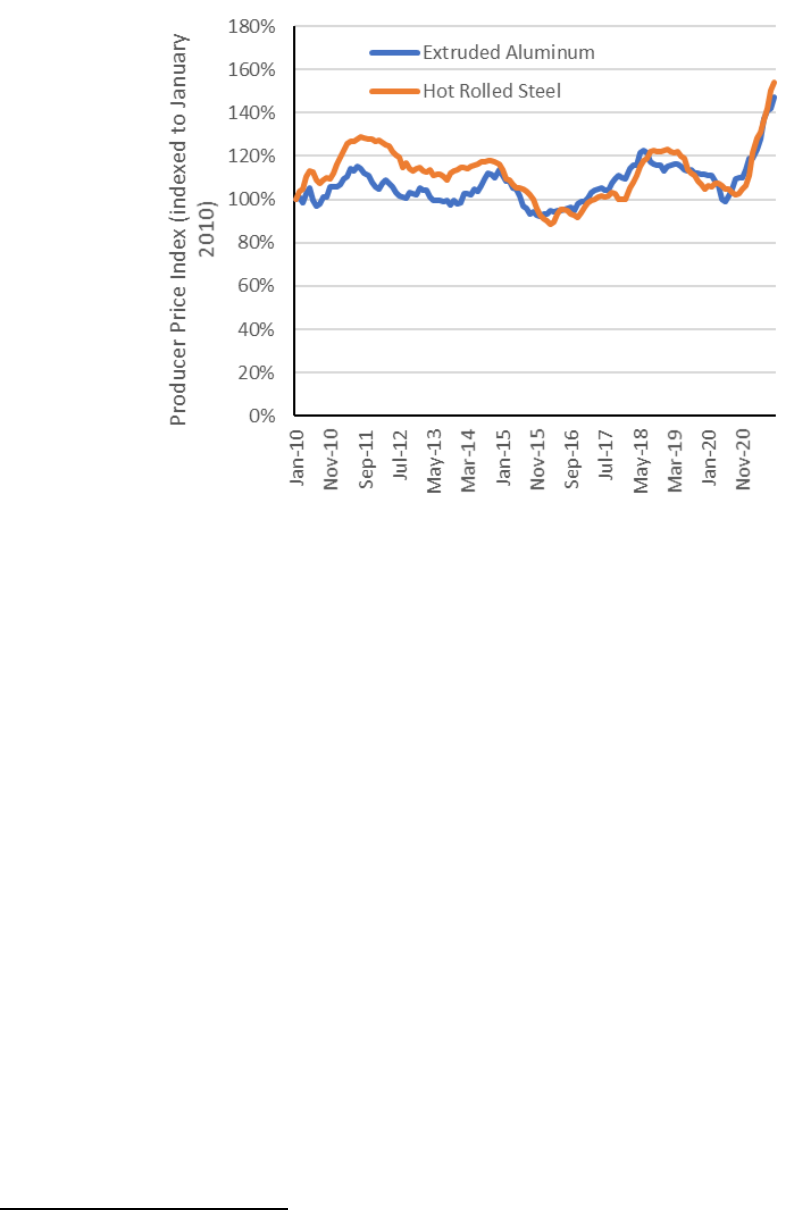
The prices of steel and aluminum in the United States rose in 2018 following the implementation of two tariffs
(see Section 3.2.2). A Section 301 tariff on Chinese solar products imported into the United States wa s placed
in spring and summer of 2018; and a Section 232 tariff on steel and aluminum imported to the United States
from various countries was imposed starting in the spring of 2018 (Figure 22). China produces more than half
the world’s aluminum and steel (U.S. Congressional Research Service 2021). The price increases subsided in
2019 with the exclusion of some countries from the Section 232 tariffs (U.S. Congressional Research Service
2021), but since the start of the coronavirus pandemic, supply-chain logistics combined with the tariffs, and
other import quotas, have caused domestic shortages in the United States and significant price increases.
SOLAR PHOTOVOLTAIC S SUPPLY CHAI N DEEP DIVE ASSESSMENT
23
Figure 22. Producer price index for extruded aluminum and hot rolled steel.
2
Source: (FRED n.d.)
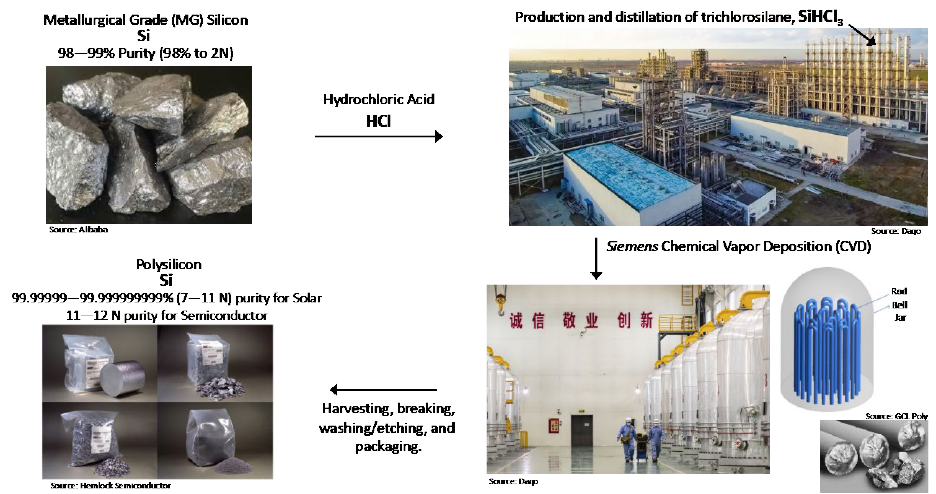
2.2 Polysilicon Refining
2.2.1 Technology Overview
Polysilicon is the high-purity product obtained by refining MGS. PV is the primary consumer of polysilicon
(greater than 80% of demand), and the other principal end use is for consumer electronics and semiconductors
(Figure 23). Whereas MGS is 99% pure (“2 nines” or 2N) silicon, polysilicon for PV typically has a purity of
8N–11N. Numerous variations in polysilicon production techniques exist, but the two general approaches with
the largest market shares are the Siemens chemical vapor deposition method (greater than 90% market share)
and the fluidized bed reactor (FBR) method (3%–5% market share). Figure 23 shows the steps to produce
polysilicon from MGS, based on the Siemens process.
The Siemens process generally entails passing a gaseous trichlorosilane (TCS) or silane precursor over heated
silicon filaments housed within bell-shaped reaction vessels, which deposits pure silicon onto the filaments.
Recovered compounds are recirculated and can be used to synthesize new precursors. The end results of this
process are U-shaped silicon rods, which are later broken into chunks and sealed in plastic bags with an inert
gas such as argon.
2
Steel includes: “Hot Rolled Steel Bars, Plates, and Structural Shapes.” Aluminum includes: “Extruded Aluminum Rod, Bar, and Other Extruded Shapes.”
SOLAR PHOTOVOLTAIC S SUPPLY CHAI N DEEP DIVE ASSESSMENT
24
Figure 23. Steps to produce polysilicon from MGS, Siemens chemical vapor deposition method.
Source: NREL
In the FBR process, a bed of silicon beads floats on the fluidizing gases silane and hydrogen, which flow
upward through an inverted cone-shaped reaction vessel. Through controlling the temperature differential
between the fluidized silicon beads and the reactor walls, silicon layers are deposited onto the beads. As beads
become heavy, they fall to the bottom of the cone for collection, ultimately yielding granular polysilicon. This
granulated form can facilitate subsequent steps in the c-Si PV manufacturing process. Compared with
polysilicon chunks from the Siemens process, the granules fill ingot crucibles more quickly and efficiently,
and they are better suited to continuous-Czochralski (Cz) ingot pulling, which can contribute toward PV
efficiency and cost advantages. The decision between polysilicon chunk vs. FBR beads must consider impurity
differences between the suppliers and the processing capabilities of the ingot production equipment.
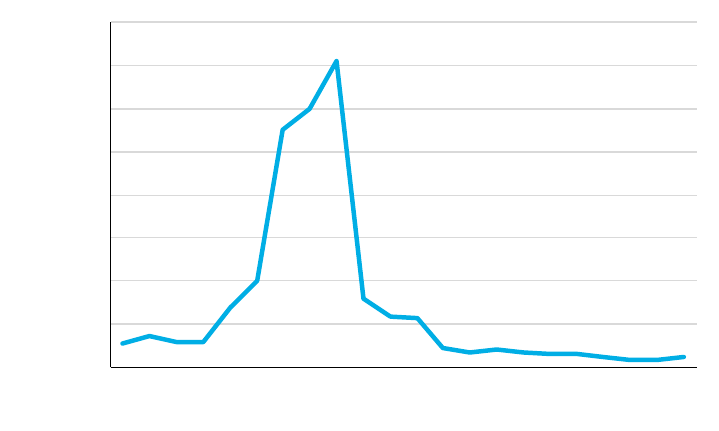
2.2.2 Industry Overview
Before 2005, the solar industry sourced most of its polysilicon supply via scrap from the semiconductor
industry. As demand for PV grew rapidly, in large part due to the German feed-in tariff beginning in 2004,
there was a shortage of polysilicon, which significantly increased its price (Figure 24).
SOLAR PHOTOVOLTAIC S SUPPLY CHAI N DEEP DIVE ASSESSMENT
25
Figure 24. Polysilicon prices.
Source: (BloombergNEF 2021b)
Polysilicon production requires large capital investments to build a plant, large corporate investment to learn
and refine the production process, highly skilled labor to operate the plant, and low electricity costs due to the
large amount of energy needed to produce polysilicon. These requirements limit the geographical locations
suitable for polysilicon production.
Virtually all polysilicon production capacity is located in 10 countries, with China having 72% of total global
capacity (Figure 25) (BloombergNEF 2021f). With greater than 96% of ingot capacity, virtually all buyers of
sola r-grade silicon are located in China.
Polysilicon prices increased threefold from $6.27/kg in June 2020 to $28.46/kg in June 2021 (BloombergNEF
2021a). The price increase has been attributed to a supply/demand imbalance caused by significant capacity
expansion in wafer and cell manufacturing. Now that polysilicon is the limiting factor, downstream entities
(wafer and cell producers) have been stockpiling polysilicon supplies in anticipation of growing demand,
especia lly a ra m p-up in utility-scale deployment in China. Although new polysilicon capacity came online in
early 2021, shortages are expected to persist in the short term until polysilicon capacity expansions come
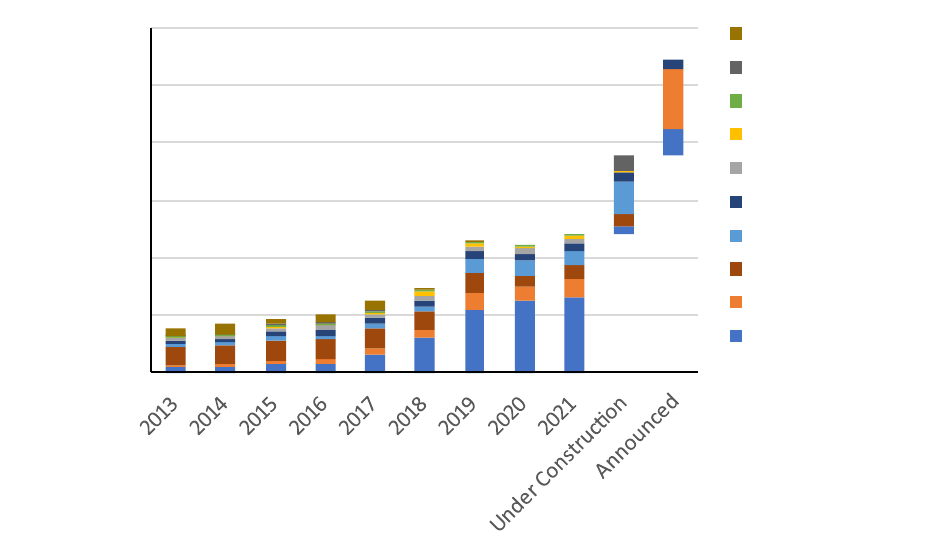
online in 2022–2023. Based upon projects that have been announced or are under construction, polysilicon
manufacturing is expected to double in capacity, with most of the new plants located in China.
Many of the new plants built in the past two years have manufacturing capacities of 30,000-70,000 metric
tonnes (MT) of polysilicon per year, and there have been announcements for plans to build plants with
capacities greater than 100,000 MT (BloombergNEF 2021f).
$0
$50
$100
$150
$200
$250
$300
$350
$400
2000
2001
2002
2003
2004
2005
2006
2007
2008
2009
2010
2011
2012
2013
2014
2015
2016
2017
2018
2019
2020
2021
Polysilicon Spot Prices ($/kg)
SOLAR PHOTOVOLTAIC S SUPPLY CHAI N DEEP DIVE ASSESSMENT
26
Figure 25. Global polysilicon annual manufacturing capacity.
Source: (BloombergNEF 2021f)
Before 2017, most of the polysilicon manufacturing was located in Jiangsu, the leading province for other solar
manufacturing steps. Since then, Chinese companies have strived to continue lowering the price of polysilicon
by locating manufacturing in regions with cheaper land, electricity, and labor. There has been considerable
build-out of polysilicon in the western provinces of Inner Mongolia, Sichuan, Quinghai, and in particular,
Xinjiang. Xinjiang currently hosts 54% of Chinese polysilicon manufacturing and 39% of global
manufacturing (Figure 26). Based upon projects that have been announced or are under construction,
polysilicon manufacturing is expected to increase considerably in Inner Mongolia, Sichuan, and to a lesser
extent Xinjiang.
0
200
400
600
800
1,000
1,200
1,400
Manufacturing Capacity (kilotonnes)
Other
Korea (Republic)
Japan
Malaysia
United States
China
SOLAR PHOTOVOLTAIC S SUPPLY CHAI N DEEP DIVE ASSESSMENT
27
Figure 26. Polysilicon annual manufacturing capacity by Chinese province.
Source: (BloombergNEF 2021f)
Outside of China, Germany and the United States have the largest polysilicon manufacturing capacity (Figure
25). Plants outside China are typically smaller in size, with the largest plants having capacities between
20,000-40,000 MT (BloombergNEF 2021f). The principal advantage of U.S. and German polysilicon firms has
been their ability to deliver semiconductor-quality (11N and greater) material.
South Korea also benefited from the proximity to China and historically had significant polysilicon
manufacturing capacity. As polysilicon prices declined from 2010 to 2020, most polysilicon production in
South Korea waned due to low margins within the industry, and the inability to get the same low electricity
tariffs as those found in Western China (Bernreuter n.d.). Malaysia, on the other hand, grew its manufacturing
capacity with the help of low electricity prices from abundant natural gas and new hydroelectric facilities. The
South Korean company OCI, which was in the process of ramping down its South Korean operations, has been
a critical technology partner for establishing polysilicon production in Malaysia. A small amount of
manufacturing capacity has been announced in Saudi Arabia and Iceland.
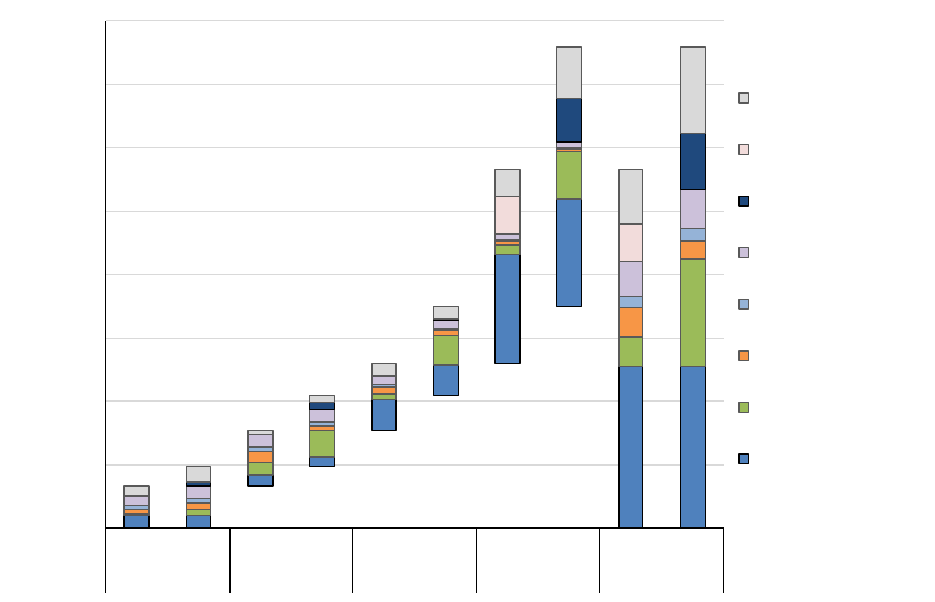
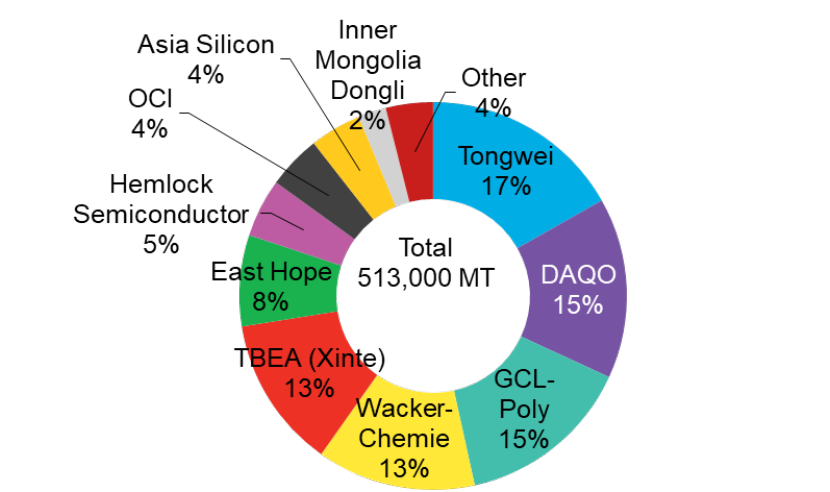
Ten manufacturers produced 96% of global solar polysilicon in 2020 (Figure 27). Until 2005, the vast majority
of polysilicon was produced by seven German, U.S., and Japanese firms with operations in those three
countries. Italy also produced polysilicon for the semiconductor industry. After 2005, with the rapid growth in
demand for polysilicon from the solar industry, other companies began to gain significant market share. OCI, a
South Korean chemical company, began developing its own polysilicon production process in 2000
(Bernreuter n.d.). OCI, as well as some Chinese companies, grew with the help of the polysilicon shortage
from 2006-2008 as well as proximity to the growing demand for polysilicon wafer producers in China.
0
200
400
600
800
1,000
1,200
Manufacturing Capacity (kilotonnes)
Other
Yunnan
Henan
Qinghai
Sichuan
Jiangsu
Inner Mongolia
Xinjiang
SOLAR PHOTOVOLTAIC S SUPPLY CHAI N DEEP DIVE ASSESSMENT
28
In 2020, the top 10 manufacturers consisted of seven Chinese companies, one German company (Wacker –
which has plants in Germany and the United States), one U.S. and Japanese company (Dow and Shin-Etsu
Handotai collectively owning Hemlock – which is headquartered and has plants in the United States), and one
South Korean company (OCI – which has a solar-grade plant in Malaysia and an electronic-gra de polysilicon
plant in South Korea ).
Tongwei, Daqo, and Xinte, three of the five leading producers of polysilicon, benefit from long-term contracts
with the largest wafer manufacturer in the world, LONGi, which produced 34% of global wafers in 2020
(BloombergNEF 2021e). Tongwei also benefits from being a leading supplier of cells and modules. GCL, the
third largest producer of polysilicon, also benefits from being the third largest producer of PV wafers.
Wacker has been helped by a German trade agreement with China, which made imports from the German
plants exempt from punitive import duties that are applied to U.S. and South Korean producers (see Section
3.3). Dow and Shin-Etsu Handotai (owners of Hemlock) are vertically integrated upstream, producing MGS.
Figure 27. Polysilicon production, by manufacturer, 2020.
Source: (BloombergNEF 2021e)
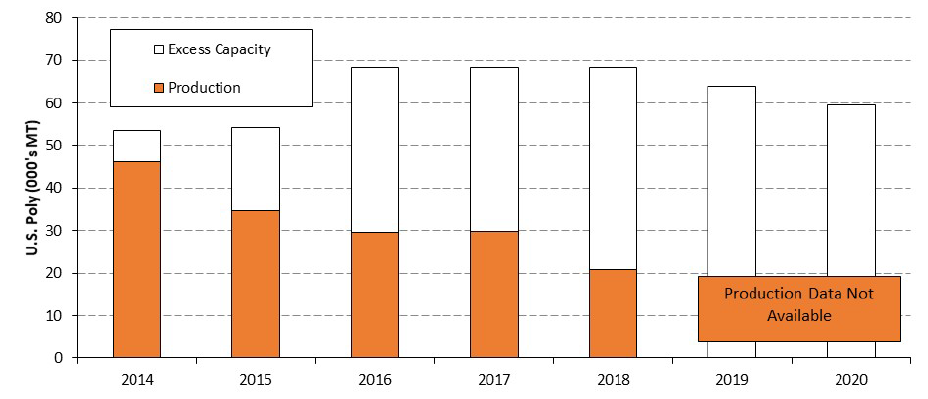
Four polysilicon companies operate in the United States: Hemlock, with 35,000 MT of annual production
capacity in Michigan; Wacker, with 20,000 MT in Tennessee; REC Silicon, with 4,000 MT in Montana, and a
16,000 MT plant in Washington, which shuttered in 2018; and Mitsubishi, with 1,500 MT in Alabama
(BloombergNEF 2021f). Hemlock, Wacker, and REC were awarded manufacturing tax credits under Section
48C and subsequently expanded capacity (obamawhitehouse.archives.gov, n.d.). U.S. plants are operating
significantly under capacity since Chinese duties (see Section 3.3) were placed on U.S. polysilicon in 2014
(Figure 28). Some production is being sold to the semiconductor industry.
SOLAR PHOTOVOLTAIC S SUPPLY CHAI N DEEP DIVE ASSESSMENT
29
Figure 28. U.S. polysilicon production and excess manufacturing capacity.
Source: (Wood Mackenzie & SEIA 2021)
2.3 Ingots/Wafers
2.3.1 Technology Overview
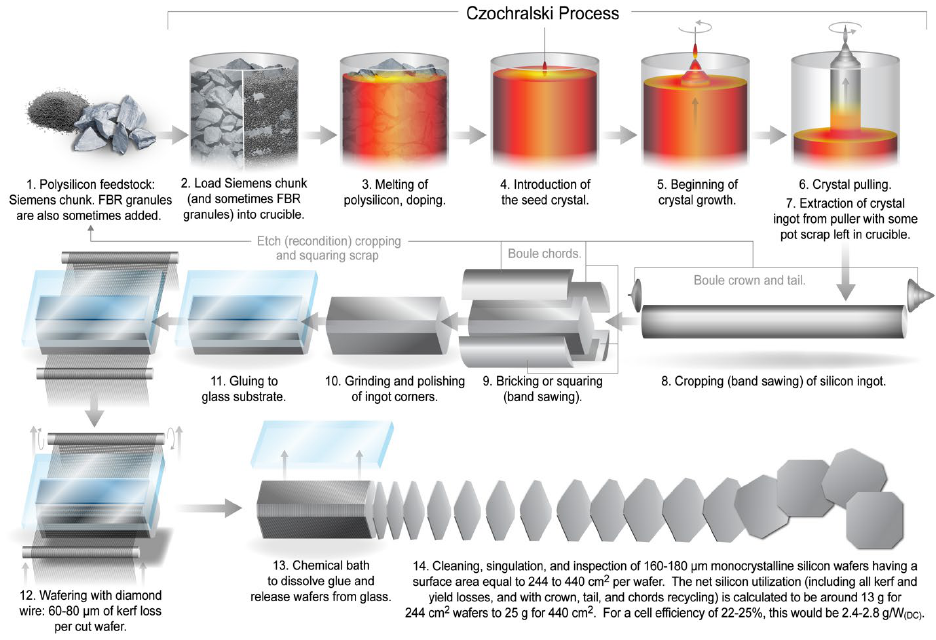
The two primary methods for manufacturing PV wafers from polysilicon feedstock are the continuous-
Czochralski (Cz) process for monocrystalline wafers (Figure 29) and the directional solidification (DS) process
for m ulticrysta lline wa fers (Figure 30). Both approaches involve melting the polysilicon at 1410°C in a
crucible designed to minimize contamination, then solidifying the melt to grow a rectangular-block ingot
comprised of centimeter-sized crysta ls (DS) or a single-crysta l cylindrica l ingot (Cz).
A typical cylindrical monocrystalline ingot in 2010 was around 140 kg in size and led to cropped (squared)
ingots that were 1.5–2.0 m long, with a flat-edge width of 156 mm and a cross-sectional area standardized to
237 cm
2
. After accounting for wafer thickness, kerf (silicon sawdust generated when slicing the ingot into
wafers) and yield losses, and cell efficiencies around 16.5%, the net silicon utilization was around 7–8 g/W at
that time. By 2020, industry-typical ingot mass had increased to 400–450 kg, and ingots larger than 800 kg had
been demonstrated at pilot scale. Two separate movements for wafer size standardization also began in 2020,
to either the M10 size (182 x 182 pseudo-square with a diagonal of 260 mm) or the G12 size (210 x 210 full
square with a diagonal of 297 mm). These larger sizes are following the development of 300 mm Cz ingots for
the semiconductor industry. Solar and semiconductor ingot capabilities now range from 200 mm diameter
ingots around 5.5 m in length (400–450 kg) to 300 mm diameter ingots greater than 5 m in length at pilot scale
(800 kg). About 4 days are required to produce a Cz ingot at the typical growth rate of 1 mm per minute.
SOLAR PHOTOVOLTAIC S SUPPLY CHAI N DEEP DIVE ASSESSMENT
30
Figure 29. Process flow for making monocrystalline-silicon wafers via Cz crystal growth.
Source: NREL
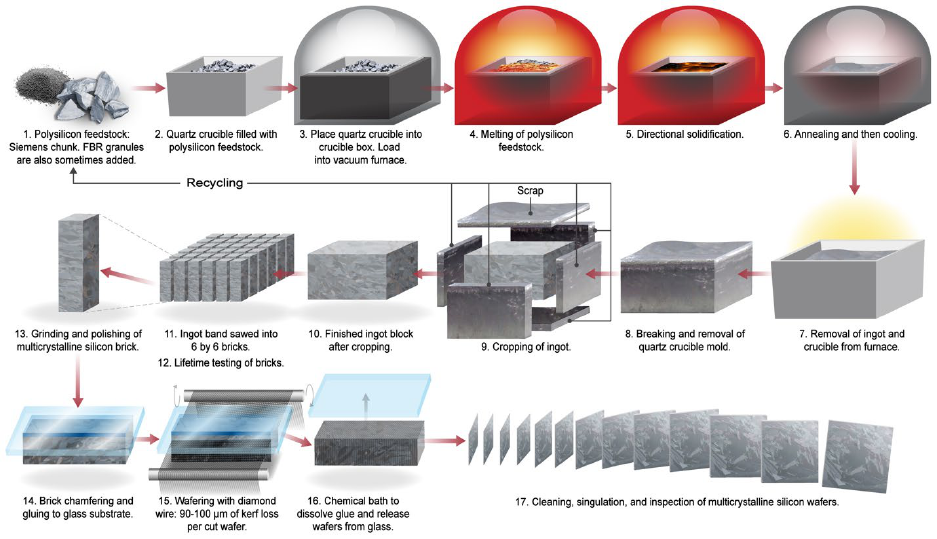
The DS process produces shorter but much wider rectangular-block ingots. After the polysilicon is melted, the
bottom surface of the crucible is cooled at a certain rate to create a temperature gradient that induces the DS
process. As in the Cz process, sections of DS ingots produced during cropping and squaring can be remelted
for later ingot generations, except for the contaminant-heavy topmost section. The square ingots are easily
sawn into square wafers that enable cells to occupy essentially the entire PV module area. About 3 days are
required to produce a typical multicrystalline silicon ingot including melting, DS, and cool down.
Whether formed by DS or Cz, the resulting ingot must be sliced into thin wafers, typically 180 micrometers
thick. Diamond-coated wires are typically used that wrap around the ingot many times and cut all of the wafers
in parallel, simultaneously. About one-third of the ingot is wasted as sawdust in the sawing process.
SOLAR PHOTOVOLTAIC S SUPPLY CHAI N DEEP DIVE ASSESSMENT
31
Figure 30. Process flow for making multicrystalline-silicon wafers via directional solidification (DS).
Source: NREL
2.3.2 Industry Overview
Beginning with polysilicon melting, producing ingots requires a lot of energy. The ingot production process
alone requires greater than 70% of the total energy to produce a wafer. Therefore, it is advantageous to site
ingot production near large, inexpensive sources of energy, and global ingot capacity reflects these trends.
Because wafers are cheap to transport, it is not necessary to locate these facilities near cell manufacturing
plants (though this often occurs). Ingot growth and wafer sawing benefit heavily from economies of scale.
Therefore, it is advantageous to site an ingot/wafer plant in a location with cheap electricity, low la bor ra tes,
large industrial scale, and access to abundant sources of polysilicon.
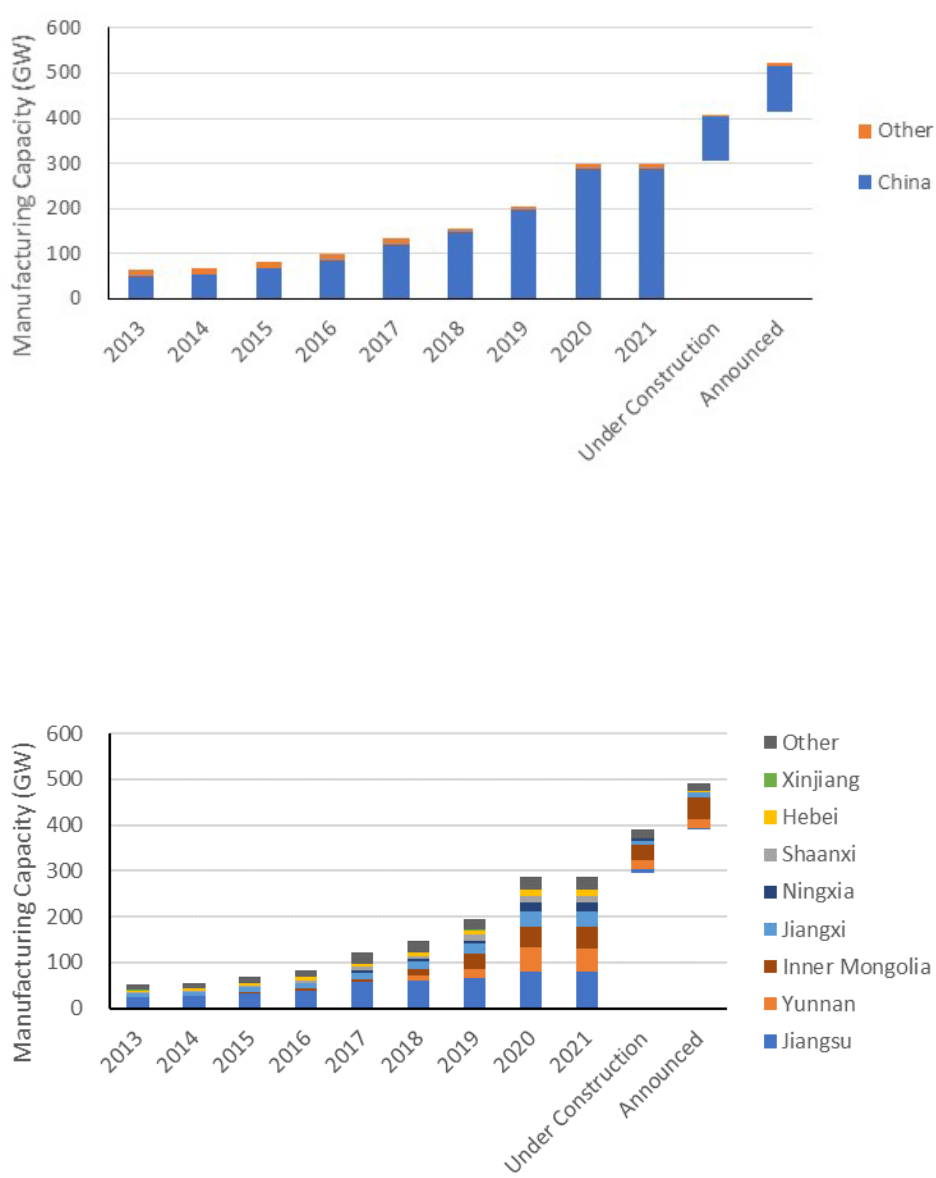
Virtually all ingot and wafer manufacturing is located in China (Figure 31) and half of global capacity located
in just eight plants (BloombergNEF 2021f). Many of the new plants built in the past two years have
manufacturing capacities of 20-50 GW
dc
per yea r. This concentration of ingot and wafer capacity was a direct
result of intensive Chinese government support for expansion of this sector over the period 2000 – 2010,
during which an estimated $50 billion was invested in Chinese solar production facilities.
SOLAR PHOTOVOLTAIC S SUPPLY CHAI N DEEP DIVE ASSESSMENT
32
Figure 31. Wafer manufacturing capacity in China vs. other locations.
Source: (BloombergNEF 2021f)
There is no dominant province or region within China for ingot and wafer manufacturing. Seven Chinese
provinces have over 10 GW
dc
of wafer manufacturing capacity (Figure 32). Some are in the western provinces,
but Jiangsu, with 28% of Chinese wafer capacity, is just north of Shanghai. It is also a domestic hub of cell and
module manufacturing.
Figure 32. Wafer manufacturing capacity by Chinese province.
Source: (BloombergNEF 2021f)
SOLAR PHOTOVOLTAIC S SUPPLY CHAI N DEEP DIVE ASSESSMENT
33
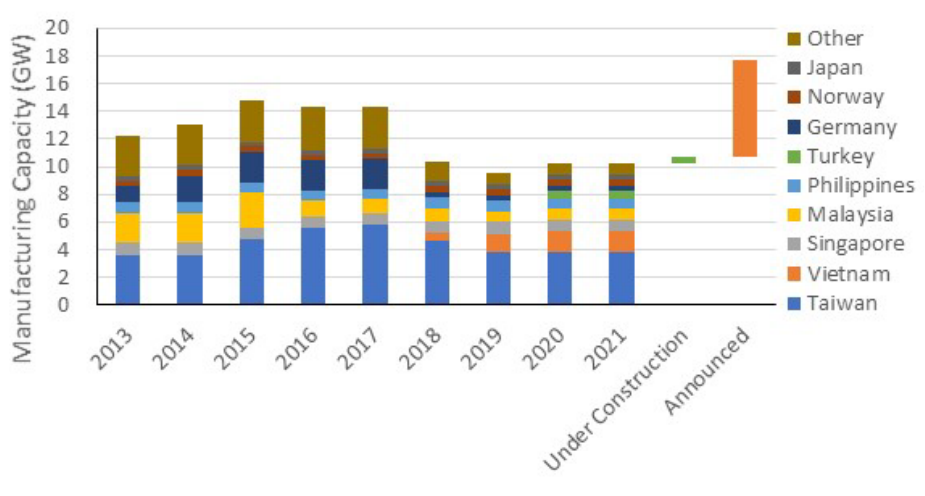
Outside of China, there is only 10 GW
dc
of wafer manufacturing capacity, mostly in East Asia (Figure 33). The
Chinese company Jinko Solar recently announced it would build a 7 GW
dc
ingot and wafer facility in Vietnam
to service its cell and module factory in Malaysia and its module assembly in the United States. The company
stated that it had made plans to build the factory in 2020, before the current U.S. trade restrictions on material
from Hoshine Silicon (Bellini 2021a).
Figure 33. Wafer manufacturing capacity outside of China.
Source: (BloombergNEF 2021f)
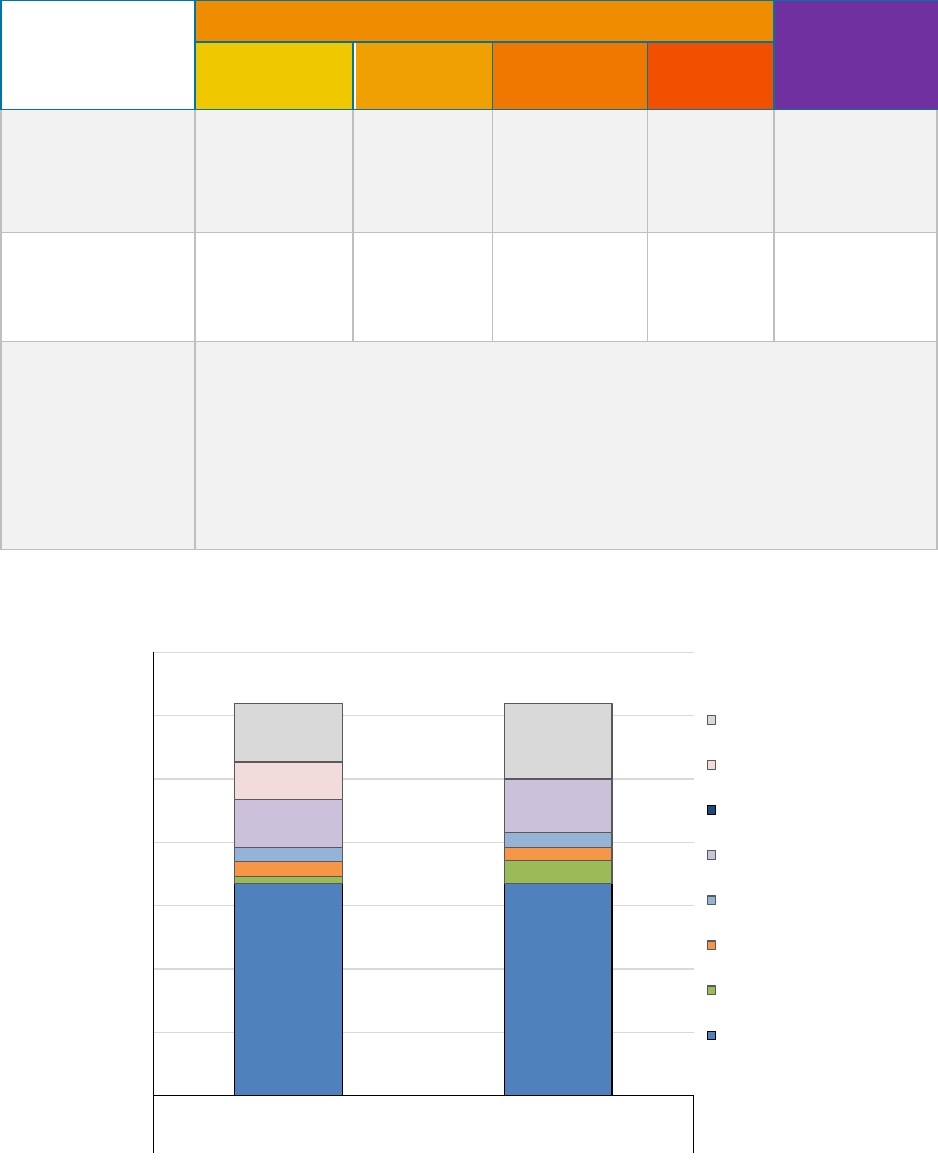
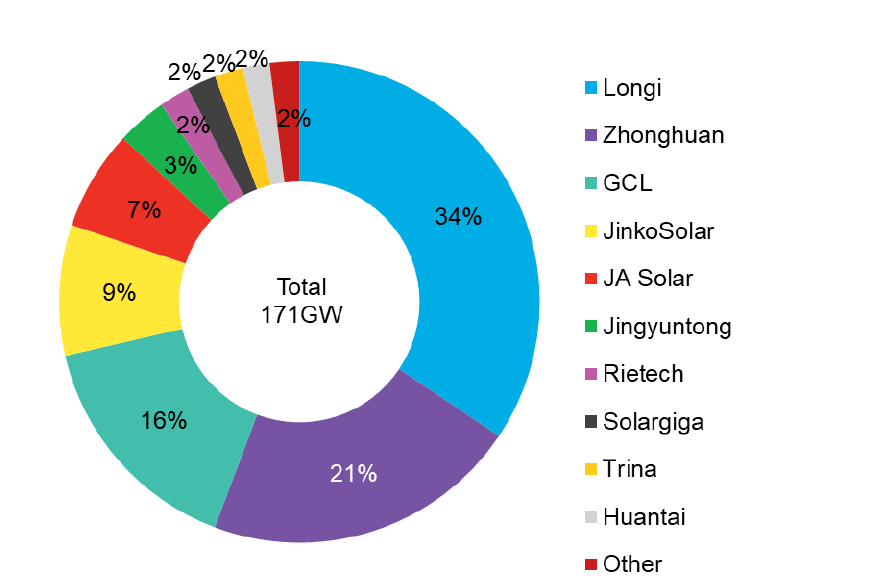
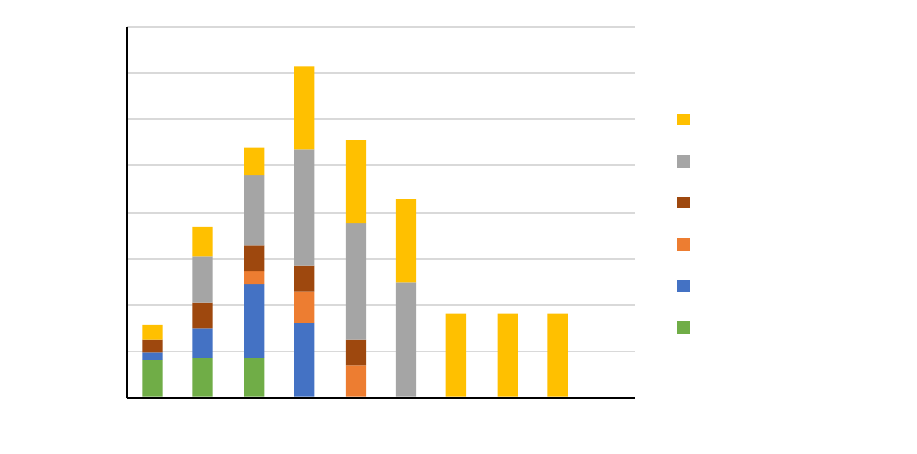
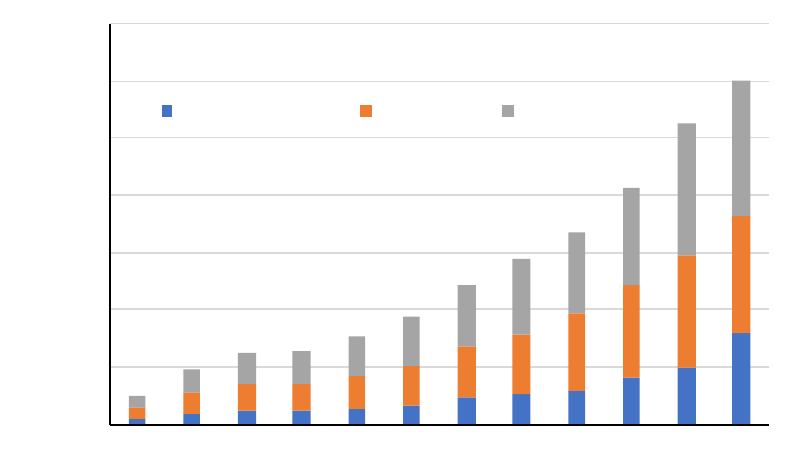
Ten Chinese manufacturers produced 98% of global solar wafers in 2020, with three companies (LONGi,
Zhonghuan, and GCL) producing 71% (BloombergNEF 2021e). From 2016 to 2020, these three companies
grew their collective manufacturing capacity from 29 GW
dc
(29% of global capacity) to 173 GW
dc
(58% of
global capacity) (Figure 34). The large growth from these companies followed the rapid growth in market
share of monocrystalline PV modules.
SOLAR PHOTOVOLTAIC S SUPPLY CHAI N DEEP DIVE ASSESSMENT
34
Figure 34. Wafer manufacturing capacity by company, 2020.
Source: (BloombergNEF 2021e)
By 2010, the United States had built its wafer manufacturing capacity to over 700 MW
dc
, able to supply over
80% of domestic installations that year (Figure 35). The fa cilities were typica lly pa rt of a fully integra ted
manufacturing process, from wafers to modules (though at one point MEMC, which bought SunEdison, was
only making wafers, with synergies to its polysilicon production). But these facilities could not compete on
cost with Chinese wafers, which benefitted from 50 times greater scale. By 2016, all U.S. wafer production
had stopped, and many of these companies had gone out of business.
SOLAR PHOTOVOLTAIC S SUPPLY CHAI N DEEP DIVE ASSESSMENT
35
Figure 35. U.S. wafer manufacturing capacity.
Sources: (Wood Mackenzie Power & Renewables 2018; Wood Mackenzie & SEIA 2021)
The company 1366 Technologies received a $150 million loan guarantee from the U.S. Department of Energy
in 2011 to build a novel wafer manufacturing facility that would avoid the step of slicing ingots to make
wafers by casting wafers directly (U.S. Department of Energy n.d.). The “direct wafer” process was designed
to require less silicon use, save time and money, and better compete with Chinese wafer manufacturers through
automation over cheaper labor. 1366, however, never constructed a commercial sca le wa fer fa cility in the
United States, instead forming a partnership with South Korean company Hanwha Q Cells to establish pilot
production in Malaysia (Bellini 2019). In 2021, 1366 merged with Hunt Perovskite Technologies to form
CubicPV, with the aim of developing a novel perovskite-silicon tandem-cell technology.
2.4 Solar Cell Fabrication
2.4.1 Technology Overview
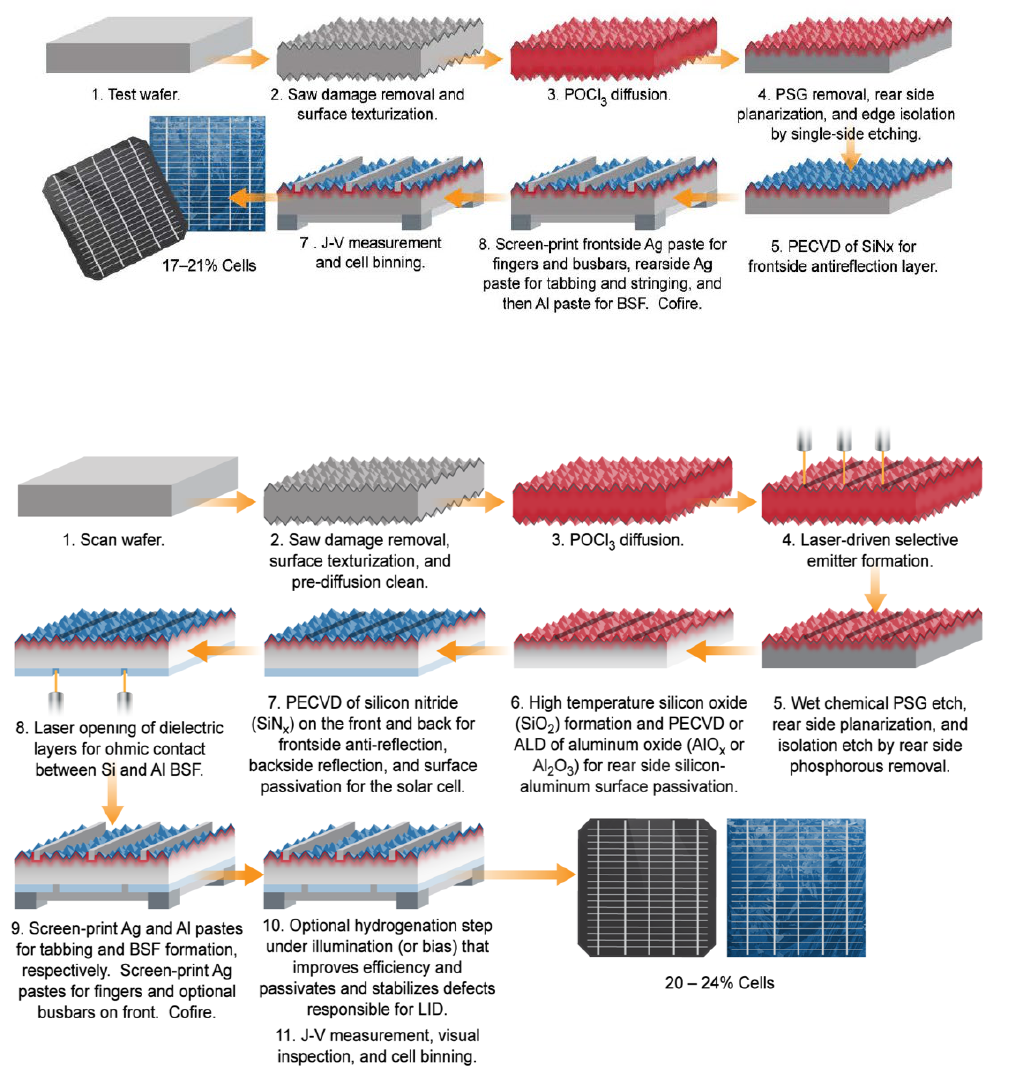
Wafers are converted into cells through a series of wet chemical treatments, high-temperature gaseous
diffusions, coating depositions, and metallization steps. The steps and the tools used vary based on cell
architecture. Figure 36 shows the process for the full-area aluminum back surface field (Al-BSF) cell structure
that was the dominant cell structure prior to 2018. Figure 37 shows the process for the passivated emitter and
rea r cell (PERC) structure, which—because of cell efficiency advantages over the standard Al-BSF
architecture—now dominates the market. The PERC process is like the Al-BSF process, with a few more
steps. Additional architectures designed to provide efficiency advantages over standard cells are also emerging.
Regardless of the architecture, inspections at the start of the manufacturing line and electrical testing at the end
of the line are used to identify cells that must be discarded. The tools and expertise needed to manufacture
standard and PERC cells at high volume with guaranteed efficiencies are widely available.
0
100
200
300
400
500
600
700
800
2007
2008 2009 2010 2011
2012 2013 2014 2015 2016
Manufacturing Capacity (MW)
SolarWorld USA
Sola r Power Indus tries
Sa nyo/Panasonic
BP Solar
SOLAR PHOTOVOLTAIC S SUPPLY CHAI N DEEP DIVE ASSESSMENT
36
Figure 36. Process flow for manufacturing standard full-area Al-BSF cells.
Source: NREL
Figure 37. Process flow for manufacturing standard full-area PERC cells.
Source: NREL
Silver is an important component in c-Si sola r cells, a s it is used in the form of screen-printable paste to make
electrical contact to the silicon material. In 2019, silver accounted for about 10% of cell cost (Bellini 2021b).
Silver can be mined as a principal product, extracted as a byproduct or coproduct at other metal extraction
operations, or recovered from secondary sources (USGS 2021a). For PV applications, silver is refined to high
SOLAR PHOTOVOLTAIC S SUPPLY CHAI N DEEP DIVE ASSESSMENT
37
purity levels, processed into a fine powder, and immersed in solvent to create a paste for screen-printing
applications (Yüce et al. 2019).
In 2019, the PV sector accounted for approximately 10% of global silver demand (Bellini 2021b). However,
the amount of silver used per cell has declined over time even as cells have become larger in area, dropping
from 521 milligrams per cell in 2009 to 111 milligrams per cell in 2019 (Marsh 2021). This trend is expected
to continue (Keen 2020).
2.4.2 Industry Overview
Sola r cell f a brication has become a very automated process and thus typically benefits from locations with a
sufficient labor pool of manufacturing engineers and machine laborers; government support of manufacturing
through cheap land, electricity, and tax breaks to incentivize companies with sufficient access to capital to
procure the equipment and land; and access to a supply chain of affordable machines.
While not always the case, cell manufacturing is often collocated with wafer and module manufacturing due to
synergies in the manufacturing process, procurement of equipment and land, taking advantage of captive
demand, and economies of scale. As of July 2021, approximately 27% of cell manufacturing capacity was
collocated with wafer capacity, and 61% was collocated with module capacity (Figure 38). Still, over 100
GW
dc
of cell manufacturing is sited alone.
Figure 38. Co-location of cell manufacturing with wafer and module manufacturing.
Source: (BloombergNEF 2021f)
Over 80% of cell manufacturing is located in China and based upon factories that have been announced or are
under construction, this percentage will likely increase, with cell manufacturing signif ica ntly increa sing from
300 GW
dc
to over 500 GW
dc
. Cell manufacturing plant size continues to increase, with most new plants with a
stated capacity above 5 GW
dc
, and now many over 20 GW
dc
(Figure 39). Looking forward, most of the plants
that are under construction or announced are 1– 20 GW
dc
in size.
0
50
100
150
200
250
300
350
2010 2011 2012 2013 2014 2015
2016 2017
2018 2019 2020 2021
PV Cell Manufacturing Capacity (GW)
Wafer
/Cel l /Module
Ce l l /Module
Individual
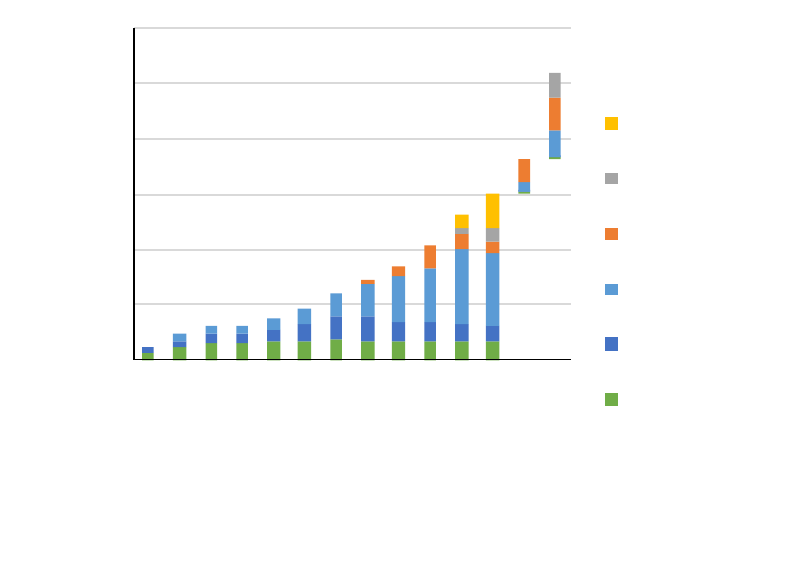
SOLAR PHOTOVOLTAIC S SUPPLY CHAI N DEEP DIVE ASSESSMENT
38
Figure 39. Cell manufacturing capacity by plant size.
Source: (BloombergNEF 2021f)
Jiangsu currently hosts 41% of Chinese cell manufacturing and 33% of global manufacturing, and is home to
large amounts of polysilicon, wafer, and module manufacturing capacity. Despite this large market share, a
significant level of capacity is located outside of this region (Figure 40). Additiona lly, there is significa nt
module assembly capacity located around the globe, making the level of buyer or supplier power significantly
more difficult, and this section of the supply chain more diverse.
The two leading provinces, Jiangsu and Zhejiang, are both located on the coasts, making shipping
internationally easier. However, a relatively large amount of cell production is located elsewhere in China as
well. Because China has represented 30%-50% of global demand of PV modules, a significant portion of
production is shipped domestically.
0
100
200
300
400
500
600
2010
2011
2012
2013
2014
2015
2016
2017
2018
2019
2020
2021
Announced
Manufacturing Capacity (GW)
20 GW+
10 GW - 20 GW
5 GW - 10 GW
1 GW - 5 GW
500 MW - 1 GW
< 500 MW
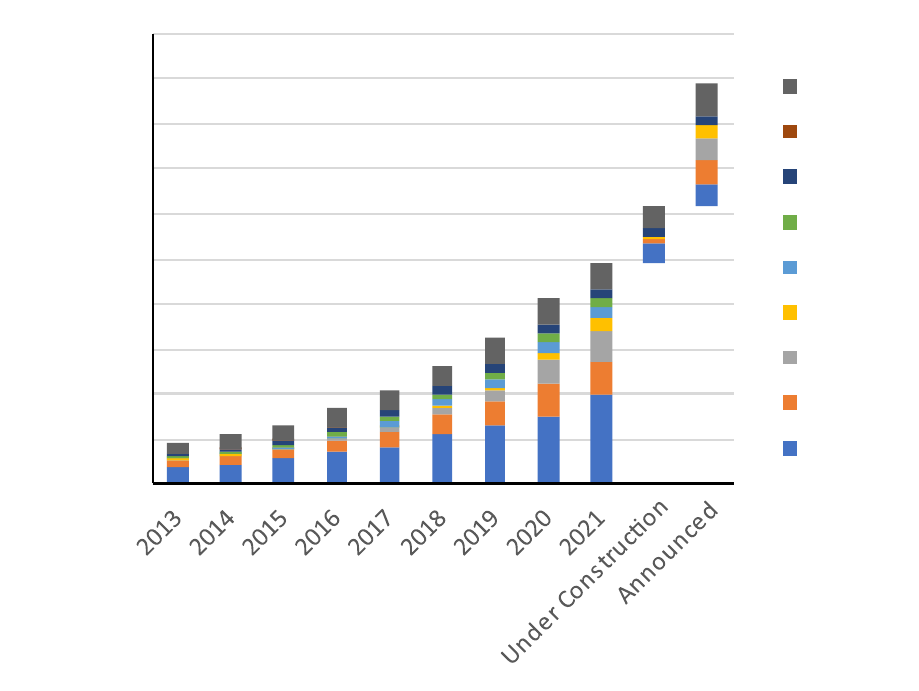
SOLAR PHOTOVOLTAIC S SUPPLY CHAI N DEEP DIVE ASSESSMENT
39
Figure 40. Cell manufacturing capacity by Chinese province.
Source: (BloombergNEF 2021f)
Outside of China, there is 50-60 GW
dc
of cell manufacturing capacity, mostly in East Asia (Figure 41).
Manufacturing capacity outside of China is expected to further grow, based on projects that have been
announced or are under construction, mostly in the leading non-Chinese countries of Vietnam and Malaysia.
Most of the leading non-Chinese cell manufacturing countries are located near China, likely making it easier,
cheaper, and faster to get wafers from China. Additionally, many of the manufacturing facilities in these
countries are owned by Chinese companies or have parent Chinese companies.
0
50
100
150
200
250
300
350
400
450
500
Manufacturing Capacity (GW)
Other
Xinjiang
Anhui
Hebei
Henan
Sichuan
Zhejiang
Jiangsu
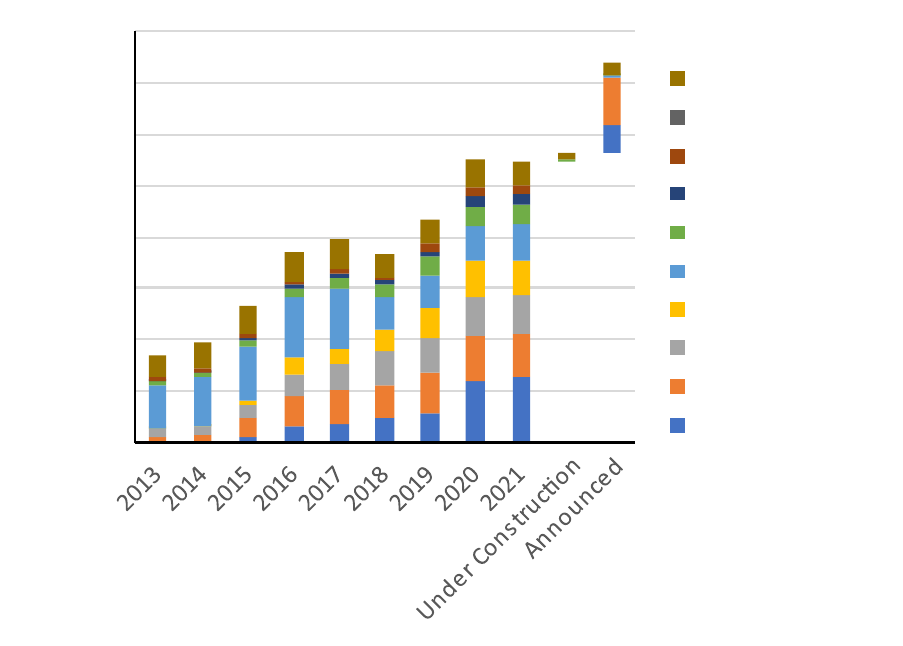
SOLAR PHOTOVOLTAIC S SUPPLY CHAI N DEEP DIVE ASSESSMENT
40
Figure 41. Cell manufacturing capacity outside of China.
Source: (BloombergNEF 2021f)
In 2020, 68% of cells produced came from the top 10 manufacturers, all but one of which (Hanwha Q Cells)
was Chinese (Figure 42). While this does represent market concentration, it is much less so than in
manufacturing steps before cells. The three leading suppliers, Tongwei, LONGi, and Aiko Solar, have
collectively grown their manufacturing capacities from 3 GW
dc
in 2015 to 71 GW
dc
in July 2021 (and up from
37 GW
dc
in 2019) (BloombergNEF 2021f).
0
10
20
30
40
50
60
70
80
Manufacturing Capacity (GW)
Other
Singapore
Tu rk e y
India
Taiwan
Thailand
Korea (Republic
)
Malaysia
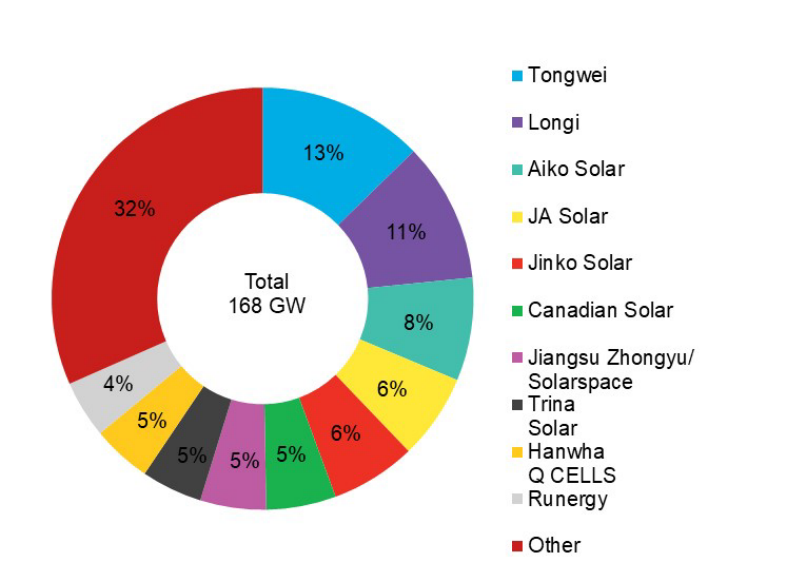
SOLAR PHOTOVOLTAIC S SUPPLY CHAI N DEEP DIVE ASSESSMENT
41
Figure 42. Cell production by manufacturer, 2020.
Source: (BloombergNEF 2021e)
There is significant vertical integration for cell manufacturers. Of the companies with 300 GW
dc
of
manufacturing capacity, these companies also owned 169 GW
dc
of wafer and 332 GW
dc
of module capacity.
41% of the cell manufacturing capacity is from a company with wafer, cell, and module capacity, and 81% is
from a company with cell and module capacity (BloombergNEF 2021f). Figure 43 provides the wafer, cell,
and module manufacturing capacities of some of the leading cell and module manufacturers. While some only
focus on one piece of the value chain, many of them have significant investment in all three.
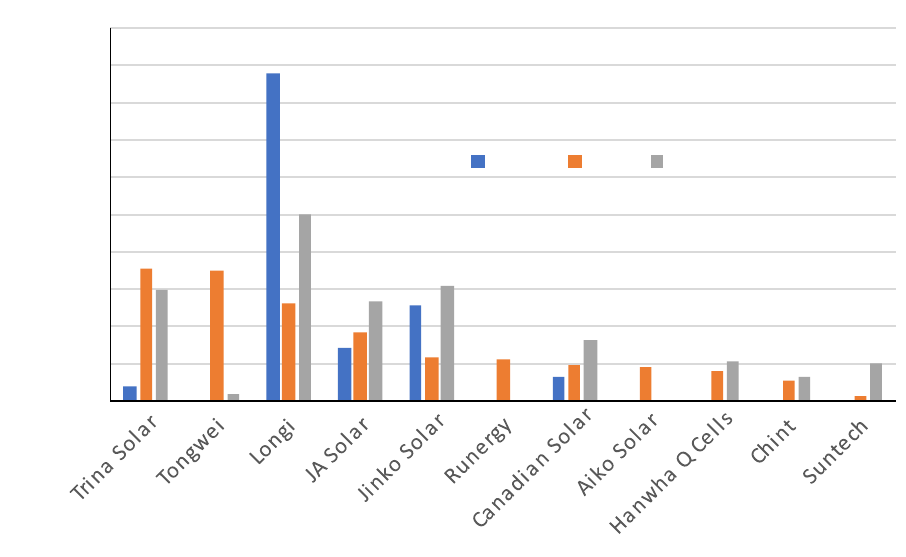
SOLAR PHOTOVOLTAIC S SUPPLY CHAI N DEEP DIVE ASSESSMENT
42
Figure 43. Wafer, cell, and module manufacturing capacities of some leading cell and module manufacturers.
Source: (BloombergNEF 2021f)
U.S. cell manufacturing was driven mostly by six companies, with only three (SolarWorld, Suniva, and Tesla)
achieving capacities above 400 MW
dc
(Figure 44). Two of the six companies (Evergreen and Suniva) went
bankrupt (Hoium 2017). Silicor Materials, Tesla, and Mission Solar closed the U.S. cell manufacturing portion
of their businesses, though Mission Solar and Tesla continue to assemble modules from imported cells
(Lombardi 2011; Jester 2016; Hall 2021; Wood Mackenzie & SEIA 2021). SolarWorld was sold to SunPower,
which briefly operated the facility in Oregon before it was closed in 2021.
Companies reported they were not able to compete at the price levels of imported cells and modules when
Section 201 safeguard tariffs were put in place in 2012 and 2015 (Congressional Research Service 2018), but
low-cost modules and cells still came into the United States from other countries (United States International
Trade Commission 2021). By 2018, when Section 301 tariffs were placed on all imported modules, many of
these companies were already bankrupt, had exited the cell manufacturing industry, or were still unable to
compete with the help of the safeguard tariffs. In the case of cells, the Section 201 tariffs do not apply to the
first 2.5 GW
dc
of imported cells; a cap which was not reached in the first three years of tariff implementation
(United States International Trade Commission 2021). As of the end of 2020, there was no PV cell production
in the United States (Wood Mackenzie & SEIA 2021).
0
10
20
30
40
50
60
70
80
90
100
Manufacturing Capacity (GW)
Wafer Cells Modules
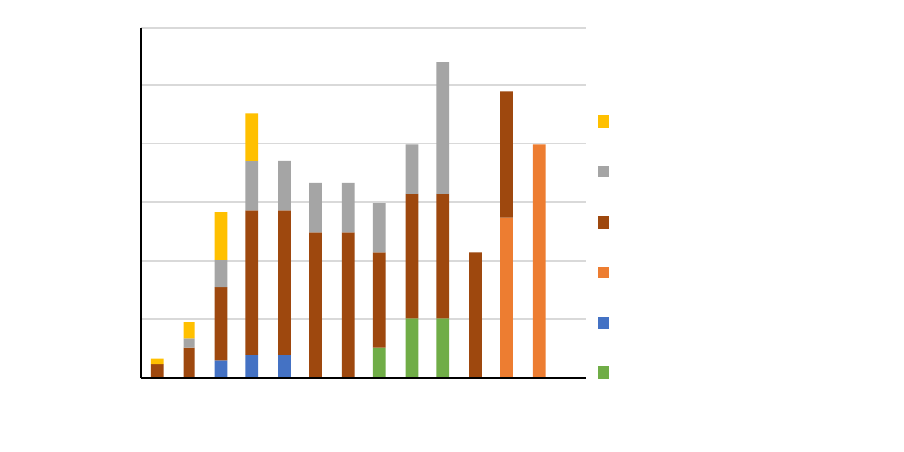
SOLAR PHOTOVOLTAIC S SUPPLY CHAI N DEEP DIVE ASSESSMENT
43
Figure 44. U.S. cell manufacturing capacity.
Sources: (Wood Mackenzie Power & Renewables 2018; Wood Mackenzie & SEIA 2021)
2.5 Module Assembly
2.5.1 Technology Overview
Module assembly entails electrically connecting cells into strings, arranging parallel cell strings into an array,
electrically connecting the strings with metallic ribbons, mounting the array onto a layer of encapsulant on top
of a sheet of glass or backsheet, and laminating another sheet of encapsulant and front glass onto the whole
assembly (Figure 45). The typical front and back encapsulants are thermoplastic material that melts when
heated during the lamination process to encase the entire assembly between a sheet of glass on the front and a
backsheet or another sheet of glass on the back.
The ribbons are fed through a hole in the back glass or backsheet and interwoven on the back of the module
within a junction box, which contains diodes to reduce cell mismatch and serves as the point of contact
between modules in an installed system. Finally, an extruded aluminum frame is typically put around the
perimeter of the module. Some firms have been developing glass-glass modules without an aluminum frame,
while monocrystalline and multicrystalline busbarless, 72-cell, 96-cell, frameless, and glass-glass module
options (including but not limited to options using bifacial cells) are also available.
0
200
400
600
800
1,000
1,200
2007
2008
2009
2010
2011
2012
2013
2014
2015
2016
2017
2018
2019
2020
Manufacturing Capacity (MW)
Suniva
SolarWorld USA
Te s l a /Panasonic
Silicor Materials (CaliSolar
)
(
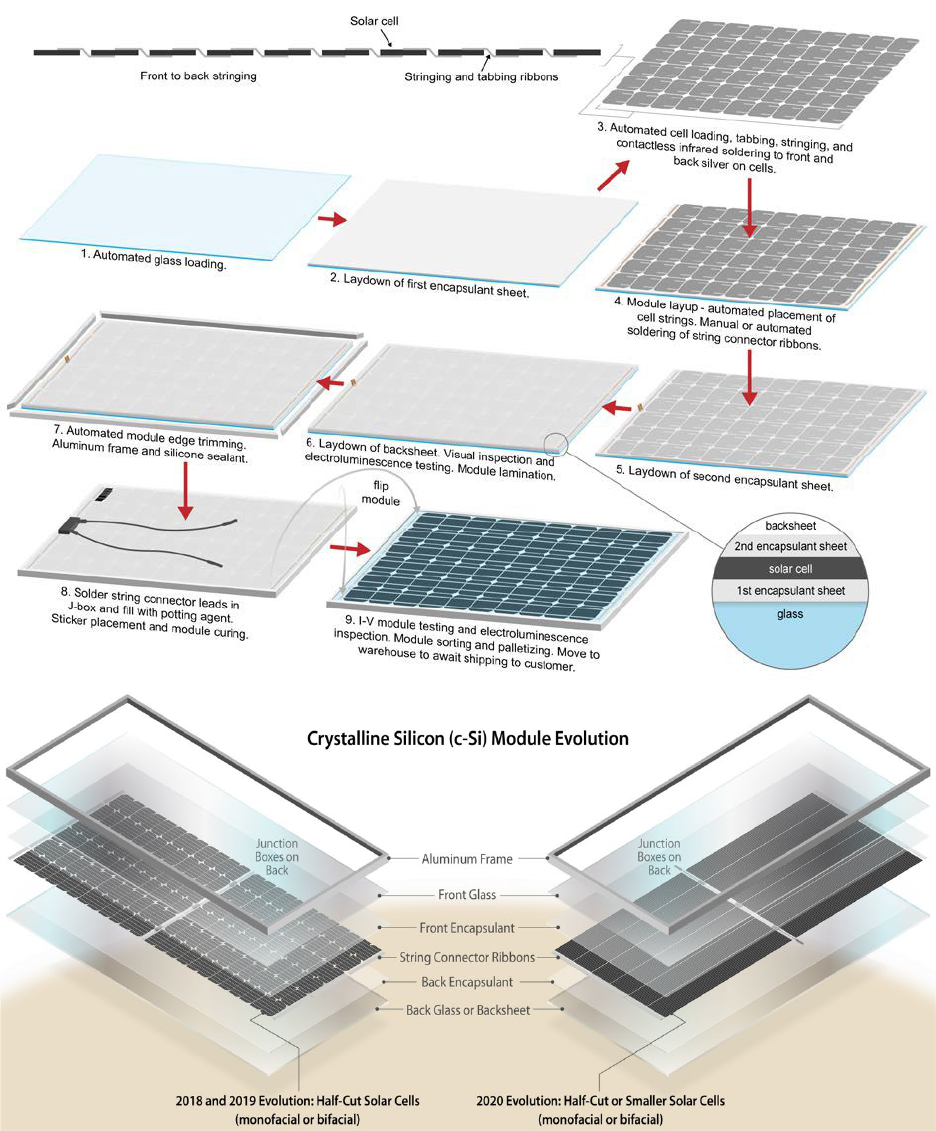
SOLAR PHOTOVOLTAIC S SUPPLY CHAI N DEEP DIVE ASSESSMENT
44
Figure 45. Process flow (top) and finished product (bottom) for standard 60-cell monocrystalline-silicon
module assembly.
Source: NREL
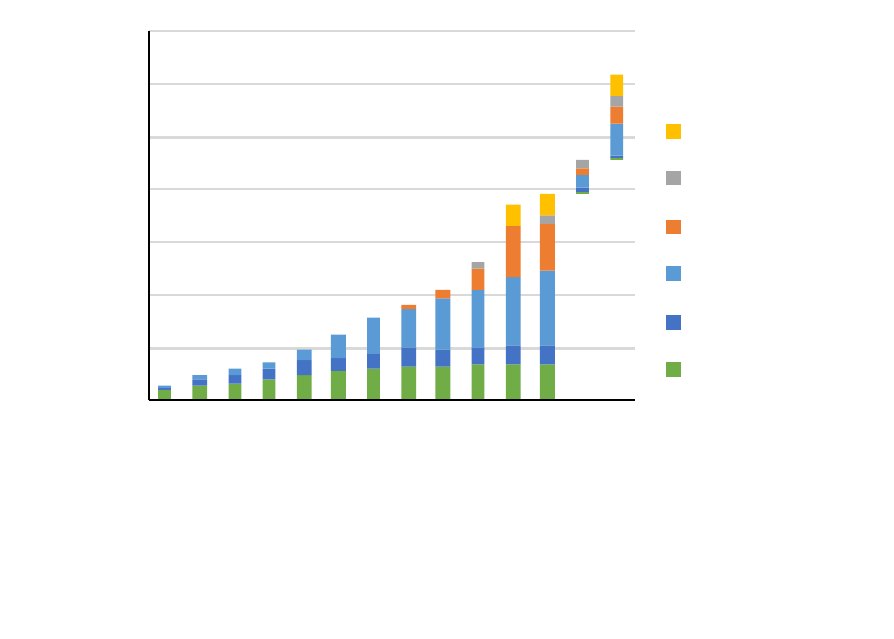
SOLAR PHOTOVOLTAIC S SUPPLY CHAI N DEEP DIVE ASSESSMENT
45
2.5.2 Industry Overview
There are varying degrees of automation within the module production process, and unlike other parts of the c-
Si value chain, this step is more assembly than manufacturing. Because of this, it does not require the same
level of technical skill, and assembly lines can be built in relatively short periods of time. Most of the
components are relatively cheap to ship, including the aluminum frame and glass. Therefore, provided a
manufacturing site has access to the PV supply chain, they can manufacture modules relatively inexpensively
and without much capital expenditure or labor development. While there are economies of scale to this
process, many locations around the world, including the United States, have encoura ged loca l manufacturing,
and module assembly represents a relatively large part of the cost of a final module, without the need for large
government development support.
While not always the case, module manufacturing is often collocated with wafer and cell manufacturing due to
synergies in the manufacturing process, procurement of equipment and land, taking advantage of captive
demand, and economies of scale. 77% of module manufacturing is located in China. Based upon projects that
have been announced or are under construction, this percentage will likely increase, with module
manufacturing increasing from 400 GW
dc
to over 600 GW
dc
. Still, a lmost 100 GW
dc
of module capacity is
located outside of China. Module manufacturing plant size continues to increase, with most new plants with a
stated capacity a bove 5 GW
dc
in size, and now many over 20 GW
dc
(Figure 46). Looking forward, most of the
plants that are under construction or announced are 1 – 20 GW
dc
in size. That said, there appears to be
continued construction of plants with manufacturing capacities less than 5 GW
dc
.
Figure 46. Module manufacturing capacity by plant size.
Source: (BloombergNEF 2021f)
0
100
200
300
400
500
600
700
2010
2011
2012
2013
2014
2015
2016
2017
2018
2019
2020
2021
Announced
Manufacturing Capacity (GW)
20 GW+
10
GW
- 20 GW
5 GW - 10 GW
1 GW - 5 GW
500
MW - 1 GW
< 500 MW
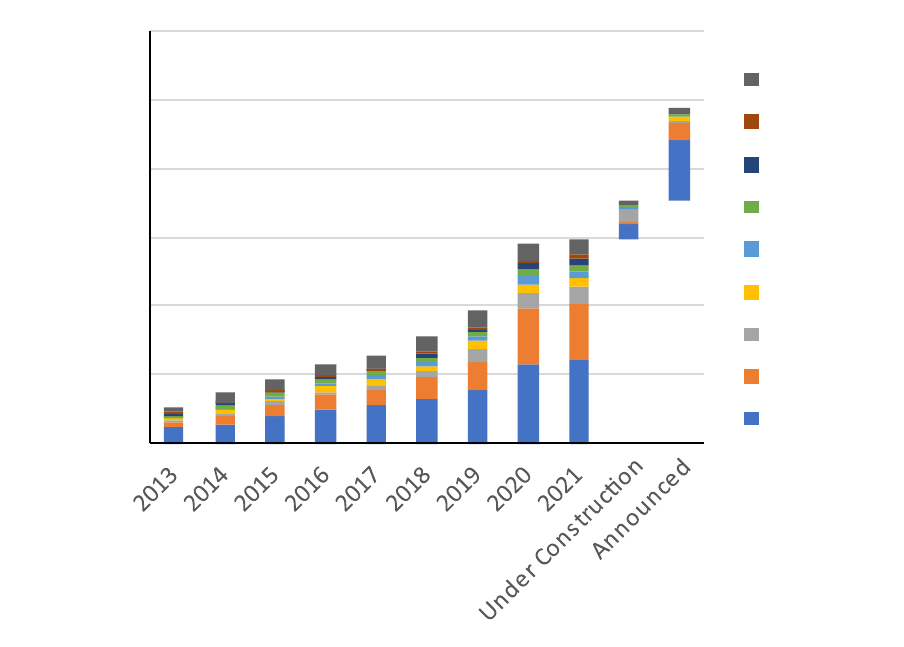
SOLAR PHOTOVOLTAIC S SUPPLY CHAI N DEEP DIVE ASSESSMENT
46
Jiangsu and Zhejiang currently host 68% of Chinese module manufacturing (Figure 47) and 52% of global
manufacturing, and are home to large amounts of polysilicon, wafer, and cell capacity. These provinces are
both located on the coasts, making shipping internationally easier. Despite this large market share, a significant
level of capacity is located outside this region. Because China has represented 30%-50% of global demand for
PV modules, a significant portion of production is shipped domestically. Additionally, there is significant
manufacturing capacity of modules located around the globe, making the level of buyer or supplier power
significa ntly more difficult, and this section of the supply chain more diverse.
Figure 47. Module manufacturing capacity by Chinese province.
Source: (BloombergNEF 2021f)
Outside of China, there is 90-100 GW
dc
of module manufacturing capacity (Figure 48). Much of it is in Asia ,
but there are significant levels of module manufacturing capacity located near areas of large PV demand, such
as Europe and the United States. Manufacturing capacity is expected to further grow, based on projects that
have been announced or are under construction, mostly in Asia.
0
100
200
300
400
500
600
Manufacturing Capacity (GW)
Other
Shanghai
Shandong
Hebei
Anhui
Zhejiang
Jiangsu
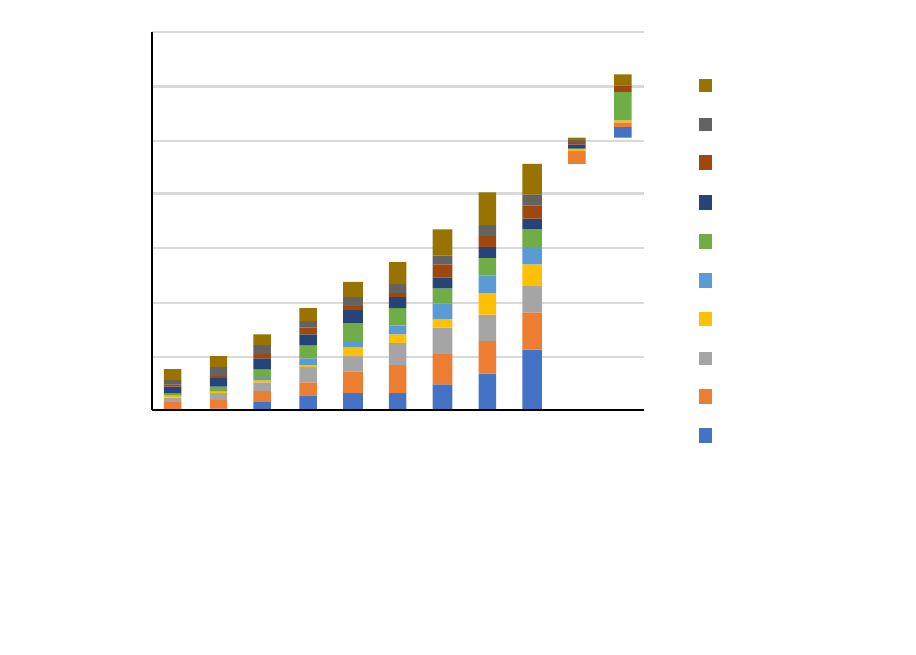
SOLAR PHOTOVOLTAIC S SUPPLY CHAI N DEEP DIVE ASSESSMENT
47
Figure 48. Module manufacturing capacity outside of China.
Source: (BloombergNEF 2021f)
In 2020, 69% of modules produced came from the top 10 manufacturers, all but two (Hanwha Q Cells, First
Solar) of which were Chinese (Figure 49). While this does represent market concentration, it is much less so
than in manufacturing steps before cells.
0
20
40
60
80
100
120
140
2013
2014
2015
2016
2017
2018
2019
2020
2021
Announced
Manufacturing Capacity (GW)
Other
Taiwan
United States
Malaysia
Thailand
Tu rk e y
Korea (Republic)
India

SOLAR PHOTOVOLTAIC S SUPPLY CHAI N DEEP DIVE ASSESSMENT
48
Figure 49. Module production by manufacturer, 2020.
Source: (BloombergNEF 2021e)
There is significant vertical integration for module manufacturers. See Figure 43, which provides the wafer,
cell, and module manufacturing capacities of some of the leading cell and module manufacturers. While some
only focus on one piece of the value chain, many of them have significant investment in a ll three.
U.S. module manufacturing has consisted of dozens of manufacturers over the past twenty years, but much of
the capacity was operated by a few companies. U.S. module assembly grew rapidly until 2010, due to
increasing demand for PV modules. Over a third of module assembly capacity came from the German
company SolarWorld, which also manufactured wafers and cells in the United States (Wood Mackenzie Power
& Renewables 2018).
As PV module prices dropped precipitously in 2010 (Figure 50), many of these companies could no longer
compete and closed operations. Module capacity grew again starting in 2015 with the institution of tariffs on
Chinese panels and continued growth in the United States PV market (Congressional Research Service 2018).
However, the United States was eventually able to import low-cost PV modules from other low-cost Asian
countries, and many of the companies, including SolarWorld, ceased operations.
16%
11%
10%
8%
6%5%
4%
4%
3%
2%
31%
Total
167 GW
Longi
Jinko Solar
JA Solar
Tri na
Solar
Canadian Solar
Hanwha
Q CELLS
Risen Energy
First
Solar
Chint
Wuxi Suntech
Other
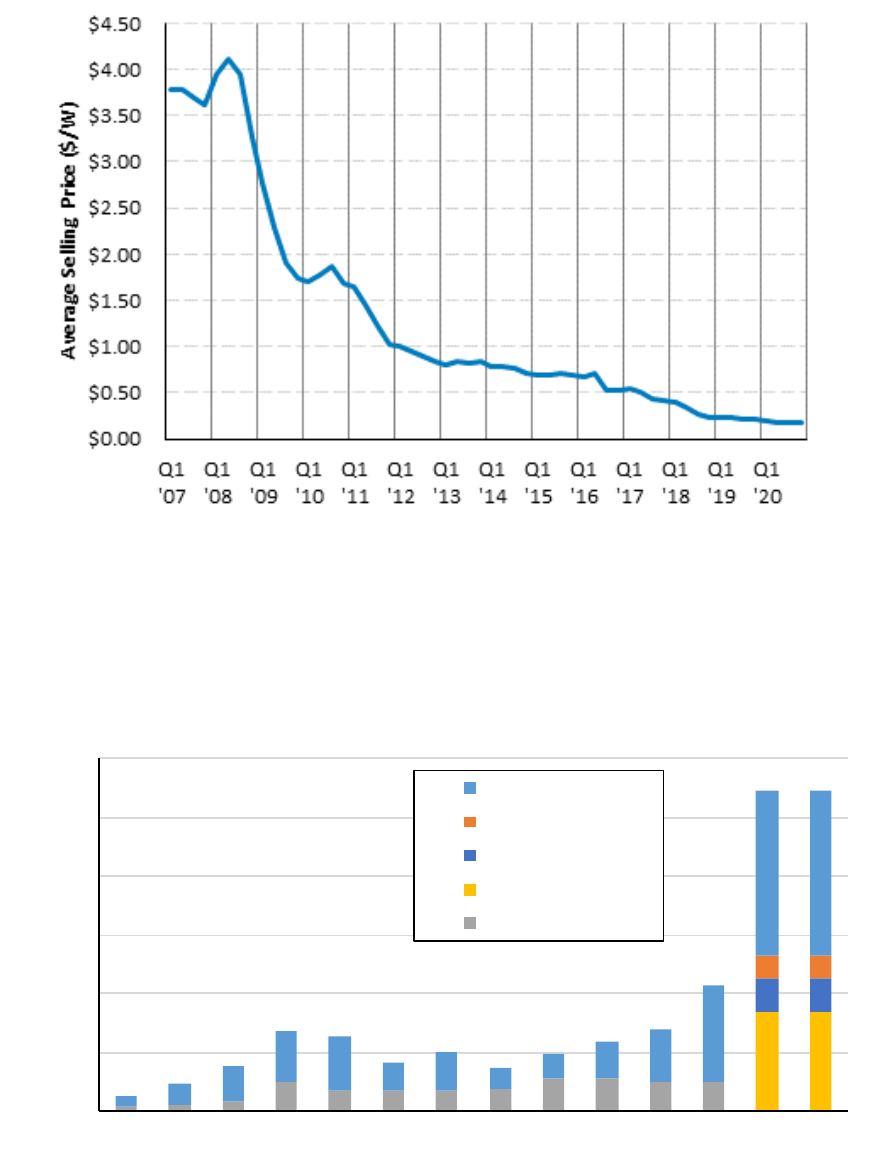
SOLAR PHOTOVOLTAIC S SUPPLY CHAI N DEEP DIVE ASSESSMENT
49
Figure 50. Average module selling price.
Sources: (BloombergNEF 2021a; Chin et al. 2012; Shah 2019)
In 2018, Section 201 tariffs were put in place, putting a 30% duty on virtually all imported modules (over the
years, this tariff has dropped to 15%) (Reuters 2020). As a result of these ta riffs, U.S. c-Si module assembly
capacity more than doubled (Figure 51).
Figure 51. U.S. module manufacturing capacity.
Sources: (Wood Mackenzie Power & Renewables 2018; Wood Mackenzie & SEIA 2021)
0
1
2
3
4
5
6
2007 2008 2009 2010 2011 2012 2013 2014 2015 2016 2017 2018 2019 2020
Manufacturing Capacity (GW)
Other
JinkoSolar
LG Solar
Hanwha Q Cells
SolarWorld
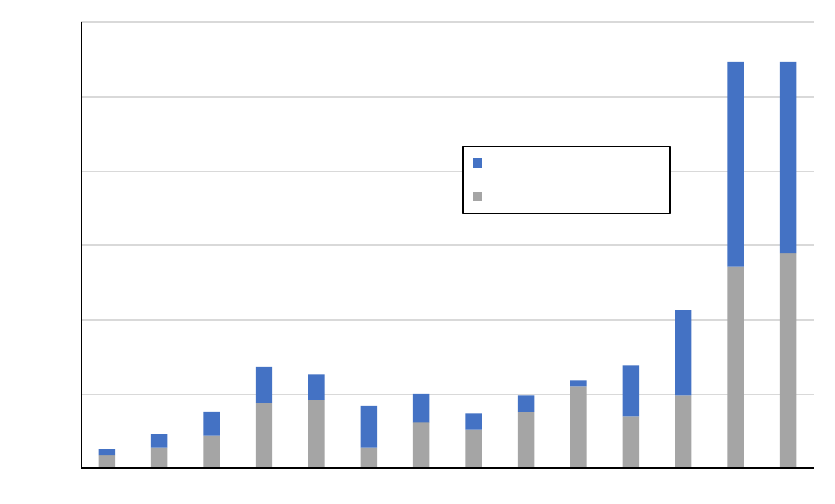
SOLAR PHOTOVOLTAIC S SUPPLY CHAI N DEEP DIVE ASSESSMENT
50
Despite the increase in capacity and subsequent increase in PV modules produced in the United States, these
facilities continue to operate with significant excess capacity (Figure 52). In the past three years of the Section
201 tariff, module production and PV cell imports have been around the same level as the 2.5 GW
dc
PV cell
tariff exemption.
Figure 52. U.S. module production and excess production capacity.
Sources: (Wood Mackenzie Power & Renewables 2018; Wood Mackenzie & SEIA 2021)
2.6 Mounting Structures
2.6.1 Technology Overview
PV mounting structures hold PV panels in place, securing them from wind, and ideally providing air
circulation underneath to keep them cool (allowing the cells to operate more efficiently). A significant portion
of mounting structures is made of galvanized or stainless steel, which is composed of iron, with small amounts
of carbon, manganese, silicon, phosphorus, sulfur, and oxygen. In addition to steel, aluminum is used, as well
as the raw materials in electrical components, such as silicon, copper, and petroleum-based material. Other
parts are manufactured using galvanized or stainless steel, but also some aluminum, electrical equipment,
motors, and possibly concrete. Most of the labor spent installing PV systems, particularly utility-scale PV,
involves assembling the mounting structure.
There are four primary mounting structures deployed in the United States: single-axis tracking ground-mount
systems, fixed-tilt ground-mount systems, penetrating rooftop systems, and ballasted rooftop systems. Single-
axis tracking systems attach the modules to a horizontal torque tube that is oriented on a north-south axis that
rotates the modules from east-facing in the morning to west-facing in the evening. Fixed-tilt system s typica lly
orient the modules facing towards the south tilted at an angle above horizontal equal to the local latitude.
Rooftop systems for flat roofs typically orient the modules between southwest and southeast at a tilt angle of
10 to 20 degrees above horizontal. Rooftop systems for pitched roofs are typically coplanar with the roof. Each
of the four systems will be discussed in turn.
0
1
2
3
4
5
6
2007 2008 2009 2010 2011 2012 2013 2014 2015 2016
2017 2018
2019 2020
Capacity (GW)
U.S.
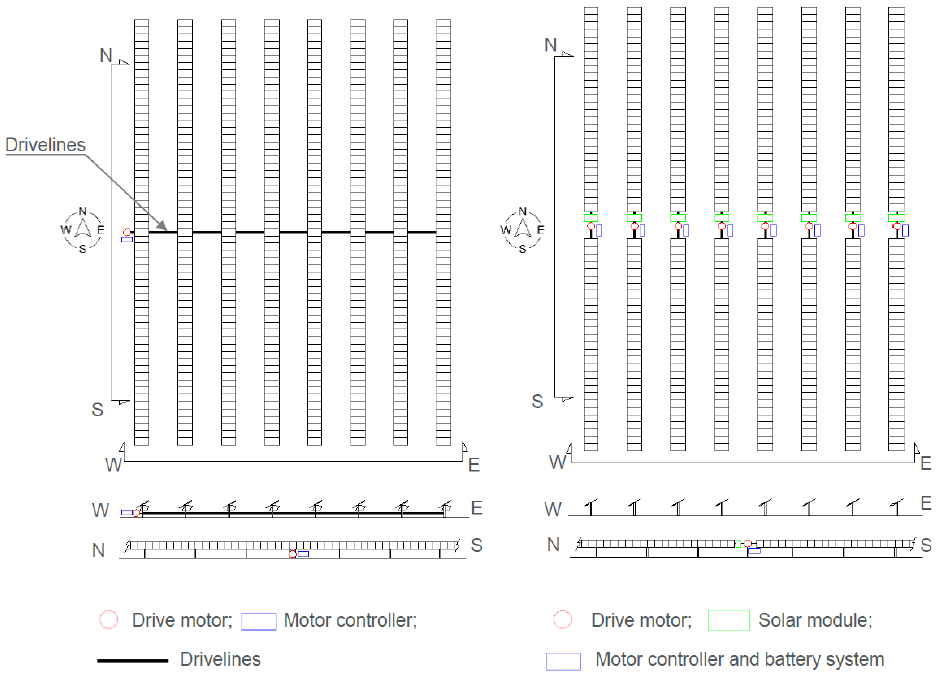
SOLAR PHOTOVOLTAIC S SUPPLY CHAI N DEEP DIVE ASSESSMENT
51
PV trackers are used to orient modules more directly toward the sunlight to increase energy production per
module. Because trackers represent moving machinery - requiring more material than fixed-tilt ra cking
systems, as well as more land-use and higher operation and maintenance (O&M) costs - they typically
represent a cost premium, but this premium is often outweighed by the increase in energy production. Single-
axis trackers used to be primarily located in sunny areas, where the performance premium was more
substantial. However, since 2013, with the decline in cost premium, single-axis trackers have been increasingly
deployed in less sunny locations. Exceptions to this trend tend to involve specific site factors, such as being in
hurricane-prone areas, greenfield sites where significant ground penetration is problematic, or on military
bases (Bolinger, Seel, and Robson 2019).
Single axis tracker architecture is typically either centralized, with equipment designed to move multiple rows
of PV modules at a time (typically 15 to 30), or decentralized, with equipment designed to move one row of
modules at a time (Figure 53). Approximately 42% of 2020 tracker shipments used centralized trackers, while
58% used decentralized architecture (Wood Mackenzie Power & Renewables 2021a).
Figure 53. Multi-row (left) and single-row (right) tracking systems.
Source: (RINA Tech and Array Technologies 2020)
Five categories typically make up the components of a single-a xis tracking system (Ta ble 4). While the
component categorization is similar regardless of tracker design, decentralized and centralized configurations

SOLAR PHOTOVOLTAIC S SUPPLY CHAI N DEEP DIVE ASSESSMENT
52
will have different proportions of costs per category. There are over 500 major components per MW
dc
, with
thousands of minor components (e.g., nuts, bolts).
Table 4. Components of a tracking system.
Component
Description
Quantity per MW
dc
Structures
Typically made of galvanized
steel and some aluminum
Fasteners
Galvanized or stainless-steel
parts connecting components
together (e.g., nuts, bolts)
Module rails
Steel rails connecting PV
modules to tracker
Foundations
Connects mounting structure to
ground
Support columns (driven piers)
Steel foundational tracker
support, driven into ground with
machines
12
Some sites also use concrete or
ground screws (also made of
galvanized steel)
Torque Tube and Bearings
Determines the motion of the
equipment
Torque Tube
A galvanized steel tube,
connected to the rails holding the
modules. It is rotated by a motor,
so the PV panels rotate.
1
Bearings
Connect torque tube to support
columns
376
Drive Train (transmission
system)
Gearbox, gear racks, worm gear,
and connecting rods, driveline
joints, or slew drive on or near
pier that allows torque tube to
rotate.
34
Harmonic Dampers
Shock absorbers
68
Drive Motor
Powers the movement of the
rows
1 (centralized)
34(decentralized)
Tracker Control Panel, Power
Supply, and Stowing
Electronics required to perform
tracking algorithm, including
weather reading, sensors, and
communications. Electronics and
control also necessary to safety
stow trackers in cases of high
wind
Sources: (RINA Tech and Array Technologies 2020; NREL 2021)
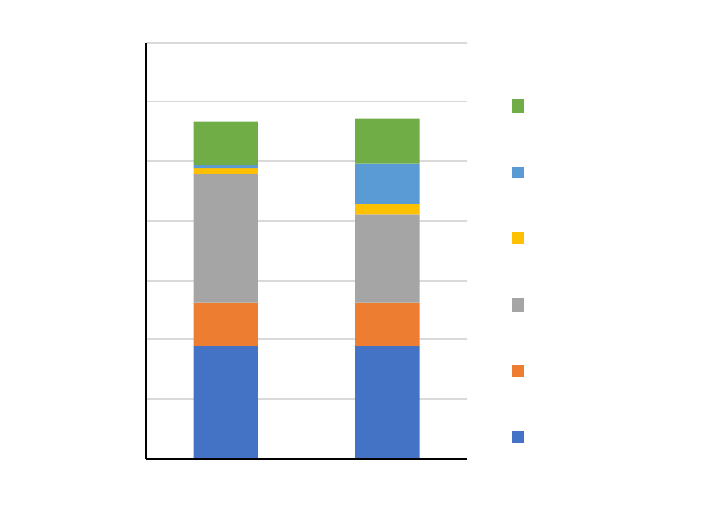
SOLAR PHOTOVOLTAIC S SUPPLY CHAI N DEEP DIVE ASSESSMENT
53
While some preassembly of tracker components does occur, it is weighed against the additional costs of
shipping a bigger piece of equipment to the PV project. A significant portion of tracker assembly occurs at the
PV installation site. Tracking companies do not do the installation themselves, but rather provide training and
field services to engineering, procurement, and construction (EPC) installers, particularly those whose
companies have not installed that particular design, or from that particular tracker company.
The cost contribution by component will also vary depending on tracker architecture, as demonstrated in
Figure 54. Centralized tracker configurations tend to have higher torque tube and bearing costs due to the need
to move multiple rows with one motor, but they save on fewer pieces of redundant electronic equipment.
Figure 54. Indicative cost breakdown of trackers, by subcomponent.
Sources: (RINA Tech and Array Technologies 2020; NREL 2021)
PV modules that are mounted at a fixed tilt are configured to optimize system performance over the course of
an entire year. The farther away a system is from the equator, the greater the tilt angle for optimal design. The
mounting design is based on wind load, with more reinforcements (e.g., higher steel gauge) necessary for
windier pla ces.
Fixed-tilt mounting structures typically consist of rails connected to rear and front legs (or a single leg), with
clamps holding the modules in place. The legs are typically driven into the ground or held in place with
concrete. Virtua lly a ll components are made of steel or aluminum.
Slanted roofs typically mount racking on the south, east, or west portion of the roof. Because of the tilt, they
often penetrate the roof to affix the racking. Commercial rooftop buildings, however, are often flat with the
ability to handle significant weight. In these cases, developers often opt for non-penetrating, ballasted systems,
which rely on heavy material (i.e., concrete) to keep systems in place.
$0.00
$0.02
$0.04
$0.06
$0.08
$0.10
$0.12
$0.14
Centralized
Decentralized
$/
Shipping
Drive Motor
Torque Tube and
Bearings
Structures
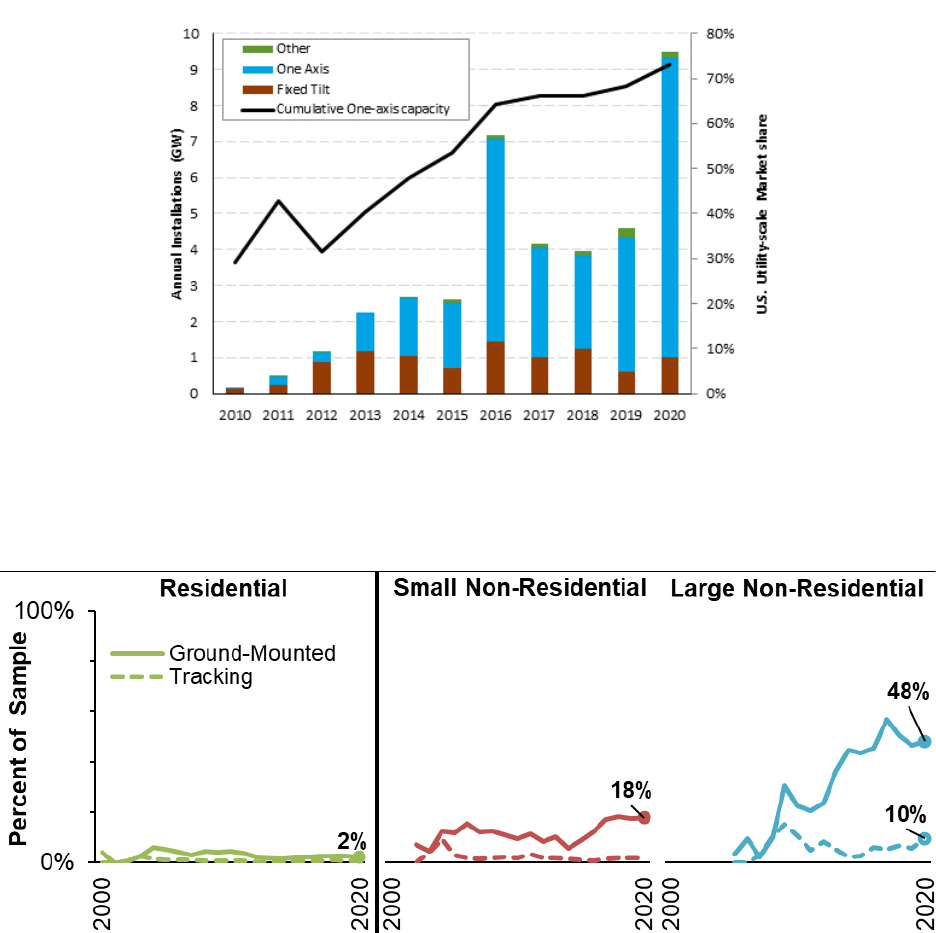
SOLAR PHOTOVOLTAIC S SUPPLY CHAI N DEEP DIVE ASSESSMENT
54
Like fixed-tilt mounting, most rooftop racking components are made of galvanized steel or aluminum and
consist of rails and clamps. They also typically have splice plates to connect the rails (which can be used for
grounding) and either a ballasted foundation (used with concrete as the weight) or a roof penetration system.
2.6.2 Industry Overview
Utility-scale PV represents the majority of PV installed in the United States (46 GW
dc
vs. 17 GW
dc
and 10
GW
dc
for residential and commercial and industrial (C&I), respectively), and within that sector over 70% of
installed capacity has used single-axis tracking ground-mount structures (EIA 2021a, Figure 55). Residentia l
PV systems almost exclusively use penetrating rooftop mounting. C&I installations have a mix of fixed-tilt
structures for ground mount and ballasted rooftop mounting for large, flat rooftops (Figure 56).
Figure 55. U.S. utility-scale PV installed capacity, by mounting structure.
Source: (Feldman and Margolis 2021)
Figure 56. U.S. distributed PV panel mounting trends.
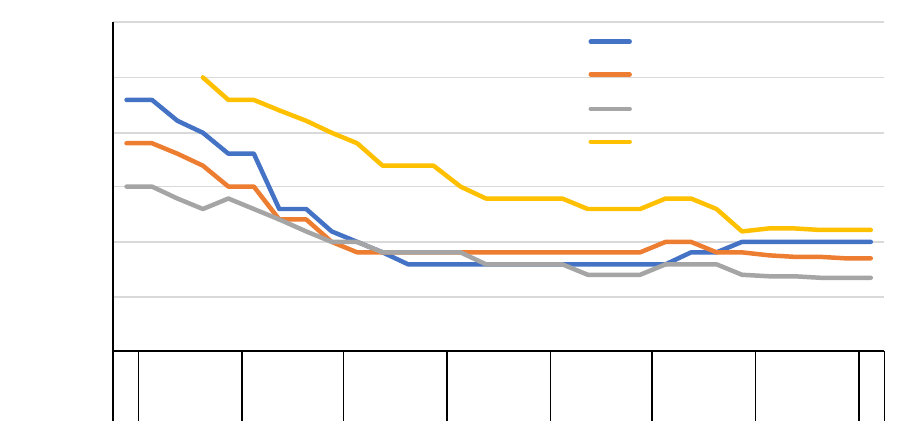
SOLAR PHOTOVOLTAIC S SUPPLY CHAI N DEEP DIVE ASSESSMENT
55
Source: (Barbose et al. 2021)
Single-axis trackers have gained significant market share in large part because of the narrowing premium as
compared to fixed-tilt systems, as demonstrated in Figure 57. With the exception of trackers, mounting costs
have been relatively flat since 2016. The price of trackers was flat in 2020 and the first quarter of 2021.
Figure 57. U.S. average PV racking price, by sector.
Source: (Wood Mackenzie & SEIA 2021)
Tracking companies spend a significant portion of their efforts developing intellectual property and managing
logistics to bring the pieces of equipment to the PV system site. While there is some manufacturing performed
by the companies themselves, a significant portion is made by third-party suppliers. Companies often have
agreements with steel and aluminum suppliers for the raw material, and with mills and manufacturing
companies that are given the specs to produce the company’s parts. Many pieces of the equipment are
delivered directly on-site, never coming in contact with the tracking company. Companies look to produce the
tracker at the lowest cost to the PV site (including shipping), but they balance this with the competitive
advantage of short lead times (getting the equipment to the PV site in a timely manner). Therefore, a company
may opt for manufacturing locations that are somewhat more expensive but closer to demand (e.g., U.S.,
Mexico). This allows companies to deliver products faster than their competitors and provide a quicker
turnaround time if there is an error and a part needs to be replaced.
The two largest tracker vendors, globally and in the United States, are the U.S. firms NEXTracker and Array
Technologies, collectively representing 70% of 2020 U.S. tracker shipments, and 46% of 2020 global tracker
shipments (Figure 58). NEXTracker was originally a U.S. company, and it is still based in San Jose, CA.
However, in 2015 it was purchased by Flex, a Singapore-based global electronics manufacturer, with
manufacturing facilities in thirty countries. NEXTracker now manufactures on five continents, including major
fa cilities in Mexico (Roselund 2019). However, the second and third largest suppliers of U.S. trackers, Array
Technologies (27% of the market in 2020) and GameChange Solar (8% of the market in 2020) are based in the
United States (Wood Mackenzie Power & Renewables 2021a). While GameChange Solar appears to only
supply projects in the United States, Array Technologies was the second largest global manufacturer of PV
trackers in 2020, and exported approximately 16% of its products (Wood Mackenzie Power & Renewables
$0.00
$0.05
$0.10
$0.15
$0.20
$0.25
$0.30
Q4 Q1 Q2 Q3 Q4 Q1 Q2 Q3 Q4 Q1 Q2 Q3 Q4 Q1 Q2 Q3 Q4 Q1 Q2 Q3 Q4 Q1 Q2 Q3 Q4 Q1 Q2 Q3 Q4 Q1
13 2014 2015 2016 2017 2018 2019 2020 21
U.S. ASP ($/W
dc
)
-
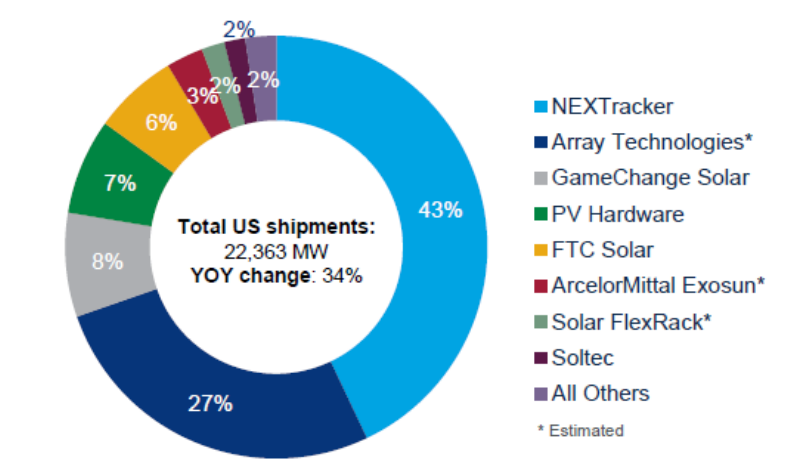
SOLAR PHOTOVOLTAIC S SUPPLY CHAI N DEEP DIVE ASSESSMENT
56
2021a). All of these U.S. companies control much of the intellectual property incorporated into their products,
but they still rely heavily on international suppliers for aluminum and steel.
Figure 58. U.S. PV tracker market share rankings by shipment, 2020.
Source: (Wood Mackenzie Power & Renewables 2021a)
There are many fixed-tilt mounting structure suppliers worldwide because there is very little intellectual
property associated with the design and therefore a low barrier to entry. Manufacturing plants are typically
successful if they achieve sufficient scale and are located near demand to reduce shipping costs (Aboudi 2011).
Some PV manufacturers, such as Canadian Solar and Trina Solar, also offer fixed-tilt racking solutions as part
of a bundle with their PV modules.
Simila rly, while there is a diverse marketplace of products, most of the leading racking companies in the
United States distributed PV marketplace manufacture exclusively (Unirac, PV Racking, ProSolar, Quick
Mount PV, Oatey, DPW Solar, Tamarack Solar) or in part (IronRidge) in the United States.
However, the Section 232 tariffs have indicated how heavily some domestic racking producers rely on
imported raw steel or aluminum pricing. Once the Section 232 tariffs were enacted, multiple firms decreased
the amount of racking produced in the United States, since they could no longer afford raw metals, and instead
imported finished racking from overseas (Eckhouse and Deaux 2019b).
2.7 PV Inverters
2.7.1 Technology Overview
Inverters are the primary power electronics equipment in PV systems, converting the dc energy generated by
PV modules into ac energy used by the electric grid. PV inverters have varying levels of capacity and function,
each with its own set of advantages. Generally, they can be divided into the following categories:
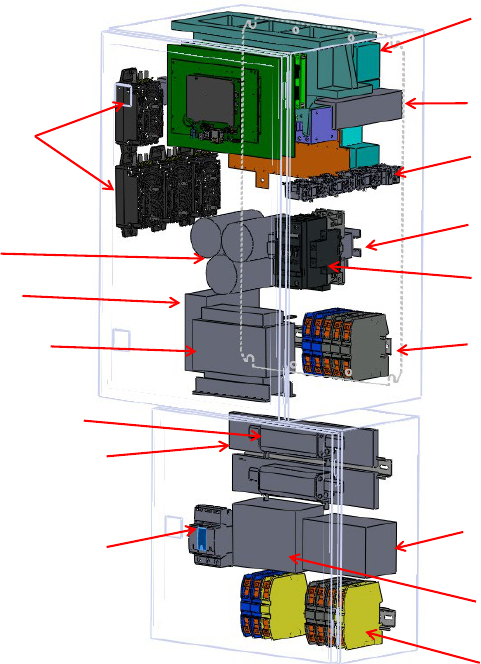
SOLAR PHOTOVOLTAIC S SUPPLY CHAI N DEEP DIVE ASSESSMENT
57
• Central inverter: typically, floor or ground-mounted, converting the energy from multiple strings of PV
panels, typically range in size between 1 MW
ac
– 5 MW
ac
and are used in utility-sca le a pplica tions.
• Three-phase string inverter: typically installed on a wall or a vertical structure, converting the energy
from a single string of a PV array to three-phase energy, typically found in commercial and utility-scale
applications.
• Single-phase string inverter: like three-phase inverters but only convert to single-phase power, typically
found in homes.
• Module level power electronics: includes both microinverters, which convert the energy from a single
module, and dc-dc optimizers, which optimize the power supply for each individual module but work
with three-phase or single-phase string inverters.
PV inverters are composed of power electronic semiconductors and power circuits, primarily consisting of the
power block (or power module) and passive components; mechanical and structural parts, consisting of the
thermal management system (if necessary), and the casing. Figure 59 diagrams the components of a typical
inverter and how they are connected.
Figure 59. Inverter assembly with supporting components.
Source: (Singh, et al., 2018)
Silicon, copper, aluminum, and petroleum-based material are all processed into forms that can be used to
produce the subcomponents, such as semiconductors, transformers, and housing structures. Figure 60 provides
Power block
Supporting bracket
Current sensors
Contactor
Terminal blocks
Surge
protector
AC circuit breaker
DC circuit breaker
Terminal blocks
Inverter-side inductor
Capacitors
Voltage sensors
Grid
-side inductor
Fuses
Fuse bases
Power supply
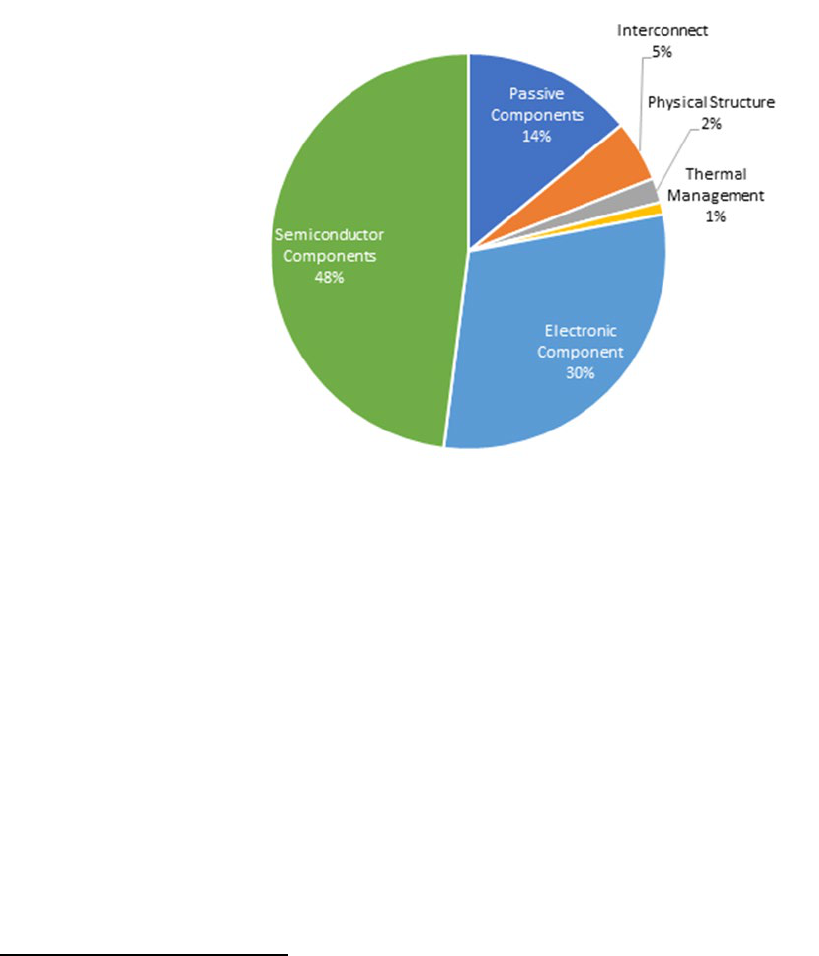
SOLAR PHOTOVOLTAIC S SUPPLY CHAI N DEEP DIVE ASSESSMENT
58
a cost breakdown of a silicon carbide (SiC) converter.
3
As shown, the power block, consisting of the
semiconductor and electronic component, represents the bulk of the costs, followed by the passive
components. Insulated-gate bipolar transistors (IGBTs) are the power devices used in higher power
applications, such as for PV inverter power blocks.
Inverter enclosures are typically made of metal and would have a similar supply chain to aluminum and steel.
Thermal management systems (i.e., wiring, thermostat, fan) are part of the general electronics supply chain,
dominated by Asia .
Figure 60. Breakdown of silicon carbide inverter material costs.
Source: (Singh, Reese, and Akar 2019)
2.7.2 Industry Overview
Components including semiconductor power electronics, the power block, and passive components are
typically manufactured in separate locations from where they are eventually assembled into an inverter,
providing the opportunity for a global supply chain.
The United States, Europe, Japan, and other parts of Asia have many large semiconductor companies
generating the intellectual property found in an inverter, as seen in Figure 61.
3
Silicon carbide technology represents a small portion of PV inverter sales, with most sales using silicon semiconductor equipment. However, the
proportions give a rough estimate of component cost contribution.
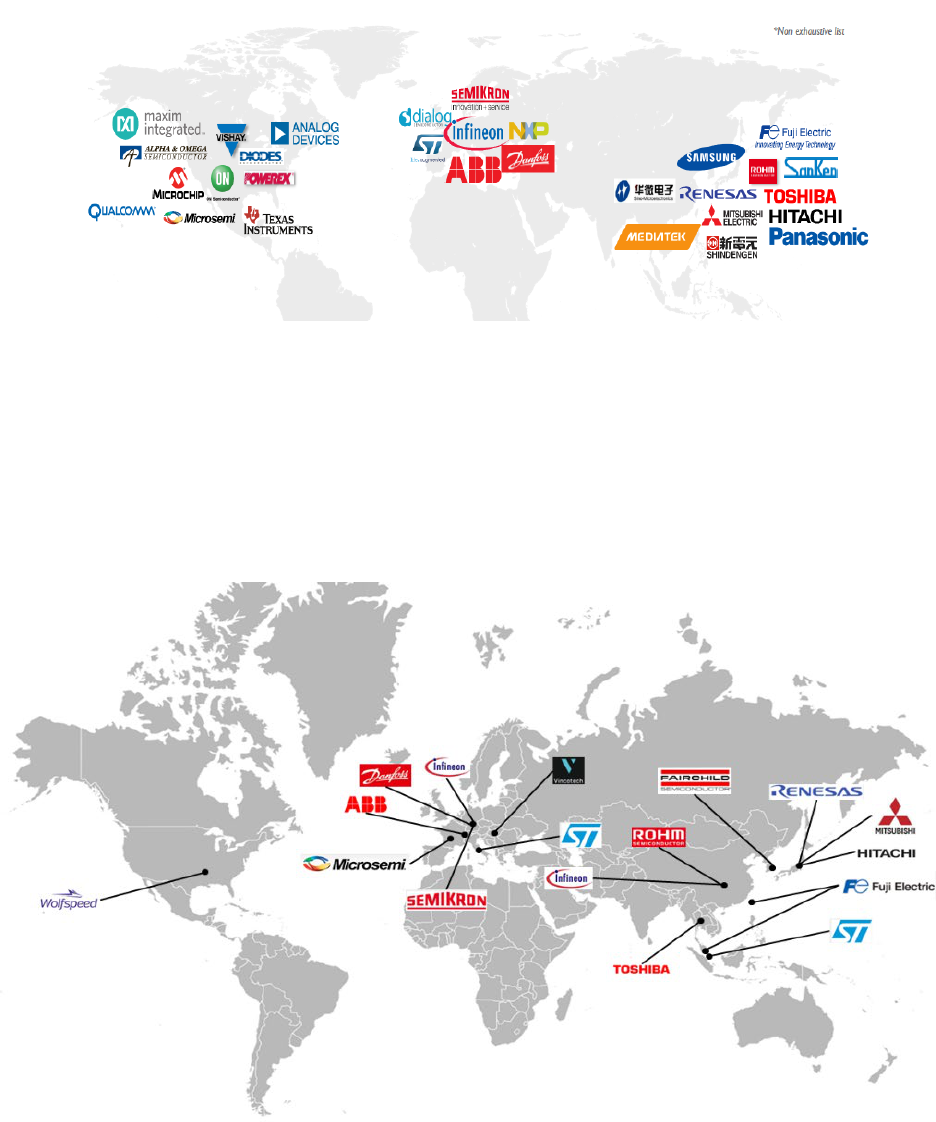
SOLAR PHOTOVOLTAIC S SUPPLY CHAI N DEEP DIVE ASSESSMENT
59
Figure 61. Geographical headquarters of main power semiconductor companies (non-exhaustive list).
Source: (Yole Developpement 2018)
Despite the large presence of U.S., European, and Japanese semiconductor power electronics companies, most
of the manufacturing is done in China and other parts of Asia. From 2012 to 2017, the American presence
decreased from 10% to 8% of the market, while China a nd Asia Pa cif ic accounted for 54% to 58%, a trend that
is likely to continue. Figure 62 shows known locations capable of assembling IGBT modules necessary for
power blocks.
Figure 62. Geographical positions of main manufacturing power block locations (non-exhaustive list).
Source: (NREL 2021)
Passive component manufacturing is geographically diverse but is heavily focused in China and the rest of
Asia (Figure 63). In a database of 542 unique passive components (e.g., cathode, wire, die, terminals), 35
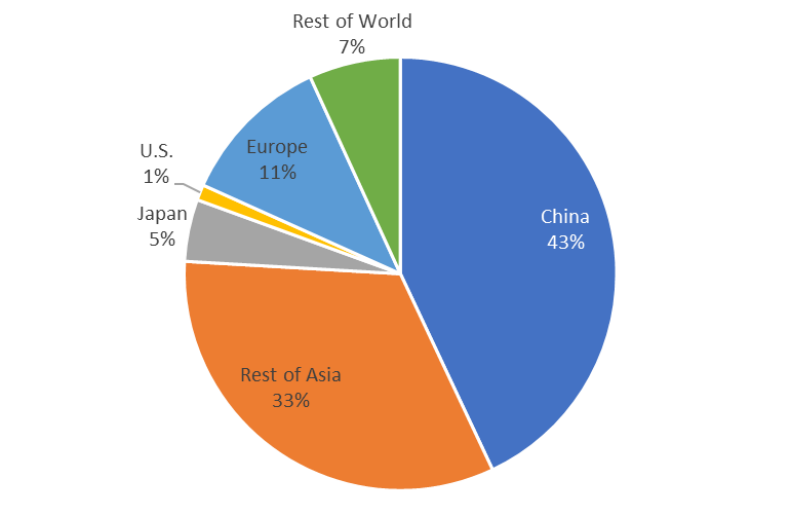
SOLAR PHOTOVOLTAIC S SUPPLY CHAI N DEEP DIVE ASSESSMENT
60
manufacturers built parts in 31 different countries. While the quantity of products built is not well known, 43%
of the individual products were manufactured in China, 5% in Japan, and another 33% in the rest of Asia. Only
1% of the products were manufactured in the United States.
Figure 63. Percent of individual passive components manufactured by region.
Source: (SiliconExpert 2019)
While a small number of companies have some vertical integration starting at the device level all the way
through to an inverter (e.g., ABB, Infineon), most inverter components are bought and then assembled. In
2020, 185 GW
ac
of PV inverters were manufactured globally, with 121 GW
ac
, or 66%, from companies
headquartered in China.
Most of the European and Chinese companies manufacture domestically, but many inverter manufacturers
produce products abroad – particularly those that produce module-level-power-electronics (MLPE). For
example, the leading MLPE producer, SolarEdge, headquartered in Israel, has production facilities in Hungary,
China, and Vietnam. The second leading MLPE producer, Enphase, headquartered in the United States, has
production facilities in China and Mexico. The U.S. domestic market relies more heavily on inverters from
companies headquartered in Europe and Japan (Figure 64).
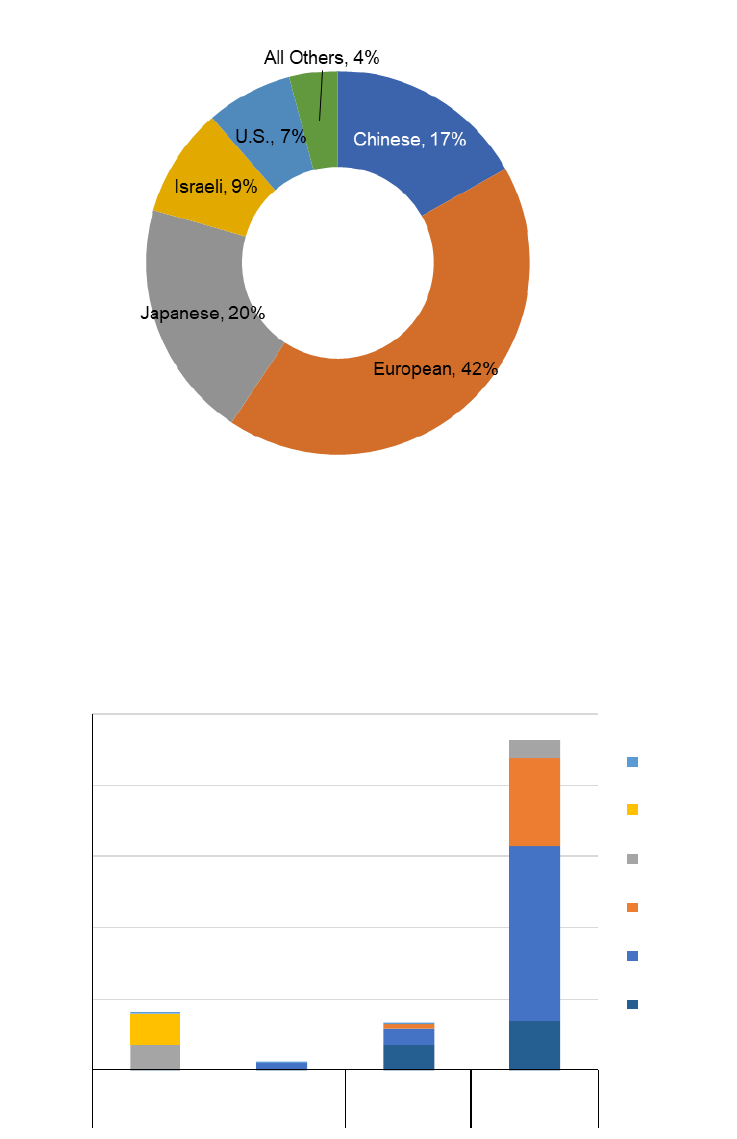
SOLAR PHOTOVOLTAIC S SUPPLY CHAI N DEEP DIVE ASSESSMENT
61
Figure 64. Percent of U.S. inverter shipments, by manufacturing headquarters, 2020.
Source: (Wood Mackenzie Power & Renewables 2021b)
However, the inverter supply chain varies by inverter type, with U.S. utility-scale applications dominated by
European and Japanese companies, and residential applications dominated by U.S. and Israeli companies
manufacturing in China and other foreign countries (Figure 65).
Figure 65. Global inverter manufacturing capacity by company location and application, 2020.
Source: (Wood Mackenzie Power & Renewables 2021b)
0
5
10
15
20
25
Single-phase, string Three-phase, string Central
/
Manufacturing Capacity
(GW)
All Others
Israeli
U.S.
Japanese
Chinese
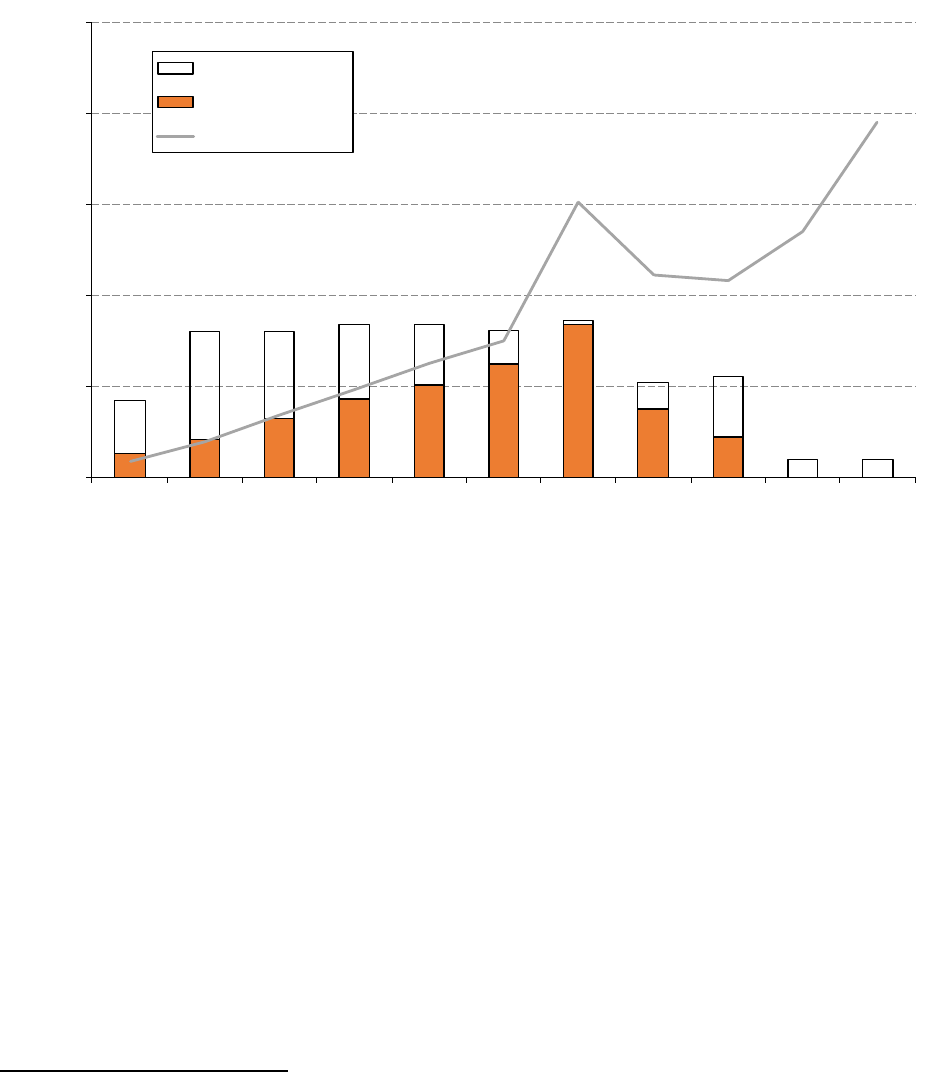
SOLAR PHOTOVOLTAIC S SUPPLY CHAI N DEEP DIVE ASSESSMENT
62
Through 2015, the U.S. manufactured approximately the same capacity of inverters domestically as what was
installed each year, as demonstrated in Figure 66.
Figure 66. U.S. inverter production, manufacturing capacity, and system deployment.
4
Source: (Wood Mackenzie & SEIA 2021)
U.S. inverter manufacturing capacity began to fall in the second half of 2016, largely due to continued price
declines f or utility-scale inverters, as shown in Figure 67.
4
Inverter shipments and capacity are converted from ac to dc assuming a ratio of 1.2. Wood Mackenzie stopped reporting inverter production and capacity
at the end of 2018. Q4 2018 shipment and capacity values represent Q1-Q3 2018 averages.
0
5
10
15
20
25
2010 2011 2012 2013
2014 2015 2016
2017 2018
2019 2020
U.
S. Capacity
(GWac)
U
.S.
(likely less
than 1 GW)
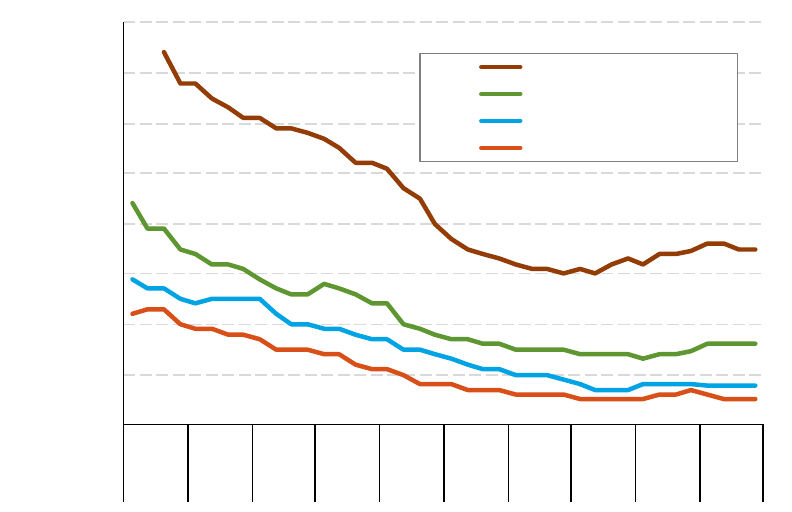
SOLAR PHOTOVOLTAIC S SUPPLY CHAI N DEEP DIVE ASSESSMENT
63
Figure 67. U.S. inverter pricing by sector.
Source: (Wood Mackenzie & SEIA 2021)
Two of the leading U.S. inverter manufacturers at the time (with headquarters in Europe), ABB and SMA,
closed their U.S. facilities to consolidate manufacturing in their European plants (Wood Mackenzie & SEIA
2017). Inverters continue to be produced in the United States, mainly from foreign-owned firms, but at a much
lower level compared with previous years. At the same time, U.S. demand for inverters has continued to grow,
thus reducing the percentage of installed content from domestic producers.
2.8 Cadmium T elluride Technology
2.8.1 Cadmium and Tellurium Refining
2.8.1.1 Technology Overview
Cadmium (Cd) and tellurium (Te) are the primary elements used to make thin-film CdTe a bsorber m a teria l,
which is the second most deployed PV technology, behind c-Si. Neither Cd nor Te are found isolated in
mineral ores, and both are byproducts (considered as minor metals) of smelting of other prime metals such as
copper (Cu), zinc (Zn), lead (Pb), and gold (Au) (“Assessment of Critical Thin Film Resources,” n.d.).
The availability of Cd and Te depend predominantly on the demand for Zn and Cu, respectively. Around 80%
of Cd is generated as a product of smelting Zn ores, with 20% from Pb ores. Te is produced as a byproduct of
Cu refining and is considered a rare element (V. Fthenakis 2007). Cd and Te are used in a variety of products,
although PV is the largest single usage of Te (Figure 68).
$0.00
$0.10
$0.20
$0.30
$0.40
$0.50
$0.60
$0.70
$0.80
Q1 Q3 Q1 Q3 Q1 Q3 Q1 Q3 Q1 Q3 Q1 Q3 Q1 Q3 Q1 Q3 Q1 Q3 Q1 Q3
2011 2012 2013 2014 2015 2016 2017 2018 2019 2020
Factory Gate Price ($/Wac)
Microinverters
(string)
(string)
(central)
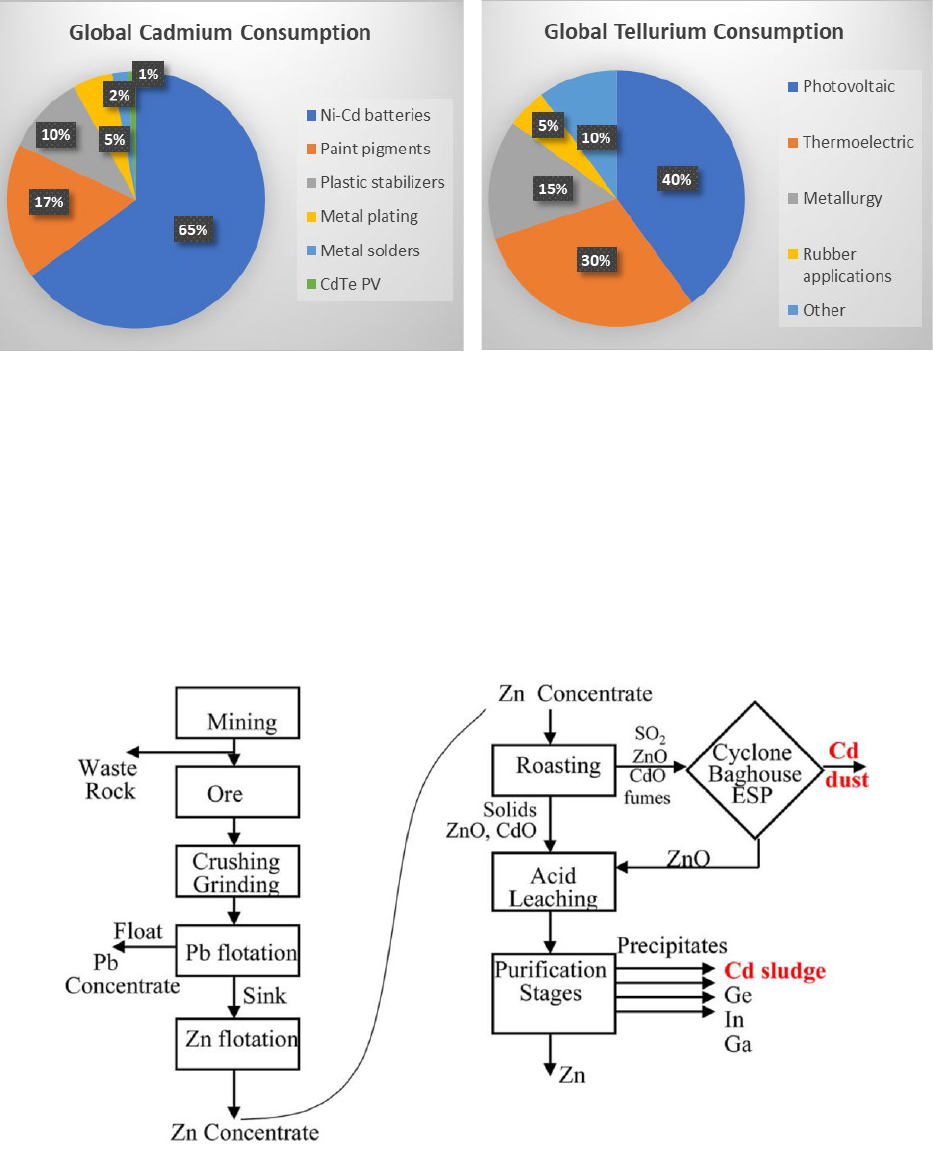
SOLAR PHOTOVOLTAIC S SUPPLY CHAI N DEEP DIVE ASSESSMENT
64
Figure 68. The primary products that use Cd (2004) and Te (2019).
Sources: (V. Fthenakis 2007; Anderson 2020)
Zinc concentrates are made by a process known as beneficiating, where the steps include crushing, grinding,
and a flotation process (Figure 69). An estimated 90-98% of Cd present in Zn ores is recovered through this
beneficiating process (including the original mining step) (Llewellyn 1994). Subsequently, the Zn concentrates
are transferred to smelters/refiners to isolate and produce the primary metals. The smelting process is shown on
the right side of Figure 69, where metallic precipitates from the three-step purification step (Cd, germanium
(Ge), indium (In), and gallium (Ga)) go through electrowinning stations. The extracted Cd is formed into
briquettes and further melted, and this refined metallurgical-grade Cd is 99.95% pure.
Figure 69. Cd flows in Zn mining and refining.
Source: (V. Fthenakis 2007)
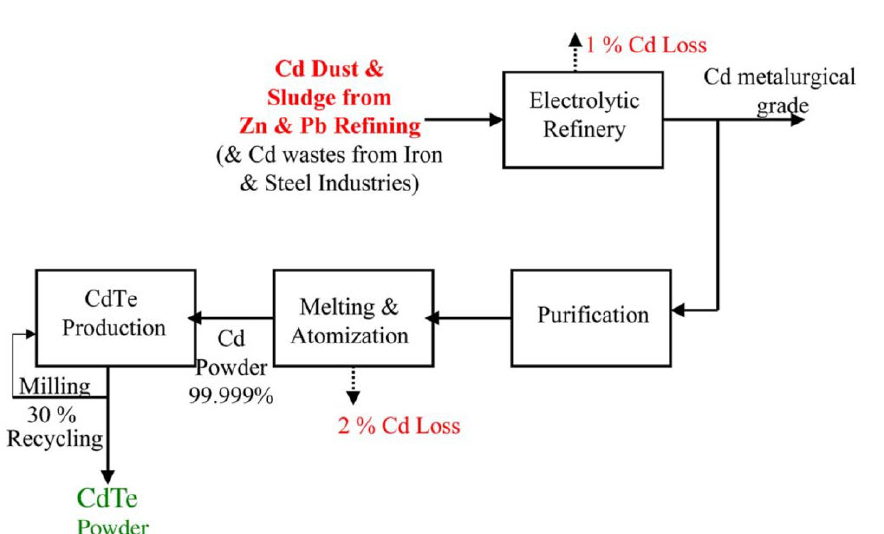
SOLAR PHOTOVOLTAIC S SUPPLY CHAI N DEEP DIVE ASSESSMENT
65
While the production of Cd may not depend on the PV market, using Cd in PV modules provides a safe
product to encapsulate (i.e., store) and utilize this hazardous element. If the Cd produced in Zn refineries is not
used, the material needs to be disposed of safely. Much consideration must be given to disposal via landfills
because Cd is a toxic element.
Currently more than 90% of Te is recovered from what are known as slimes, which are formed in the process
of electrolytic refining of Cu. The extraction process of Te has been reported as a challenging and complicated
process involving a variety of possible techniques depending on the Cu source including oxidizing roasting
followed by leaching with water and electrowinning or sulfa tion followed by roasting, caustic leaching, and
electrolysis (Makuei and Senanayake 2018).
However, using Cd and Te in CdTe modules requires purity beyond the standard commercial-grade ingots.
Typical ingots are 3.5N (99.95% pure), while 5N (99.999% pure) to 6N (99.9999% pure) is needed for both
Cd and Te in modules. Once both high purity Cd and Te are produced, high purity powders are produced by
electrolytic purification followed by atomization or via vacuum distillation (Figure 70).
Figure 70. High purity CdTe production flow.
Source: (V. Fthenakis 2007)
2.8.1.2 Industry Overview
The United States imported the required Cd needed for domestic production predominantly from China, South
Korea, Japan, and Canada (USGS, 2021a). Two U.S. companies also refined Cd in 2020 (Callaghan 2020).
One company located in Tennessee refined Cd using Zn ores, while the second company (located in Ohio)
recovered Cd from spent nickel-cadmium (Ni-Cd) batteries. First Solar claims to be capable of recovering 90%
of its materials through recycling of its modules, with scalable capacity to accommodate the anticipated high
volume as modules reach their end of life after 25 or more years. However, few modules have been recycled to
date, so the ultimate recycling capacity and recovery fraction have yet to be demonstrated.
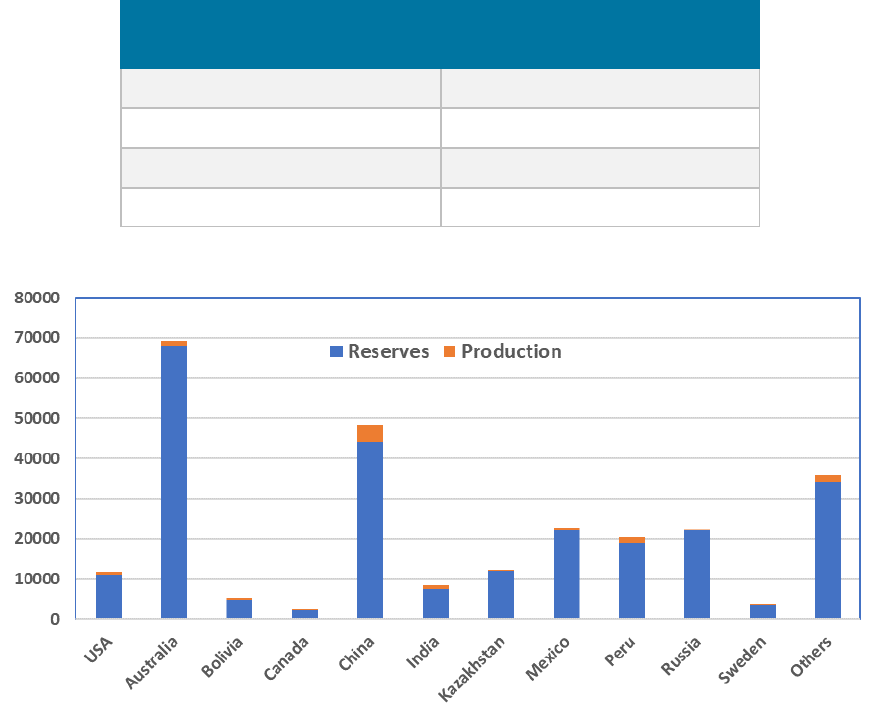
SOLAR PHOTOVOLTAIC S SUPPLY CHAI N DEEP DIVE ASSESSMENT
66
Because Cd is mined as a byproduct of other ores with a highly variable concentration, it is not possible to
accurately estimate Cd global reserves (Ta ble 5). However, the United States refined and produced 750,000
MT of Zn ores in 2019, with an expected Cd content over 200 MT (USGS, 2021a). Given that the estimated
Cd material needed per GW
dc
of CdTe PV modules is 50 MT (50 milligrams per watt), the 11,000,000 MT of
Zn reserves in the United States is enough to supply Cd for about 50 GW
dc
of CdTe modules. The 250,000,000
MT of global Zn reserves are enough to supply Cd for about 1000 GW
dc
of CdTe modules (Figure 71).
Table 5. Cd content in various mineral feedstocks.
Material
Cd concentration range
(ppm)
Zn ores
0.1 - 2000
Zn ore concentrate
3000 - 5000
Copper ore concentrate
30 - 1200
Iron ore
0.12 – 0.30
Source: (V. Fthenakis 2007)
Figure 71. Global Zn reserves and production (kilotonnes).
Source: (A. Tolcin 2020)
The availability of rare Te is a more acute concern. Estimated global production and reserves are shown in
Figure 72. The main countries that produce Te are Sweden, Japan, Russia, China, the United States, and Peru.
Two mining districts, one in Southwest China and one in Skellefte VMS district, Sweden, account for 15% of
annual global production. Tellurium reserves in the United States represent approximately 15% of the global
total (“Tellurium: The Bright Future of Solar Energy,” n.d.). Based on publicly available information, the U.S.
reserves of 3500 MT of Te are located in Montana, Alaska, and Colorado (Karl 2019).
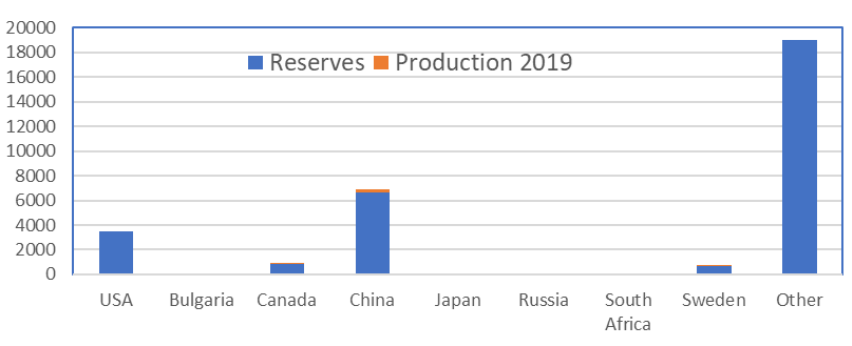
SOLAR PHOTOVOLTAIC S SUPPLY CHAI N DEEP DIVE ASSESSMENT
67
Figure 72. Global tellurium reserves and annual production (MT). “Other” is from nine countries.
Source: (Anderson 2020)
The estimated Te material needed per GW
dc
of CdTe PV modules is 50 MT (50 milligrams per watt). The
30,000 MT of global reserves of Te are enough for 600 GW
dc
of CdTe modules. However, the rate at which
these reserves can be extracted cost-effectively is limited by their production as a byproduct of Cu refining.
The world production of Te was estimated to be about 520 MT in 2019 and 490 MT in 2020 (USGS, 2021a).
While the future global production of Te is somewhat uncertain, it appears to be sufficient to support the
annual production of not more than 20 GW
dc
of CdTe modules for thirty years.
The United States imported the required Te needed for domestic CdTe module production predominantly from
Canada, China, and Germany (Karl 2019). There was no refining or production of Te in the United States from
2015 – 2019, but in 2020 one company in Texas was thought to export Cu anode slimes to Mexico for
recovery of commercial-grade Te (USGS, 2021a). In March 2021, First Solar said it was in talks with the
mining group Rio Tinto, which plans to spend $3 million on a facility in Utah to recover Te (Wagman 2021).
However, the purity of Te needed for CdTe modules is higher than the commercial-grade Te ingots, so the
ingots are further refined in an additional step, for which the main supplier to U.S. companies is 5NPlus, a
Canadian company.
Given the limited availability of Te as raw material, recovering and recycling it from modules at their end of
life has been proposed (Marwede and Reller 2012). However, due to the long service life of PV panels, it
would take several decades before recycled Te could supply a significant fraction of the Te required, and if the
annual demand for CdTe modules grows with time, it will take even longer. As noted above in the discussion
of Cd, First Solar claims to be capable of recovering 90% of its materials through recycling of its modules, but
few modules have been recycled to date, so the ultimate recycling capacity and recovery fraction have yet to be
demonstrated.
2.8.2 Module Fabrication
2.8.2.1 Technology Overview
The substantial majority of thin-film manufacturing capacity uses CdTe technology. The fabrication process
can be done in various ways, but typically these materials are deposited directly onto the glass of the solar
module, making the manufacturing process (Figure 73) far more integrated than the various steps of c-Si
module production.
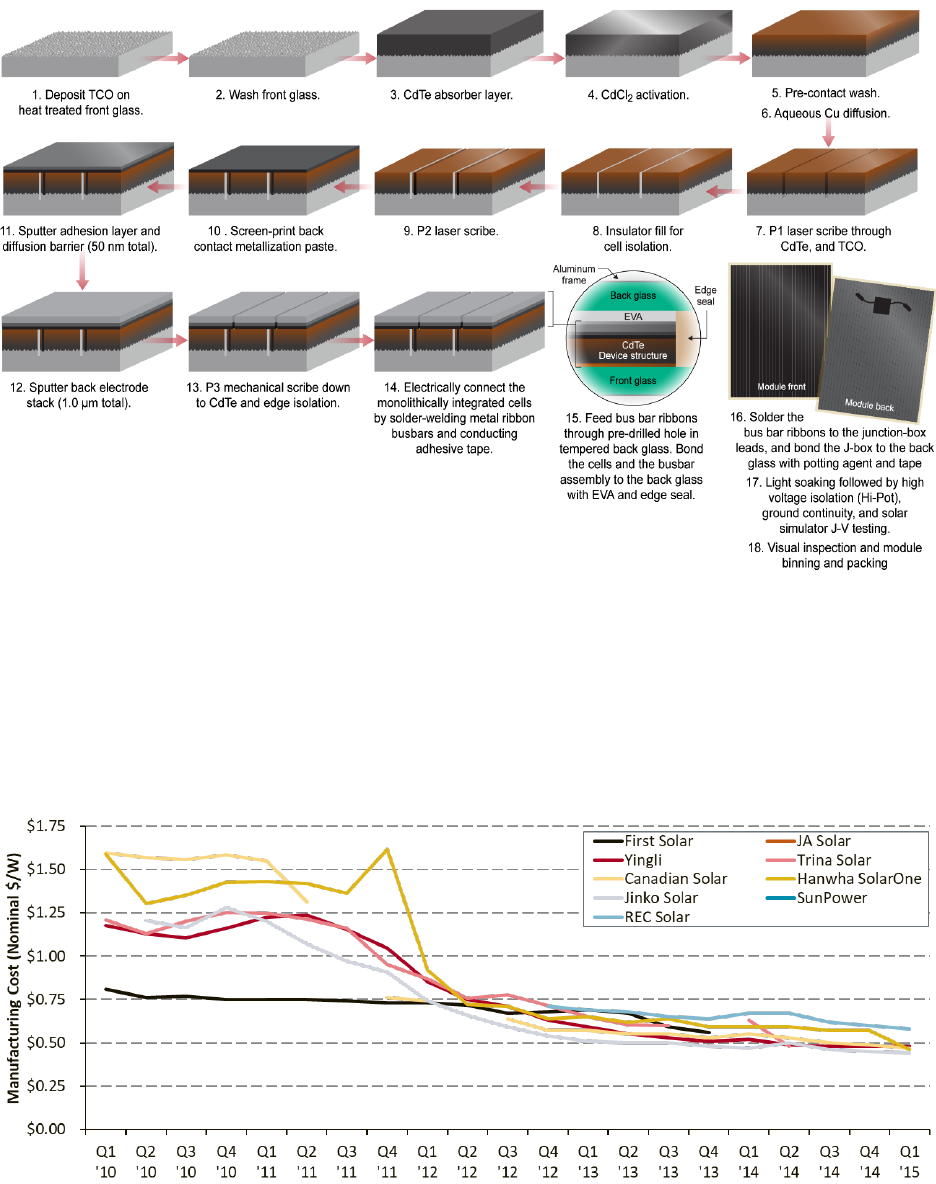
SOLAR PHOTOVOLTAIC S SUPPLY CHAI N DEEP DIVE ASSESSMENT
68
Figure 73. Process flow for making CdTe modules.
Source: NREL
2.8.2.2 Industry Overview
When global polysilicon prices rose dramatically in the late 2000s owing to supply constraints, PV modules
that did not require polysilicon, including CdTe, gained significant market share. As shown in Figure 74, First
Solar had a significant manufacturing cost advantage over its c-Si module competitors prior to 2012.
Figure 74. Manufacturing cost of modules from First Solar (CdTe PV) and various c-Si PV manufacturers.
Source: (Feldman, Boff, and Margolis 2015)
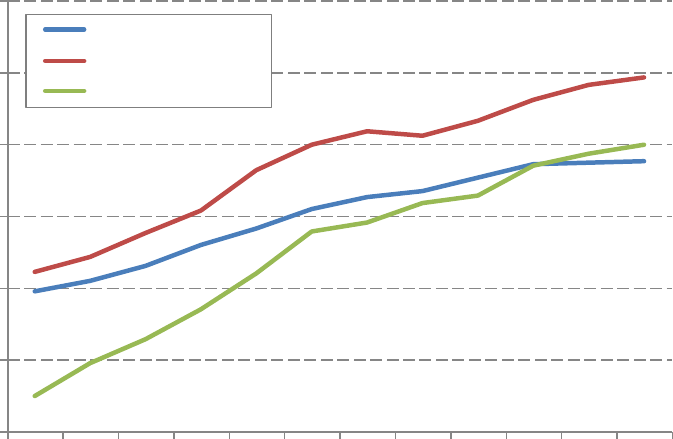
SOLAR PHOTOVOLTAIC S SUPPLY CHAI N DEEP DIVE ASSESSMENT
69
However, as polysilicon production capacity increased and its price fell, the thin-film market share began to
drop. In 2020, CdTe accounted for approximately 4% of global shipments.
Despite having lower efficiency than competing c-Si technology (Figure 75), CdTe has captured a significant
share of the market for utility-scale PV systems in the United States due to its ability to deliver electricity to
the grid at a lower cost. CdTe accounted for approximately 29% of U.S. utility-scale capacity, representing
16% of all U.S. PV capacity through 2020 (Figure 76). The high concentration of global CdTe deployment in
U.S. utility-scale systems is largely due to the market focus of First Solar, which is the leader in CdTe module
manufacturing (Feldman and Margolis 2021). First Solar previously had a utility-scale development arm, and
its module format is now designed specifically for large-sca le a pplica tions.
Figure 75. Efficiencies of c-Si and CdTe modules.
Source: (Feldman and Margolis 2021)
10%
12%
14%
16%
18%
20%
22%
2010 2011 2012 2013 2014 2015 2016 2017 2018 2019 2020 Q1
2021
Module Efficiency
-crystalline
Mono-crystalline
CdTe
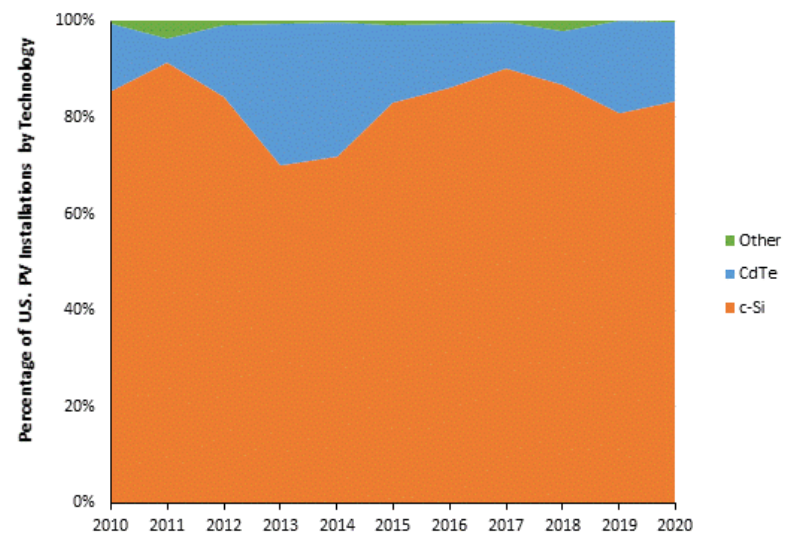
SOLAR PHOTOVOLTAIC S SUPPLY CHAI N DEEP DIVE ASSESSMENT
70
Figure 76. Percentage of U.S. PV installations by technology.
Source: (Mints 2021)
First Sola r ha s manufacturing operations in Malaysia, the United States, and Vietnam. In June 2021, First Solar
announced that it would be expanding its American solar manufacturing capacity by 3.3 GW
dc
a s well a s
adding a facility in India. The new U.S. fa cility will be built in Ohio with an investment of $680 million and is
expected to employ more than 700 people when production starts in 2023. When these new sites come online,
the company will have a total U.S. annual manufacturing capacity of 6 GW
dc
and a global manufacturing
capacity of around 16 GW
dc
(First Solar 2021a). Additiona lly, First Sola r reports tha t the new U.S. fa cility will
become the largest vertically integrated solar manufacturing complex outside of China (First Solar 2021b).
In addition to CdTe, about 900 MW
dc
per year of thin-film modules based on copper indium gallium diselenide
(CIGS) have been produced by Solar Frontier in Japan. However, Solar Frontier recently announced it would
close its CIGS production and switch to making c-Si panels (Bellini 2021c). There have been some
announcements of thin-film manufacturing capacity additions in China, but no evidence of them moving
beyond the pilot-line stage of development (Figure 77).
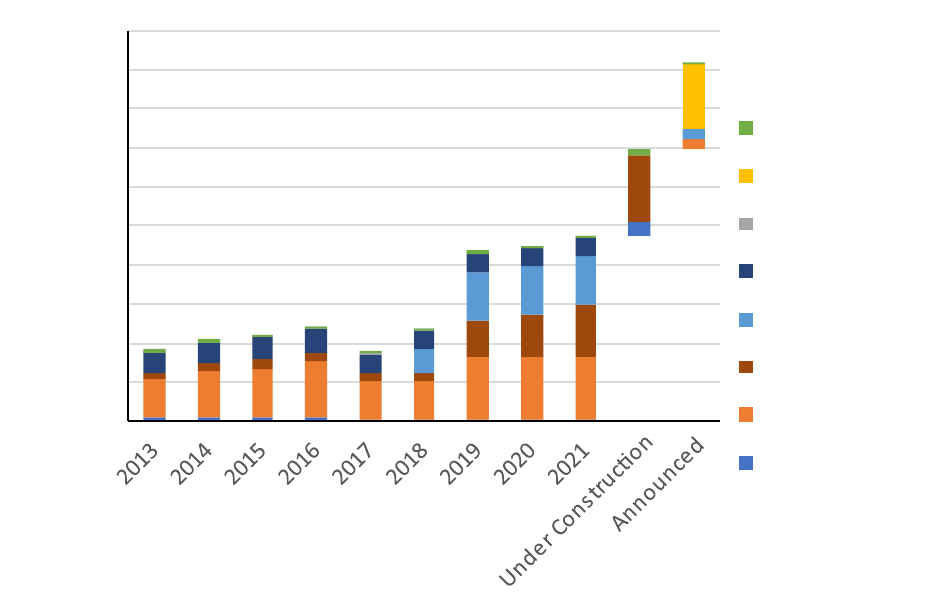
SOLAR PHOTOVOLTAIC S SUPPLY CHAI N DEEP DIVE ASSESSMENT
71
Figure 77. Thin film PV manufacturing capacity by country.
Sources: (First Solar 2021a; BloombergNEF 2021f)
0
2
4
6
8
10
12
14
16
18
20
Manufacturing Capacity (GW)
Other
India
Japan
Uni ted States
Malaysia
China
SOLAR PHOTOVOLTAIC S SUPPLY CHAI N DEEP DIVE ASSESSMENT
72
3 Policy Considerations
3.1 Opportunities and Challenges
The United States has abundant natural resources, a resilient and innovative workforce, highly developed
infrastructure, and a strong culture of intellectual property protection. The key opportunities identified in this
section leverage these U.S. strengths to help overcome associated challenges. The opportunities are presented
here in rank order of their potential to contribute to securing the solar supply chain in the timeframe necessary
to help decarbonize the U.S. power sector by 2035.
3.1.1 Polysilicon Refining
Polysilicon refining is energy intensive compared to the other steps in the solar supply chain, with electricity
representing the biggest production cost after capital asset depreciation. The United States has some of the
lea st-expensive power in the world in the form of hydroelectric power in the Northwest, Upper Midwest, and
Tennessee Valley. Hydropower is an emissions-free source of power, consistent with the intent to use solar
modules to reduce dependence on fossil fuels. Furthermore, the amount of electricity required to produce the
polysilicon used to make solar cells (30 to 80 kWh of electricity per kg of polysilicon) is recovered by
operating the solar power plant for just two to six weeks (3 kg of polysilicon required per kW
dc
of solar
modules divided by the 2000 kWh of ac power delivered each year per kW
dc
of deployed solar modules).
China currently produces a significant portion of its polysilicon using electricity from coal-fired power plants.
As carbon removal from all supply chains becomes a larger priority for countries and companies, this may help
the competitive position of U.S. polysilicon producers.
The United States ha s about 60 kilotonnes per year of polysilicon refining capacity, enough to support the
production of 20 GW
dc
of c-Si m odules annually, equivalent to the current domestic demand. The U.S.
capacity includes one of the world’s largest installations of fluidized bed reactors (FBRs). The FBR process
differs from the more commonly used Siemens process developed in the 1950s in that it uses about half as
much electricity.
The sunk cost in existing polysilicon facilities in the United States is severa l billion dolla rs. These fa cilities a re
mostly, if not fully, depreciated, so they can be operated profitably even at the low selling price necessary to
compete with Chinese polysilicon producers. These facilities are now either idle or have been repurposed to
supply polysilicon to the semiconductor industry.
Re-establishing polysilicon refining in the United States is technically straightforward, but before that process
could start, the polysilicon producers would need to have reliable customers. For the silicon solar supply chain,
those customers would be ingot growers, but at present they are all in China and unwilling to purchase U.S.
polysilicon because China has imposed hefty import duties (see Section 3.3). Unless ongoing trade
negotiations with China alleviate this conflict, it would be necessary to build a new supply chain elsewhere.
That could be in countries aligned with U.S. priorities, or within the United States itself. Either approach
requires substantial investment.
3.1.2 Thin-Film Modules
The United States is the world leader in the commercialization of thin-film module technology, in the form of
CdTe. These modules are assembled directly from commodity materials in a single factory, avoiding the
complexity of multiple production sites that is inherent in c-Si technology. The near monopoly of the United
SOLAR PHOTOVOLTAIC S SUPPLY CHAI N DEEP DIVE ASSESSMENT
73
States in CdTe technology presents an opportunity to expand production up to the limit that CdTe ma teria l
a va ila bility a llows, with little risk of being overtaken by low-cost foreign competition.
Whereas CdTe technology faces a low risk of geopolitical disruption, CdTe technology does come with its
own challenges. Among these is the concentration of capacity for this technology in a single company, First
Solar. Not only does this near monopoly on CdTe production introduce business risk; it also introduces
technology risk. All of First Solar’s production plants are purposefully designed to be as similar as possible for
maximum operational and cost efficiency. If there is a flaw in the production process that does not reveal itself
until after product has been in the field for many years, it will affect essentially every CdTe module deployed.
CdTe also has issues related to its core materials, namely cadmium and tellurium. Cadmium can be toxic, and
tellurium is rare. Attempts to substitute other elements have not been successful. Public concerns about Cd,
reflected in environmental regulations, already limit the market for CdTe technology almost exclusively to
utility-scale solar farms. Tellurium is currently obtained inexpensively as a by-product of copper mining, but
production from that source is nearing saturation in every country other than China. For CdTe to increase its
market share, it would likely need to start sourcing Te from China or using more-expensive methods, either of
which would limit the benefit of relying on this approach.
3.1.3 Module-Assembly Clusters
Efficient module assembly relies on just-in-time logistics for component parts. Having suppliers of the key
components nearby reduces the cost of maintaining inventory while ensuring reliable sourcing. This is
especially important for bulky module components like glass, encapsulant, junction boxes, and aluminum
frames. The United States currently has a cluster of module manufacturers in the contiguous southeastern
states of Alabama, Florida, and Georgia. Concentrating future expansion of module assembly in this region of
the country presents an opportunity to grow a competitive, robust local supply chain for module components
available to all module assemblers in that region.
A potential issue that could arise with a heavy concentration of module assembly in the United States is how
PV hardware is dealt with at its end-of-life. This could become an issue for module assemblers because most
likely they will be held responsible for any recycling necessary to achieve long-term susta ina bility.
3.1.4 Mounting Structures
Mounting structures are composed mostly of heavy, low-cost steel components. International shipping of these
components represents a significant fraction of their cost. All else being equal, this provides an inherent
preference for domestic production relative to imports. Tra ckers are currently used in about half of all large,
open-f ield PV pla nts insta lled globa lly. Tracking is most beneficial in locations with a relatively clear sky,
because there is no benefit in tracking the sun across an overcast sky. The United States has an inherent
advantage for the production and further refinement of trackers relative to most regions of the world due to
having unusually clear skies located near large population centers over a large portion of the country.
Whereas the United States has a lead and inherent advantages in the continuing development of trackers, the
tracking mechanism is only one component in the overall mounting structure, most of which is made of steel.
Alm ost a ll the low-cost steel for PV mounting structures comes from China. Displacing Chinese steel with
domestic steel presents a substantial national challenge across numerous industries, not just solar power.
3.1.5 Silicon Solar Cells
Although there is no current production of c-Si sola r cells in the United States, the United States was once the
world lea der in terrestria l silicon sola r cell technology. Remnants of that expertise are still available that could
SOLAR PHOTOVOLTAIC S SUPPLY CHAI N DEEP DIVE ASSESSMENT
74
be leveraged to help start domestic cell production. Georgia Institute of Technology has been a focus of
advanced c-Si research and development (R&D) since the 1990s and Arizona State University operates a
silicon-cell pilot line for research and training purposes. A challenge is that the United States has lagged in c-Si
R&D over the past two decades, as evidenced by papers published at international PV conferences in the
United States (IEEE PVSC) and Europe (EUPVSEC and SiliconPV). For advanced cell technology, most of
the relevant intellectual property is held by organizations in China, Southeast Asia, and Europe. Even Australia
funds more advanced R&D for c-Si cells than the United States.
Despite the global competition, c-Si cell technology is attractive to pursue domestically because the m a teria ls
used are available in very large quantity, are mostly benign, and have demonstrated long-term dura bility. In a
high-deployment scenario where multiple terawatts of PV are deployed globally, c-Si technology could face
limited a va ila bility of silver, but only if the downward trend in Ag consumption per wafer that has been
demonstrated over the past decade were to stagnate.
3.1.6 Inverter Design
The U.S. has always been the leader in developing global standards for communications, from Morse code to
Wi-Fi. Inverters for PV require communication protocols to respond to emergencies, identify component
failures, and optimize the performance of the grid. The country and companies that establish the new
international standards for communication protocols will have a first-mover advantage, providing a window of
opportunity to restore U.S. competitiveness in PV inverter design and manufacturing. Closely related to
communications protocols is the opportunity to lead in cybersecurity. Domestic inverter manufacturers would
have a market advantage by offering inverters having a reduced risk of containing embedded malware and
other vulnerabilities to cyberattack.
Although inverters can be designed and assembled in the United States, the application-specific integrated
circuits and semiconductor power-handling components are almost entirely produced in Asia. It will be
challenging to significantly reduce the risk of foreign interference in inverters unless the embedded electronic
components are also produced in the United States. Efforts by several large industry sectors to onshore
a pplica tion-specific chip production would reduce the supply risk for solar inverters, as well.
Recent advances have resulted in the more widespread adoption of SiC based power electronics, which have
many advantages, including a higher power conversion efficiency and the ability to handle more power
(Thangavel 2021). As of 2016, the United States (along with Europe and Japan) manufactured a significant
portion of SiC components. The United States does not currently have manufacturing capacity for mounting
the bare SiC devices into a saleable product, but the U.S. could become an exporter of SiC wafers and devices
to Asian countries that currently perform this packaging.
3.1.7 Perovskite Modules
Perovskites are a class of crystalline structures with three components, two of which are typically single atoms
and the third can be either an atom or a small molecule. The set of perovskite m a teria ls in which the sm a ll
molecule is organic and the other two atoms are a metal and a halide have shown remarkable progress in solar
energy conversion efficiency for small-area devices in laboratory settings, climbing from 15% in 2012 to over
25% in 2020, and tandem cells pairing a perovskite top cell with a silicon bottom cell have achieved nearly
30% (NREL n.d.). Perovskites have not been commercialized because the cell efficiency decreases rapidly
with increasing cell size (presumably due to spatial nonuniformity) and, more importantly, the devices degrade
when exposed to simultaneous combinations of heat, light, and water vapor. To date, there has been no
publicly reported result of a perovskite minimodule efficiency over 15% after one month of outdoor operation.
SOLAR PHOTOVOLTAIC S SUPPLY CHAI N DEEP DIVE ASSESSMENT
75
The key to enabling domestic production of perovskite cells is to be the first to discover a way to make full-
size modules that are inherently durable outdoors without sacrificing either cost or performance.
The United States would benefit from being the first to commercialize perovskite technology, but the
challenges are four-fold: (1) It would be unprecedented to develop PV technology in such a short period of
time as to have a significant market impact in the timeframe required for decarbonization by 2035. The
development timeline for all commercially successful PV technologies to date has been measured in decades,
not years. (2) Maintaining support for technology development over decades requires evidence of commercial
success along the way. Perovskites have not yet found a niche market to support early commercialization. (3)
The perovskite devices that have shown the highest levels of performance contain water-soluble lead. Either an
adequate replacement for lead must be identified or a highly reliable means of preventing the lead from
leaching into the environment must be developed. (4) The United States faces intense competition from China,
Europe, and Japan in the commercialization of perovskites. Europe was an early leader in perovskite research
and one company based in the United Kingdom claims it will start operating a 100 MW
dc
production line in
Germany in 2022 (Oxford PV 2021). GCL in China has been operating a 10 MW
dc
perovskite production line
since 2019 with announced plans for 100 MW
dc
(GCL 2019), though with no sales reported to date.
3.1.8 Kerfless Wafers
Sawing wafers wastes about one-third of the silicon ingot as sawdust (“kerf”). Since the 1980s, this has
motivated a search for alternatives that avoid the sawing step altogether. The approaches tried to date fall into
four groups: (1) Pull ribbons out of a molten bath of silicon, using various techniques to maintain the shape of
the ribbon. (2) Grow silicon films from m olten silicon on dissimila r substra tes. (3) Deposit silicon from the gas
phase onto substrate silicon wafers and subsequently removing the substrate for reuse. (4) Clea ve the silicon
ingot instead of sawing it. To date, none of these methods have been commercially successful relative to of
conventional ingot growth and wire sawing. However, researchers continue to explore variations on each of the
above themes because the cost advantage if successful is substantial and market acceptance is a lm ost certa in
for any wafer that meets the specifica tions of cell producers.
3.1.9 Concentrating Solar Thermal Power
One way to avoid the supply-chain risks in the solar PV supply chain is to use a technology other than
photovoltaics to convert sunlight into electricity. Concentrating solar thermal power uses tracking structures to
support mirrors instead of PV modules. The mirrors, which can be readily produced domestically, focus
sunlight onto a receiver, where it heats a material that drives a turbine-generator. The hot material can be
stored inexpensively to drive the generator after the sun sets. Approaches using focused sunlight only work
well when the sky is essentially free of haze or clouds, so they are limited to arid regions like the southwestern
United States. First-generation approaches used linear parabolic mirrors to heat oil or water. Second-genera tion
approaches used a field of mirrors focused on a central receiver tower to heat molten salt. These early attempts
had technical success but have not been economically competitive. A third generation of the central-receiver
approach could supplement PV to help achieve decarbonization goals if the turbine generator can be operated
at a higher temperature to increase its energy conversion efficiency.
3.2 Current Policies in the United States
3.2.1 Incentives
At the federal level, the United States has implemented many measures to encourage domestic PV
manufacturing. The American Recovery and Reinvestment Act of 2009 (ARRA) included a tax credit for
investments in manufacturing facilities for clean energy technologies. The Section 48C Advanced
SOLAR PHOTOVOLTAIC S SUPPLY CHAI N DEEP DIVE ASSESSMENT
76
Manufacturing Tax Credit originally provided a 30% investment tax credit to 183 domestic clean energy
manufacturing facilities valued at $2.3 billion (DOE 2012). However, many of the tax credits awarded were
not claimed, either because rapidly changing market conditions led the awardee not to proceed or because they
were unable to generate a taxable profit.
ARRA also included the Section 1705 Loan Program, which expanded the authority of the DOE Loan
Programs Office (LPO). The LPO received 42 applications for solar manufacturing projects, performed due
diligence on 16, provided a conditional commitment to 5, and closed 4 transactions for $1.3 billion. Due in
large part to the significant time it took to close these transactions and the rapid reduction in PV module prices
over the same period, the 4 transactions were not successful, with two of the recipients going bankrupt and the
other two not moving forward with the loan.
The United States has also encouraged U.S. PV manufacturing using federal procurement. Part of this is
sim ply increasing domestic solar demand, helped by GW-level commitments by each of the armed forces. The
United States Agency for International Development (USAID) requires that at least 50% of renewable energy
technology procured be manufactured in the United States (CRS 2021).
At state and municipal levels, policies intended to support domestic PV manufacturing have included grants,
tax exemptions, land provision, and consumer incentives for purchasing domestic PV products (B. L. Smith et
al. 2021; Feldman, Smith, and Margolis 2020). Consumer incentives for locally-made or domestic products
have consistently been ruled to be in violation of international trade law (Trachtman 2019).
3.2.2 Tariffs
The United States has attempted to support domestic PV manufacturing through the implementation of several
tariffs over the past 10 years. Its first two sets of tariffs, in 2012 and 2014, were Antidumping and
Countervailing Duties (AD/CVD) placed on Chinese (and to a lesser extent Taiwanese) PV modules and cells.
This resulted in Chinese companies shifting manufacturing to Southeast Asian countries, while U.S. PV
manufacturing continued to contract, with many businesses closing or filing for bankruptcy.
The United States has also instituted AD/CVD on imported MGS. In 2018, the United States Department of
Commerce (DOC) instituted AD/CVD, ranging from 2% to 100%, on MGS coming from Australia, Brazil,
Kazakhstan, and Norway (Reuters 2018). In 2021, DOC determined that dumping was occurring in the United
States from Malaysia, Bosnia and Herzegovina, Iceland, and Kazakhstan. The United States International
Trade Commission affirmed that U.S. industry was injured as a result, leading DOC to institute tariffs up to
160% (U.S. International Trade Commission 2021; International Trade Administration 2021).
In 2018, the U.S. government put in place a 4-yea r safeguard tariff (Section 201 tariff) on nearly a ll imported
PV cells a nd modules, exempting the first 2.5 GW
dc
of PV cells to support domestic module assembly, plus
additional tariffs (Section 301 tariff) on Chinese products, including solar products. The Section 201 tariff,
which started at 30% and reduced to 15% in its fina l yea r, is credited with an increase in domestic PV module
assembly, though it has not resulted in expanded U.S. PV cell manufacturing. The tariffs are also credited as a
major factor in the recent scale-up of U.S. PV thin-film CdTe module manufacturer, First Sola r, which benefits
from the increased market price of competing c-Si PV modules.
From October 2020 until November 2021, modules that generated power when illuminated from either the
front or back surface (bifacial) were excluded from the Section 201 tariff. Bifacial modules are primarily used
in utility-scale PV systems. The bifacial exemption was retained when the tariff was extended for an additional
four years in February 2022, and the exempted cell quota was increased from 2.5 GW
dc
to 5 GW
dc
.
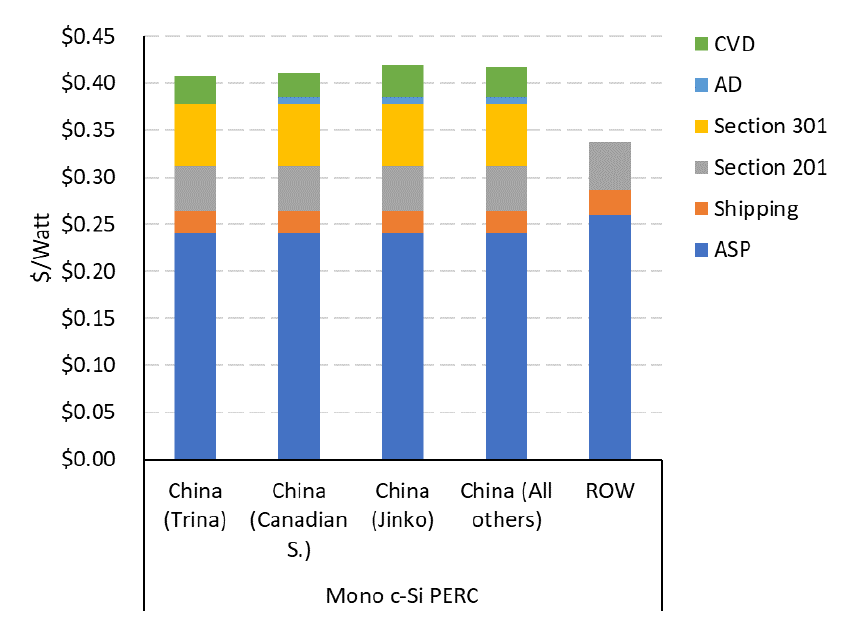
SOLAR PHOTOVOLTAIC S SUPPLY CHAI N DEEP DIVE ASSESSMENT
77
The cumulative effects of the AD/CVD, Section 301, and Section 201 tariffs on different imports are shown in
Figure 78.
Figure 78. Impacts of U.S. tariffs on imported module prices.
Source: NREL
Though many U.S. PV manufacturing facilities have cited PV tariffs as a strong motivator for establishing U.S.
capacity, this was offset to some degree by Section 301 and Section 232 tariffs on ancillary components
upstream in the PV supply chain (B. L. Smith et al. 2021). An example of these tradeoffs is shown in Figure
79, illustrating that Section 301 and Section 232 tariffs add about 17% to the cost of domestic module
assembly, which is similar to the Section 201 tariff on imported modules. Similarly, Section 301 and Section
232 tariffs were reported to make the commissioning of new manufacturing capacity less financially viable due
to reliance on imported equipment and raw metal. Extruding PV racking domestically was also reported to
become unprofitable due to Section 232 tariffs on raw metal. As a result, fully extruded products were
imported instead (B. L. Smith et a l. 2021).
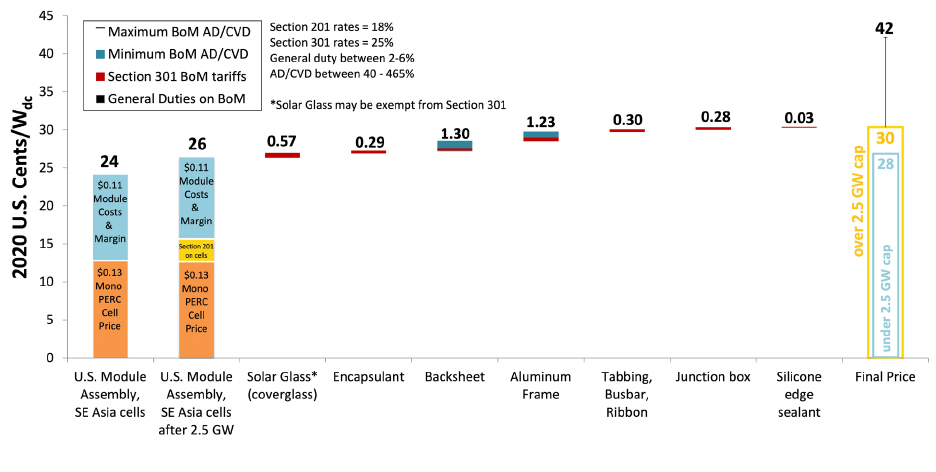
SOLAR PHOTOVOLTAIC S SUPPLY CHAI N DEEP DIVE ASSESSMENT
78
Figure 79. Tariff effects on U.S. module assembly.
Source: NREL
3.2.3 Withhold Release Order
A Withhold Release Order (WRO) requires U.S. Customs and Border Protection (CBP) to detain shipments
upon arrival into the United States that CBP considers at risk of containing material from a prohibited source
until the importer provides evidence that the detained shipment does not contain material from that source. In
June 2021, CBP issued a WRO against shipments containing material produced from silica -based products
made by the Chinese company Hoshine Silicon Industry Co. Ltd and its subsidiaries (CBP 2021). The WRO
was issued following reports by Horizon Advisory and then Sheffield Ha lla m University tha t linked Hoshine
to forced labor in the Chinese province of Xinjiang. The Hoshine WRO is pa rt of a la rger U.S. government
effort addressing forced labor in Xinjiang. In January 2021, the CBP also issued a WRO on cotton and
tomatoes from Xinjia ng.
Hoshine is the world’s largest producer of metallurgical-grade silicon (MGS), also known as silicon m eta l.
MGS is the primary feedstock for making refined polysilicon that, in turn, is the primary feedstock for
producing c-Si PV cells a nd modules. Hoshine’s silica -based products are a lso used in a wide variety of other
industries, including the production of aluminum alloys, stainless steel, silicone adhesives, and cosmetics. In
2017, 12% of MGS globally went to the solar industry (Chalamala 2018), but the fraction of Hoshine’s
production used in the silicon sola r supply chain has not been reported.
PV companies have reported that it has been difficult for c-Si producers to prove that their cells a nd modules
contain no Hoshine MGS. The American Clean Power Association, a solar trade organization, polled major
module suppliers that import from Southeast Asia in December 2021 and reported to DOE that c-Si module
imports in 2021 were reduced by 7 GW
dc
from the expected 25 GW
dc
as a direct result of the Hoshine WRO.
This 7 GW
dc
is comprised of 1.5 GW
dc
that was held at ports of entry (and could eventually be released or
diverted to other countries), 1 GW
dc
that was already diverted to other countries, and 4.5 GW
dc
that was never
produced because of the uncertainty of suppliers’ ability to import manufactured goods to meet demand. The
SOLAR PHOTOVOLTAIC S SUPPLY CHAI N DEEP DIVE ASSESSMENT
79
impact of the Hoshine WRO on imported solar products could be even greater in 2022 if efficient MGS
tra cea bility is not established.
3.2.4 Uyghur Forced Labor Prevention Act
The Uyghur Forced Labor Prevention Act (UFLPA) is a bipartisan bill that passed without opposition in both
the House and Senate and was signed into law in December 2021. It prescribes a period of public comment,
followed by a public hearing, and then the development of a strategy for “how best to ensure that goods mined,
produced, manufactured wholly or in part with forced labor in the People’s Republic of China, including by
Uyghurs, Kazakhs, Kyrgyz, Tibetans, and members of other persecuted groups in the People’s Republic of
China, and especially in the Xinjiang Uyghur Autonomous Region, are not imported into the United States.”
The UFLPA assigns the Forced Labor Enforcement Task Force (FLETF), which was created under the United
States-Mexico-Canada Agreement, to create an enforcement plan that includes (but is not limited to) the use of
WROs by CBP. Polysilicon, tomatoes, and cotton are listed as high-priority sectors for enforcement.
The law presumptively prohibits all products either originating in Xinjiang or produced by companies that
participate in Chinese government poverty-allevia tion or pa iring-assistance programs. FLETF is tasked with
creating a list of these entities, developing an enforcement plan, and prescribing a process for exemption based
on effective supply-chain tracing to prove with “clear and convincing evidence” that an entity’s goods are not
produced using forced labor. The impact of UFLPA on the solar supply chain is not yet known but could be
profound over the years that UFLPA is in effect (2022 – 2029) if the Chinese government prevents solar
companies from providing the documentation required by FLETF to prove their goods are compliant.
3.3 Current Policies in Other Countries
In 2014, China finalized duties on imported polysilicon from the United States and South Korea for 5 years,
made adjustments in 2017, and then extended the tariffs for another 5 years in 2019 (Bellini 2020). The duties
against the U.S. were related to the Internal Revenue Service (IRS) 48C tax credit. Duties were also imposed
on South Korea to further protect China’s emerging polysilicon industry.
As shown in Ta ble 6, the average Chinese tariff on U.S. polysilicon is ~55%, which would add $0.015 –
$0.05/watt. As a result, most U.S. polysilicon capacity has been idled or is significantly underutilized. The
tariff on South Korean polysilicon ranges from 4.4% to 113.8%. As a result, most South Korean polysilicon
manufacturers shuttered their sola r-gra de silicon fa cilities. China did not impose duties on European
polysilicon (namely Germany’s Wacker) due to a trade agreement signed in 2013.
Before 2014, “processing trade” rules had allowed Chinese manufacturers to avoid Chinese import ta riffs if the
finished product wa s exported, but China’s Ministry of Commerce closed the duty-free loophole.

SOLAR PHOTOVOLTAIC S SUPPLY CHAI N DEEP DIVE ASSESSMENT
80
Table 6. Chinese duties on U.S. and South Korean polysilicon.
AD Duties
CVD
Total Duties
U.S. Companies
REC Solar 57.0% 0.0% 57.0%
Hemlock 53.3% 2.1% 55.4%
MEMC/SunEdison
53.6%
0.0%
53.6%
AE Polysilicon 57.0% 2.1% 59.1%
Remaining companies 57.0% 2.1% 59.1%
South Korean Companies
Woongjin Polysilicon 12.3%
OCI
4.4%
Hanwha 8.9%
SKSS 9.5%
KCC / Korean Advanced Materials/Innovation Silicon 113.8%
Remaining companies 88.7%
Source: USTR
Both France and South Korea have implemented regulations regarding the carbon emissions associated with
the manufacture of PV modules. South Korea requires a determination of carbon footprint to determine which
modules qualify for government subsidies (Stoker 2020), while France uses carbon footprints as a cutoff for
bids to qualify for public tenders.
The European Union imposed duties on Chinese wafers, cells, and modules starting in 2013, but it allowed
manufacturers to avoid such duties if they capped imports and sold products at a minimum price. The EU let
this measure lapse after five years to support Europe’s desire to increase renewable energy deployment
(Blenkinsop 2018).
In 2021, India announced it would place a duty of 40% on all imported modules and a 25% duty on all
imported cells, starting in April 2022. These duties are scheduled to replace the 15% safeguard duties currently
in place on PV imports from China and Malaysia (Bhaskar 2021).
In 2015, Canada placed duties on Chinese crystalline and thin-film modules to protect its domestic module
manufacturing lines (Beetz 2015). These duties were extended in 2021 for 5 years.
SOLAR PHOTOVOLTAIC S SUPPLY CHAI N DEEP DIVE ASSESSMENT
81
3.4 Policy Actions
Significant financial support and incentives from the U.S. government as well as strategic actions focused on
workforce, manufacturing, human rights, and trade will facilitate a global solar industry aligned with U.S.
interests and the reestablishment of robust U.S. domestic solar manufacturing leadership –thus leading to
tremendous benefits for the climate as well as for U.S. workers, employers, and the economy. Below include
vital policy strategies for the executive branch as well as recommendations for Congress to level the playing
field for U.S. manufacturers. These include recommendations for Congress to consider that would directly
address the biggest barrier to manufacturing growth – the higher costs of manufacturing in the U.S. Also
included below are important policy actions that the U.S. government is either already engaging in or planning
to launch. Several other policy actions and more detail will be included in the full DOE Energy Supply Chain
Policy Strategy Report being released February 24, 2022.
3.4.1 Policy Recommendations for the Legislative Branch
Enact legislation to provide tax incentives to support domestic clean energy manufacturing, including
incentives f or building new facilities, for the ongoing operation of those facilities, and for domestic
content
Tax incentives are needed to provide a clear demand signal and help U.S. manufacturers build and maintain a
competitive edge in clean energy technologies such as solar photovoltaics. To reestablish domestic solar
manufacturing in the U.S., companies that produce and sell solar components will require financial support to
offset the 30 – 40% higher cost of domestic solar production. Expansion of ingot and wafer production should
receive the highest incentive because nearly all the world’s capacity exists inside China, and expansion in these
sectors would have the compounding effect of creating demand for existing U.S. polysilicon producers to run
at full capacity. These tax credits should be enacted for at least a decade to provide the long-term signa l for
companies to establish new production facilities. Renewal for some time thereafter, perhaps at a reduced level,
could be required to maintain domestic competitiveness. Specific actions recommended to Congress for solar
power and other clean energy technologies include:
• To directly address the higher costs of domestic production, establish investment-based and production-
based manufacturing tax incentives specifically targeting critical aspects of the domestic supply chain,
inclusive of materials, components, and logistics. Prioritize silicon ingot and wafer production. The levels
for these incentives should be chosen to fully offset the higher costs of domestic production. For silicon
ingot and wafer production, which is most difficult to locate outside of China, incentives should be
significantly greater than the cost differential to give the best chance of establishing domestic production.
• To accelerate the establishment of new manufacturing capacity, extend, expand, and revise eligibility for
advanced energy manufacturing tax credits (e.g., IRS 48C) to include material processing facilities such as
those for equipment manufacturing facilities such as solar polysilicon, wafers, cells, modules, and other
components.
• As proposed in the Build Back Better Act passed by the House of Representatives in 2021, the federal
government could offer bonuses for sufficiently high domestic content on government-supported energy
projects (e.g., those projects receiving investment or production tax credits) and penalties if domestic
content requirements are not met by the end of 2025.
• Enact legislation to encourage domestic demand and deployment
Extend and revise credits for clean energy deployment, such as the Production Tax Credit (PTC) and
Investment Tax Credit (ITC) to provide stronger incentives for clean energy projects that support domestic

SOLAR PHOTOVOLTAIC S SUPPLY CHAI N DEEP DIVE ASSESSMENT
82
manufacturing and a major increase in family-sustaining jobs. Though policies in support of domestic
manufacturing f a cilities exist or have been proposed,
5
such demand-side incentives may be necessary to
stimulate deployment of components manufactured domestically. To provide demand certainty in support of
domestic manufacturing investment, these tax credits should be in place for at least 10 years and should not
phase out until significant progress has been made toward domestic competitiveness and decarbonization
goa ls.
3.4.2 Policy Strategies Planned for the Executive Branch
Promote adoption & implementation of traceability standards to improve global supply chain
mapping capabilities, instill integrity of product custody, and promote social responsibility of energy
supply chains (DOS, DOE, DOC, DOL, EPA, CBP, NASA, DOD)
In June 2021, Customs and Border Patrol (CBP) issued a withhold release order (WRO) against shipments
conta ining silica -based products made by Hoshine Silicon in Xinjiang, a supplier to polysilicon suppliers, in
response to evidence of forced labor practices. In December 2021, President Biden signed the Uyghur Forced
Labor Prevention Act (UFLPA) into law, which imposes importation limits on goods produced using forced
labor in China, especially the Xinjiang Uyghur Autonomous Region. Building on existing interagency efforts
and to implement UFLPA requirements, the U.S. government will work with the solar industry to promote
implementation of supply chain traceability that provides information about the materials and companies
composing the supply chain for solar products.
Enhance coordination of trade policy across the U.S. government to create f air conditions for the
U.S. solar industry and its workers (DOC, USTR, DOE)
U.S. solar manufacturers have too often faced unfair – a nd illega l – competition from firms that benefit from
foreign, non-market practices such as dumping. The United States has responded with trade remedies designed
to protect domestic manufacturing. Transparent, effective coordination and implementation of these policies is
critical to supporting domestic manufacturing as well as clean energy deployment. The U.S. government will
continue to conduct expert analysis and engage with relevant stakeholders to refine implementation of trade
policies to optimize their effectiveness in leveling the playing field across the supply chain, while removing
barriers to solar deployment.
Leverage federal purchasing power to provide a sustained demand signal f or both domestic clean
energy products and the capability to manuf acture them domestically (DOE, DOD, GSA, SBA, EPA)
Specific actions include: 1) Whenever possible, require domestic content standards for federal procurement of
solar PV systems – including extending Buy American provisions to support domestic content in solar
fa cilities from which electricity is procured, and 2) Leverage the authorities of federal agencies to provide a
strong demand signal for domestic clean energy manufacturing of solar components.
Convene multiple workf orce stakeholders to advance energy workf orce development (DOL, ED)
U.S. government will develop targeted sector-based plans (including solar power) that will include convening
federal agencies, regional employers, state and city governments, labor unions, training partners, and NGOs to
advance skill-adjacent training and registered apprenticeships that will support the large-scale training needs of
energy workers and employers in the sola r industry and other clean energy arenas.
5
For example, §20302 of the proposed America COMPETES Act of 2022 authorizes $3 billion for DOE to
provide grants and direct loans for new and existing facilities that manufacture solar components.
SOLAR PHOTOVOLTAIC S SUPPLY CHAI N DEEP DIVE ASSESSMENT
83
Raise awareness, coordinate, and expand manuf acturing programs (SBA, DOE, DOC, DOD, DOL)
For example:
• The U.S. Sma ll Business Adm inistra tion (SBA) will expand support to Small and Medium Enterprises
(SMEs) and will expand the 504-loan program to include supply chain financing for small businesses with
the working capital and longer repayment terms they need to pay suppliers upfront, access discounts, and
command more attention from suppliers to fulfill orders.
• DOE Loan Programs Office (LPO) will provide federal loan guarantees to solar manufacturers to
incentivize them to build their supply chains in the United States. LPO will further leverage flexibility
provided by the Infrastructure Investment & Jobs Act to co-finance or guarantee state-backed projects that
have been previously too small to apply to LPO directly.
• DOE and other agencies will expand, within their authorities, competitive grants that support domestic
manufacturing ca pa bilities for sola r components and job creation potential. Grants will focus on key areas
that build on U.S. capabilities and developing markets for solar power.
Establish and f und an initiative f or expanding clean technology manuf acturing capacity globally to
achieve the dramatic scale-up in manuf acturing of key climate and clean energy equipment
associated with meeting net-zero commitments (DOE, DOS, DFC, EXIM, USTDA, DOC)
The global market for clean technologies including solar photovoltaics —if we are to meet global climate
goa ls—is simply much larger than the U.S. can fulfill alone. Supporting global development of solar capacity
needed with key partners and allies and in accordance with principles and standards supported by the Build
Back Better World initiative can help secure more resilient, diversified, and sustainable supply chain sourcing
to meet globa l clima te goa ls. Specific a ctions will include:
• Leverage bilateral and multilateral energy dialogues to promote: the expansion of like-minded
manufacturing capacity; the creation of research partnerships between labs and foreign academic
institutions in support of a net zero manufacturing accelerator network; and development of relevant
workforce capacity.
• Examine gaps in domestic manufacturing and align with global locations conducive to the development of
clean energy technology manufacturing. Additionally, expand technical assistance in partner countries to
facilitate development of clean technology supply chain and manufacturing capacity.
• Convene financial institutions to assess available resources and develop uniform criteria for supporting
clean energy manufacturing projects.
Engage government and private sector to continue to support solar technology innovation f rom
research to commercialization to recycling (DOE)
To ensure secure, resilient supply chains for decades to come, it is critical that the United States lead in
innovating, commercializing, and scaling the next generation of solar technologies while continuing to a dvance
existing technologies. It takes decades from invention and initial demonstration to successful
commercialization and scaling of a technology or a process. In addition, investments are needed to support
innovation across the full life cycle, including recycling. DOE will continue to invest through financial
assistance for research, development, and demonstration, LPO direct loan and loan guarantees, as well as
partnering with other agencies to facilitate successful development and tra nsfer of technology to the solar
industry.

SOLAR PHOTOVOLTAIC S SUPPLY CHAI N DEEP DIVE ASSESSMENT
84
Appendix
Stakeholder Outreach
The following stakeholders outside DOE provided input to senior leadership in DOE’s Solar Energy
Technologies Office related to the challenges presented in this report and to express their interest in
participating in the solutions proposed. The dates shown are for teleconferences in 2021 that influenced this
document. Several of these organizations also responded to DOE’s Request for Information (RFI).
Organization
Teleconference Date(s) in 2021
Private Sector
American Clean Power Association
7/27, 8/27, 12/8
Canadian Solar
RFI
Center for Strategic and International S tudies
4/15
Clean Energy Associates
11/19
Clearway
5/27, 9/2
Coalition for a Prosperous America
3/11
EnPhase
8/24
First Solar
3/17, RFI
Hanwha Q-Cells America
3/17, 3/18, 7/15, 8/30, 12/3, RFI
Heliene
RFI
Hemlock Silicon
3/17, 11/17, RFI
LG Electronics
3/17
LONGi
3/24, 6/10
NorSun, Norwegian Crystals
3/29, 9/9
Renewable Energy Corporation
3/24, RFI
Senergy Technical Services
7/8
Silfab
RFI
Solar Energy Industries Association
7/9, 8/27, 9/9, RFI
Ultra-Low Carbon Solar Alliance
8/10, RFI
Wacker Chemical Company
3/31, 12/1, RFI
Public Sector
Customs and Border Protection
8/27, 11/19, 12/3
Department of Commerce/ITA
3/3, Weekly 6/3 – 12/17
Department of Labor
6/29, 12/3, 12/17
Department of State
3/3, Weekly 6/1 – 12/17
Department of Treasury
3/3, Biweekly 6/ 10 – 12/17
Development Finance Corporation
Biweekly 6/10 – 12/17
Executive Office of the President/NSC
3/3, 3/18, Biweekly 6/10 – 12/17
Executive Office of the President/USTR
3/3, Biweekly 6/10 – 12/17
Executive Office of the President/WHO
3/3, 3/4, 3/18, Biweekly 6/10 – 12/17
USAID
6/29, 7/9, 7/16, 11/5, 12/3
SOLAR PHOTOVOLTAIC S SUPPLY CHAI N DEEP DIVE ASSESSMENT
85
List of Acronyms
ac
alternating current
AD antidumping
Al-BSF aluminum back surface field (c-Si PV cell structure)
ASP
average selling price
ARRA American Recovery and Reinvestment Act
CBP United States Customs and Border Protection
CdTe
ca dmium telluride (PV module technology)
c-Si crysta lline silicon (PV module technology)
CVD countervailing duties
Cz
Czochralski (silicon ingot growth method)
dc direct current
DFC United States International Development Finance Corporation
DOC
United States Department of Commerce
DOD United States Department of Defense
DOE United States Department of Energy
DOL
United States Department of Labor
DOS United States Department of State
DS directiona l solidifica tion (silicon ingot growth method)
ED
United States Department of Education
EPA United States Environmental Protection Agency
EVA ethylene vinyl acetate (PV module encapsulation material)
EXIM
Export-Import Bank of the United States
FBR fluidized bed reactor (polysilicon refining method)
GSA United States General Services Administra tion
GW
dc
gigawatts (dc power rating under standard test conditions)
IGBT insula ted-gate bipolar transistor
SOLAR PHOTOVOLTAIC S SUPPLY CHAI N DEEP DIVE ASSESSMENT
86
IRS
United States Internal Revenue Service
ITC
Investment Tax Credit
ITRPV International Technology Roadmap for Photovoltaics
LPO
DOE Loan Programs Office
kW
dc
kilowatts (dc power rating under standard test conditions)
kWh kilowa tt-hour (units for electrical energy)
MGS
meta llurgica l-gra de silicon (silicon m eta l)
MT
metric tonne (1000 kg)
MW
dc
megawatts (dc power rating under standard test conditions)
NASA
National Aeronautics and Space Administration
NREL
National Renewable Energy Laboratory
PERC passivated emitter and rear cell (c-Si PV cell structure)
PET
polyethylene terephthalate (a form of polyester)
POE
polyolefin elastomers (PV module encapsulation material)
PTC Production Tax Credit
PV
photovoltaic (adjective) or photovoltaics (noun)
PVDF
polyvinylidene fluoride (PV module backsheet material)
PVF polyvinyl fluoride (PV module backsheet materia l)
ROW
rest of world
SBA
United States Sm a ll Business Administra tion
SiC silicon ca rbide (power electronics device material)
USAID
United States Agency for International Development
USGS
United States Geological Survey
USTDA United States Trade and Development Agency
USTR
United States Trade Representative
WRO
withhold release order
SOLAR PHOTOVOLTAIC S SUPPLY CHAI N DEEP DIVE ASSESSMENT
87
List of Figures
Figure 1. Illustrations of a utility-scale PV system (left) and a commercial rooftop system (right)........... 1
Figure 2. U.S. PV price reductions and annual deployment growth. ................................................... 2
Figure 3. U.S. PV Installations, 2021-2030 .................................................................................... 3
Figure 4. U.S. PV module production and imports........................................................................... 4
Figure 5. U.S. PV module imports by region. ................................................................................. 4
Figure 6. U.S. silicon cell imports by region................................................................................... 5
Figure 7. U.S. production of PV components and U.S. PV installations over time. ............................... 6
Figure 8. PV manufacturing capacity and deployment, inside and outside China. ................................. 8
Figure 9. PV manufacturing in Southeast Asia, 2020. ...................................................................... 9
Figure 10. Production costs for c-Si PV manufacturing in the United States and China. ...................... 10
Figure 11. Production costs for CdTe PV manufacturing in the United States and Southeast Asia. ........ 11
Figure 12. Principal sectors of the c-Si supply chain. ..................................................................... 13
Figure 13. Principal input materials and process for MGS production............................................... 14
Figure 14. Global demand for MGS by application........................................................................ 15
Figure 15. Principal locations of MGS production. ........................................................................ 16
Figure 16. China and non-China MGS manufacturing capacity, 2017. .............................................. 17
Figure 17. North American MGS plants. ..................................................................................... 17
Figure 18. Flat glass production by country and number of float lines, 2017. ..................................... 18
Figure 19. Largest EVA-producing countries, 2017. ...................................................................... 20
Figure 20. Market share of backsheet materials, 2019. ................................................................... 21
Figure 21. Production process for aluminum module frames, assuming primary aluminum extraction. .. 22
Figure 22. Producer price index for extruded aluminum and hot rolled steel. ..................................... 23
Figure 23. Steps to produce polysilicon from MGS, Siemens chemical vapor deposition method.......... 24
Figure 24. Polysilicon prices...................................................................................................... 25
Figure 25. Global polysilicon annual manufacturing capacity.......................................................... 26
Figure 26. Polysilicon annual manufacturing capacity by Chinese province. ..................................... 27
Figure 27. Polysilicon production, by manufacturer, 2020. ............................................................. 28
Figure 28. U.S. polysilicon production and excess manufacturing capacity. ...................................... 29
Figure 29. Process flow for making monocrystalline-silicon wafers via Cz crystal growth. .................. 30
Figure 30. Process flow for making multicrystalline-silicon wafers via directional solidification (DS)... 31
SOLAR PHOTOVOLTAIC S SUPPLY CHAI N DEEP DIVE ASSESSMENT
88
Figure 31. Wafer manufacturing capacity in China vs. other locations. ............................................. 32
Figure 32. Wafer manufacturing capacity by Chinese province. ...................................................... 32
Figure 33. Wafer manufacturing capacity outside of China. ............................................................ 33
Figure 34. Wafer manufacturing capacity by company, 2020. ......................................................... 34
Figure 35. U.S. wafer manufacturing capacity. ............................................................................. 35
Figure 36. Process flow for manufacturing standard full-area Al-BSF cells. ...................................... 36
Figure 37. Process flow for manufacturing standard full-area PERC cells. ........................................ 36
Figure 38. Co-location of cell manufacturing with wafer and module manufacturing. ......................... 37
Figure 39. Cell manufacturing capacity by plant size. .................................................................... 38
Figure 40. Cell manufacturing capacity by Chinese province. ......................................................... 39
Figure 41. Cell manufacturing capacity outside of China. ............................................................... 40
Figure 42. Cell production by manufacturer, 2020......................................................................... 41
Figure 43. Wafer, cell, and module manufacturing capacities of some leading cell and module
manufacturers. ................................................................................................................... 42
Figure 44. U.S. cell manufacturing capacity. ................................................................................ 43
Figure 45. Process flow (top) and finished product (bottom) for standard 60-cell monocrystalline-silicon
module assembly................................................................................................................ 44
Figure 46. Module manufacturing capacity by plant size. ............................................................... 45
Figure 47. Module manufacturing capacity by Chinese province. .................................................... 46
Figure 48. Module manufacturing capacity outside of China. .......................................................... 47
Figure 49. Module production by manufacturer, 2020. ................................................................... 48
Figure 50. Average module selling price...................................................................................... 49
Figure 51. U.S. module manufacturing capacity. ........................................................................... 49
Figure 52. U.S. module production and excess production capacity.................................................. 50
Figure 53. Multi-row (left) and single-row (right) tracking systems.................................................. 51
Figure 54. Indicative cost breakdown of trackers, by subcomponent. ............................................... 53
Figure 55. U.S. utility-scale PV installed capacity, by mounting structure. ........................................ 54
Figure 56. U.S. distributed PV panel mounting trends.................................................................... 54
Figure 57. U.S. average PV racking price, by sector. ..................................................................... 55
Figure 58. U.S. PV tracker market share rankings by shipment, 2020. .............................................. 56
Figure 59. Inverter assembly with supporting components.............................................................. 57
Figure 60. Breakdown of silicon carbide inverter material costs. ..................................................... 58
SOLAR PHOTOVOLTAIC S SUPPLY CHAI N DEEP DIVE ASSESSMENT
89
Figure 61. Geographical headquarters of main power semiconductor companies (non-exhaustive list)... 59
Figure 62. Geographical positions of main manufacturing power block locations (non-exhaustive list).. 59
Figure 63. Percent of individual passive components manufactured by region. .................................. 60
Figure 64. Percent of U.S. inverter shipments, by manufacturing headquarters, 2020. ......................... 61
Figure 65. Global inverter manufacturing capacity by company location and application, 2020. ........... 61
Figure 66. U.S. inverter production, manufacturing capacity, and system deployment......................... 62
Figure 67. U.S. inverter pricing by sector..................................................................................... 63
Figure 68. The primary products that use Cd (2004) and Te (2019). ................................................. 64
Figure 69. Cd flows in Zn mining and refining. ............................................................................ 64
Figure 70. High purity CdTe production flow. .............................................................................. 65
Figure 71. Global Zn reserves and production (kilotonnes). ............................................................ 66
Figure 72. Global tellurium reserves and annual production (MT). “Other” is from nine countries. ....... 67
Figure 73. Process flow for making CdTe modules........................................................................ 68
Figure 74. Manufacturing cost of modules from First Solar (CdTe PV) and various c-Si PV
manufacturers. ................................................................................................................... 68
Figure 75. Efficiencies of c-Si and CdTe modules. ........................................................................ 69
Figure 76. Percentage of U.S. PV installations by technology. ........................................................ 70
Figure 77. Thin film PV manufacturing capacity by country. .......................................................... 71
Figure 78. Impacts of U.S. tariffs on imported module prices. ......................................................... 77
Figure 79. Tariff effects on U.S. module assembly. ....................................................................... 78
List of Tables
Table 1. Chinese PV manufacturing by component and province. ...................................................... 9
Table 2. Labor cost drivers across the c-Si and CdTe supply chain................................................... 11
Table 3. Fixed cost drivers across the c-Si and CdTe supply chain. .................................................. 12
Table 4. Components of a tracking system. .................................................................................. 52
Table 5. Cd content in various mineral feedstocks. ........................................................................ 66
Table 6. Chinese duties on U.S. and South Korean polysilicon. ....................................................... 80
SOLAR PHOTOVOLTAIC S SUPPLY CHAI N DEEP DIVE ASSESSMENT
90
References
Aboudi, M. 2011. “Solar PV Balance of System (BOS): Technologies and Markets.” GTM Research.
Anderson, C. Schuyler. 2020 “Tellurium Data Sheet - Mineral Commodity Summaries 2020.” Reston, VA:
U.S. Geological Survey. http://pubs.er.usgs.gov/publication/mds2020.
“Assessment of Critical Thin Film Resources.” n.d. RAF-9-29609, TELLURIUM.
Barbose, Galen, Naïm Darghouth, Eric O’Shaughnessy, and Sydney Forrester. 2021. “Tracking the Sun:
Pricing and Design Trends for Distributed Photovoltaic Systems in the United States 2021 Edition.” Lawrence
Berkeley National Laboratory. https://emp.lbl.gov/tracking-the-sun.
Beetz, Becky. 2015. “Canada Issues Ruling on Anti-Dumping Case, Final Duties Set.” PV Magazine
International. July 6, 2015. https://www.pv-maga zine.com /2015/07/06/canada-issues-ruling-on-anti-dumping-
ca se-fina l-duties-set_100020085/.
Bellini, Emiliano. 2019. “1366 Technologies and Hanwha Q Cells to Open Wafer Factory in Malaysia.” PV
Magazine International. February 26, 2019. https://www.pv-m a gazine.com/2019/02/26/1366-technologies-
and-hanwha-q-cells-to-open-wafer-factory-in-malaysia/.
———. 2020. “China Will Extend Duties on US and South Korean Polysilicon for Another Five Years.” PV
Magazine USA. January 21, 2020. https://pv-magazine-usa.com/2020/01/21/china-will-extend-duties-on-us-
and-south-korean-polysilicon-for-another-five-years/.
———. 2021a. “Jinko Solar Builds 7 GW Wafer Factory in Vietnam.” PV Magazine International. August 17,
2021. https://www.pv-magazine.com/2021/08/17/jinkosolar-builds-7-gw-wafer-fa ctory-in-vietnam/.
———. 2021b. “Silver accounts for 10% of PV module costs.” PV Magazine. March 4, 2021. https://www.pv-
magazine.com/2021/03/04/silver-currently-accounts-for-10-of-pv-module-costs/.
———. 2021c. “Solar Frontier abandons thin-film, launches 250 W monocrystalline panel.” PV Magazine.
November 1, 2021. https://www.pv-maga zine.com/2021/11/01/sola r-frontier-abandons-thin-film-launches-
250-w-monocrystalline-panel/.
Bernreuter, Johannes. n.d. “Polysilicon Manufacturers: Global Top 10 | Bernreuter Research.” Accessed
October 13, 2021. https://www.bernreuter.com/polysilicon/manufacturers/.
BGS. 2021. “British Geological Survey: World Mineral Production.” BGS.
https://www2.bgs.ac.uk/mineralsuk/download/world_statistics/2010s/WMP_2015_2019.pdf.
Bhaskar, Gireesh Chandra Prasad, Utpal. 2021. “Steep Import Duty on Solar Cells, Modules from Apr ’22.”
Mint. March 10, 2021. https://www.livemint.com/news/india/india-to-impose-steep-customs-duty-on-sola r-
cells-modules-from-a pril-2022-11615387885538.html.
Blenkinsop, Philip. 2018. “EU Ends Trade Controls on Chinese Solar Panels.” Reuters, August 31, 2018, sec.
Business News. https://www.reuters.com/article/us-eu-china-tra de-idUSKCN1LG1QM.
BloombergNEF. 2021a. “Bloomberg NEF ‘Solar Spot Price Index’ Interactive Dataset.” BloombergNEF.
2021.
———. 2021b. “Bimonthly PV Index, March 2021: Prices Higher Again, Likely Unsustainable.”
BloombergNEF.
SOLAR PHOTOVOLTAIC S SUPPLY CHAI N DEEP DIVE ASSESSMENT
91
———. 2021c. “2Q 2021 Global PV Market Outlook.” BloombergNEF.
https://www.bnef.com/insights/26419.
———. 2021d. “New Energy Outlook 2021.” BloombergNEF.
https://www.bnef.com/login?r=%2Fflagships%2Fnew-energy-outlook.
———. 2021e. “Solar Manufacturers’ 2020 Production.” BloombergNEF.
———. 2021f. “BloombergNEF ‘Equipment Manufacturers’ Interactive Dataset.” BloombergNEF. July 28,
2021. https://www.bnef.com/interactive-datasets/2d5d59acd9000000?data-hub=1.
Bolinger, Mark, Joachim Seel, and Dana Robson. 2019. “Utility-Sca le Sola r: Em pirica l Trends in Project
Technology, Cost, Performance, and PPA Pricing in the United States –2019 Edition.” Berkeley, CA:
Lawrence Berkeley National Laboratory.
Callaghan, Robert M. 2020. “Cadmium Data Sheet - Minera l Com m odity Summaries 2020.” Reston, VA: U.S.
Geological Survey. http://pubs.er.usgs.gov/publication/mds2020.
CBP. 2021. “The Department of Homeland Security Issues Withhold Release Order on Silica-Based Products
Made by Forced Labor in Xinjiang.” U.S. Customs and Border Protection. June 24, 2021.
https://www.cbp.gov/newsroom/national-media -release/department-homeland-security-issues-withhold-
release-order-silica .
Chalamala, Babu. 2018. “Manufacturing of Silicon Materials for Microelectronics and PV.” SAND2018-
1390PE. Sandia National Lab. (SNL-NM), Albuquerque, NM (United States).
https://www.osti.gov/biblio/1497235.
Chin, Stephen, Patrick Hummel, Jean-Francois Meymandi, Mahavir Sanghavi, and Matthew Akers. 2012.
“Global Solar Industry Update.” 2012, Volume 6. UBS Investment Research.
Chunduri, Shravan K., and Michael Schmela. 2020. “Market Survey: Backsheets & Encapsulation 2020.”
Taiyang News.
http://taiyangnews.info/TaiyangNews_Market_Survey_on_Backsheets_&_Encapsulation_2020_9%20Oct.pdf.
Congressional Research Service. 2018. “Domestic Solar Manufacturing and New U.S. Tariffs.” Congressional
Research Service. https://crsreports.congress.gov/product/pdf/IF/IF10819.
CRS. 2021. “The Buy American Act and Other Federal Procurement Domestic Content Restrictions.” R46748.
Congressional Research Service. https://crsreports.congress.gov/product/pdf/R/R46748.
DOE. 2012. “Fact Sheet: 48C Manufacturing Tax Credits.” U.S. Department of Energy.
https://www.energy.gov/sites/prod/files/FACT%20SHEET%20--
%2048C%20MANUFACTURING%20TAX%20CREDITS.pdf.
Eckhouse, Brian, and Joe Deaux. 2019a. “Unintended Fallout of Trump Steel Duty: Solar Buying Abroad.”
Bloomberg.
———. 2019b. “Unintended Fallout of Trump Steel Duty: Solar Buying Abroad.” February 27, 2019.
https://www.bloomberg.com/news/articles/2019-02-27/the-unintended-fallout-of-trump-steel-tarif f-sola r-
going-abroad.
EIA. 2021a. “Electric Power Monthly - U.S. Energy Information Administration (EIA).” February 2021.
https://www.eia.gov/electricity/monthly/index.php.
SOLAR PHOTOVOLTAIC S SUPPLY CHAI N DEEP DIVE ASSESSMENT
92
———. 2021b. “Solar Photovoltaic Cell/Module Shipments.” Energy Information Administration.
https://www.eia.gov/renewable/annual/solar_photo/.
EOP 2021. “The Long-Term Strategy of the United States: Pathways to Net-Zero Greenhouse Gas Emissions
by 2050.” The United States Department of State and the United States Executive Office of the President.
November 2021.
Feldman, David, Dan Boff, and Robert Margolis. 2015. “Q1/Q2 2015 Solar Industry Update.” Presented at the
Internal Presentation to DOE, July 28.
Feldman, David, and Robert Margolis. 2021. “H1 2021 Solar Industry Update.” June 22.
https://www.nrel.gov/docs/fy21osti/80427.pdf.
Feldman, David, Vignesh Ramasamy, Ran Fu, Ashwin Ramdas, Jal Desai, and Robert Margolis. 2021. “U.S.
Solar Photovoltaic System and Energy Cost Benchmark: Q1 2020.” NREL/TP-6A20-77324. January 2021.
Feldman, David, Brittany Smith, and Robert Margolis. 2020. “Analysis of U.S. Solar Manufacturing & Global
Manufacturing Trends.” Department of Energy.
First Solar. 2021a. “First Solar - Investor Overview - July 29, 2021.”
https://s2.q4cdn.com/646275317/files/doc_presentations/2021/First-Sola r-Investor-Overview-(Aug-2021)-
vF.pdf.
———. 2021b. “First Solar to Invest $680m in Expanding American Solar Manufacturing Capacity by 3.3
GW.” Investors.Firstsolar.Com. June 9, 2021. https://investor.firstsolar.com/news/press-release-
details/2021/First-Sola r-to-Invest-680m-in-Expanding-American-Solar-Manufacturing-Capacity-by-3.3-
GW/default.aspx.
FRED. n.d. “Federal Reserve Economic Data | FRED | St. Louis Fed.” Accessed October 13, 2021.
https://fred.stlouisfed.org/.
Fthenakis, V. 2007. “CdTe Photovoltaics: Life Cycle Environmental Profile and Comparisons” 515 (15): 5961.
Fthenakis, V. M. 2004. “Life Cycle Impact Analysis of Cadmium in CdTe PV Production.” Renewable and
Sustainable Energy Reviews 8: 303–34.
Fthenakis, V. M., and K. Zweibel. 2003. “CdTe PV: Real and Perceived EHS Risks.” NREL/CP-520-33561
Technical Report, May, https://www.osti.gov/biblio/15004247-cdte-pv-real-perceived-ehs-risks.
GCL. 2019. “Perovskite Triggers PV Technology Revolution,” http://en.gcl-power.com/news_detail, October
2019.
Hall. 2021. “Panasonic Says It Will Exit Solar Manufacturing.” PV Magazine USA. February 1, 2021.
https://pv-magazine-usa.com/2021/02/01/panasonic-sa ys-it-will-exit-sola r-manufacturing/.
Sha w, Vincent, and Max Hall. 2022. “Chinese PV Industry Brief: China Added 53 GW of New PV Capacity in
2021.” PV Magazine International. January 21, 2022. https://www.pv-magazine.com/2022/01/21/chinese-pv-
industry-brief-china-a dded-53-gw-of-new-pv-capacity-in-2021/.
———. 2021b. “Electric Power Monthly - U.S. Energy Information Administration (EIA).” December 2021.
https://www.eia.gov/electricity/monthly/index.php.
Heidari, S. M., and A. Anctil. 2021. “Material Requirement and Resource Availability for Silicon Photovoltaic
Laminate Manufacturing in the Next 10 Years.” 1768–72. https://doi.org/10.1109/PVSC43889.2021.9518663.
SOLAR PHOTOVOLTAIC S SUPPLY CHAI N DEEP DIVE ASSESSMENT
93
Hoium, Travis. 2017. “Bankruptcies Continue in Solar Industry.” The Motley Fool. May 19, 2017.
https://www.fool.com/investing/2017/05/19/bankruptcies-continue-in-sola r-industry.aspx.
Honsberg, C.B., and S.G. Bowden. 2019. “Photovoltaics Education Website.” 2019. www.pveducation.org.
Horowitz, Kelsey, Timothy Remo, Brittany Smith, and Aaron Ptak. 2018. “A Techno-Economic Analysis and
Cost Reduction Roadmap for III-V Sola r Cells.” NREL/TP-6A20-72103. National Renewable Energy
Laboratory.
International Energy Agency (IEA). 2020. “World Energy Outlook 2020.” International Energy Agency (IEA).
———. 2021. “The Role of Critical Minerals in Clean Energy Transitions.” World Energy Outlook. Paris:
International Energy Agency. https://www.iea.org/reports/the-role-of-critica l-m inera ls-in-clean-energy-
transitions.
IEEE PVSC 2021. 48
th
IEEE Photovoltaic Specialists Conference, http://ieee.org/pvsc48.
International Trade Administration. 2021. “Final Determination in Antidumping Duty Investigation of Silicon
Metal from Malaysia.” June 17, 2021. https://www.trade.gov/faq/final-determination-antidumping-duty-
investiga tion-silicon-metal-malaysia.
J Trube. 2021. “International Technology Roadmap for Photovoltaic (ITRPV).” https://itrpv.vdma.org/en/.
Jester, Terry. 2016. “Looking Back at the Impacts of the Solar Trade War.” October 20, 2016.
https://www.greentechmedia.com/articles/read/did-sola r-cut-off-its-nose-to-spite-its-fa ce-looking-back-at-the-
impa cts-of.
Karl, NA. 2019. “Tellurium Deposits in the United States.”
Keen, Kip. 2020. “Sola r-driven silver demand set to dim as sector innovates.” S&P Global Market
Intelligence. September 30, 2020. https://www.spglobal.com/marketintelligence/en/news-insights/la test-news-
headlines/solar-driven-silver-demand-set-to-dim-as-sector-innovates-60533352.
Llewellyn, Thomas O. 1994. “Cadmium – Materials Flow.” Bureau of Mines, Information Circular 1994.
United Stated Department of Interior.
Lombardi, Candace. 2011. “Calisolar Lays off 80 California Workers.” CNET. September 15, 2011.
https://www.cnet.com/news/calisolar-la ys-off-80-california -workers/.
Makuei, Fidele Mareng, and Gamini Senanayake. 2018. “Extraction of Tellurium from Lead and Copper
Bearing Feed Materials and Interim Metallurgical Products – A Short Review.” Minerals Engineering 115
(January): 79–87. https://doi.org/10.1016/j.mineng.2017.10.013.
Margolis, Robert, Kristen Ardani, Paul Denholm, Trieu Mai, Eric O’Shaughnessy, Timothy Silverman, and
Jarrett Zuboy. 2021. “Solar Futures Study.” GO-102021-562. U.S. Department of Energy.
https://www.energy.gov/sites/default/files/2021-09/Solar%20Futures%20Study.pdf.
Marsh, Jane. 2021. “How much silver is needed for the solar panel industry?” Resource World Magazine. June
2021. https://resourceworld.com/how-much -silver-is-needed-for-the-sola r-panel-industry/
Marwede, M., and A. Reller. 2012. “Future Recycling Flows of Tellurium from Cadmium Telluride
Photovoltaic Waste.” Resources, Conservation and Recycling, December.
https://doi.org/10.1016/j.resconrec.2012.09.003.
SOLAR PHOTOVOLTAIC S SUPPLY CHAI N DEEP DIVE ASSESSMENT
94
Mints, Paula. 2021. “Photovoltaic Manufacturer Shipments: Capacity Price & Revenues 2020/2021.” Report
SPV-Supply9. SPV Market Research.
Normann, Morten. 2018. “Initiating Coverage: Elkem Silicone Rally.” Carnegie.
https://intherightvein.com/wp-content/uploads/2018/05/Elkem-Initia tion-2018.pdf.
NREL. 2021. “NREL Internal Analysis.”
———. n.d. “Best Research-Cell Eff iciency Cha rt.” Accessed October 29, 2021. https://www.nrel.gov/pv/cell-
efficiency.html.
obamawhitehouse.archives.gov. n.d. “Selections for Section 48c Manufacturing Tax Credit.”
obamawhitehouse.archives.gov.
Oxford PV. 2021. http://oxfordpv.com/tandem-cell-production
Reuters. 2018. “U.S. Makes Final Finding Silicon Metal Dumped, Subsidized.” Reuters, March 2, 2018, sec.
Industry, Materials and Utilities. https://www.reuters.com/article/usa-trade-silicon-idUSL2N1QK00U.
———. 2020. “Trump Backs Revoking Tariff Exemption for Some Solar Panel Imports.” Reuters, October
11, 2020, sec. 2020 Candidate Slideshows. https://www.reuters.com/article/usa-trade-sola r-
idUSKBN26W02M.
RINA Tech and Array Technologies. 2020. “PV Tracker Lifetime Cost Assessment.”
https://pvtrax.rina.org/download.html.
Roselund, Christian. 2019. “Trump Tariffs on Mexico Could Hit SunPower, Enphase.” PV Magazine USA.
June 3, 2019. https://pv-maga zine-usa.com/2019/06/03/trump-tariffs-on-mexico-could-hit-sunpower-enphase/.
Shah, Vishal. 2019. “First Solar Inc. Change of Earnings Forecast.” Barclays Capital Equity Research.
SiliconExpert. 2019. “Dataset of Passive Components.”
SiliconPV 2021. 11
th
International Conference on Silicon Photovoltaics, http://siliconpv.com.
Singh, A., et al., "Development and Validation of a SiC Based 50 kW Grid-Connected PV Inverter," 2018.
IEEE Energy Conversion Congress and Exposition (ECCE), 2018, pp. 6165-6172,
doi:10.1109/ECCE.2018.8557392.
Singh, Akanksha, Samantha Reese, and Sertac Akar. 2019. “Performance and Techno- Economic Evaluation
of a Three-Phase, 50-KW SiC-Based PV Inverter: Preprint.” NREL/CP-5D00-73124. Golden, CO: The
National Renewable Energy Laboratory. https://www.nrel.gov/docs/fy19osti/73124.pdf.
Smith, B.L., M. Woodhouse, D. Feldman, and M. Margolis. 2021. “Solar Photovoltaic (PV) Manufacturing
Expansions in the United States, 2017–2019: Motives, Challenges, Opportunities, and Policy Context.”
NREL/TP-6A20-74807. The National Renewable Energy Laboratory (NREL).
https://www.nrel.gov/docs/fy21osti/74807.pdf.
Smith, Brittany, and Robert M Margolis. 2019. “Expanding the Photovoltaic Supply Chain in the United
States: Opportunities and Challenges.” NREL/TP-6A20-73363, 1547262. https://doi.org/10.2172/1547262.
“Solar Industry Research Data.” n.d. SEIA. Accessed October 12, 2021. https://www.seia.org/solar-industry-
research-data.
SOLAR PHOTOVOLTAIC S SUPPLY CHAI N DEEP DIVE ASSESSMENT
95
Stoker, Liam. 2020. “Chinese Manufacturers Slam South Korean Solar Module Carbon Emissions Results.”
PV Tech (blog). September 22, 2020. https://www.pv-tech.org/chinese-manufacturers-sla m-south-korean-
sola r-module-carbon-em issions-results/.
Sylvia, Tim. 2020. “A New Player Appears in American Thin-Film Ca dm ium Telluride Sola r Module
Manufacturing.” PV Magazine USA. May 14, 2020. https://pv-maga zine-usa.com/2020/05/14/a-new-pla yer-
appears-in-american-thin-film -cadmium-telluride-sola r-module-manufacturing/.
“Tellurium: Royal Society of Chemistry - Periodic Table.” n.d. https://www.rsc.org/periodic-
ta ble/element/52/tellurium .
“Tellurium: The Bright Future of Solar Energy.” n.d. USGS: Science for a Changing World
https://pubs.usgs.gov/fs/2014/3077/pdf/fs2014-3077.pdf.
Thangavel, Suresh. 2021. “Benefits of SiC for String Inverters.” Semiconductor Engineering. July 8, 2021.
https://www.ansys.com/blog/get-high-fidelity-optical-edge-case-analyses.
Tolcin, Amy C. 2020. “Zinc Data Sheet - Mineral Commodity Summaries 2020.” Reston, VA: U.S. Geologica l
Survey. http://pubs.er.usgs.gov/publication/mds2020.
Trachtman, Joel. 2019. “Analysis | Michigan’s Clean Energy Standards Violate International Trade La w.”
Washington Post, July 4, 2019. https://www.washingtonpost.com/politics/2019/07/04/michigans-clean-en ergy-
standards-viola te-international-tra de-la w/.
United States International Trade Commission. 2021. “DataWeb.USITC.GOV.” June 30, 2021.
https://dataweb.usitc.gov/trade/search/Import/HTS.
U.S. Congressional Research Service. 2021. “Section 232 Investigations: Overview and Issues for Congress.”
R45249. https://sgp.fas.org/crs/misc/R45249.pdf.
U.S. Department of Energy. n.d. “1366 Technologies.” Energy.Gov. Accessed October 14, 2021.
https://www.energy.gov/lpo/1366-technologies.
U.S. International Trade Commission. 2018. “Silicon Metal from Australia, Brazil, Kazakhstan, and Norway.”
Publication 4773. U.S. International Trade Commission. https://usitc.gov/publications/701_731/pub4773.pdf.
———. 2021. “Silicon Metal from Bosnia and Herzegovina, Iceland, and Kazakhstan Injures U.S. Industry,
Says USITC | USITC.” March 24, 2021. https://usitc.gov/press_room/news_release/2021/er0324ll1744.htm.
USGS. 2021a. “Mineral Commodity Summaries 2021.” USGS Unnumbered Series. Mineral Commodity
Summaries. Reston, VA: U.S. Geological Survey. http://pubs.er.usgs.gov/publication/mcs2021.
———. 2021b. “U.S. Geological Survey Minerals Yearbook: Silicon Metal.”
https://www.usgs.gov/centers/nmic/silicon-sta tistics-and-inform ation.
USTR. 2018. “President Trump Approves Relief for U.S. Washing Machine and Solar Cell Manufacturers |
United States Trade Representative.” Office of the United States Trade Representative. January 22, 2018.
https://ustr.gov/about-us/policy-offices/press-office/press-releases/2018/january/president-trump-approves-
relief-us.
Wagman, David. 2021. “First Solar Signals Interest in US Tellurium Supplies for Solar Panel Production.” PV
Magazine International. March 9, 2021. https://www.pv-magazine.com/2021/03/09/first-sola r-signa ls-interest-
in-us-tellurium -supplies-for-sola r-panel-production/.
SOLAR PHOTOVOLTAIC S SUPPLY CHAI N DEEP DIVE ASSESSMENT
96
Werner, C. 2013. “Creating Cost Effective Solar Installations with Aluminum Extrusion. Solar Power World
Webinar.” Webinar. https://www.solarpowerworldonline.com/2013/06/webinar-creating-cost-effective-sola r-
insta lla tions-with-aluminum-extrusions/.
Wood Mackenzie & SEIA. 2017. “U.S. Solar Market Insight Full Report 2016 Year in Review.” Wood
Mackenzie and SEIA. https://www.seia.org/research-resources/solar-market-insight-report-2020-year-review.
———. 2021. “U.S. Solar Market Insight Full Report 2020 Year in Review.” Wood Mackenzie and SEIA.
https://www.seia.org/research-resources/solar-market-insight-report-2020-year-review.
Wood Mackenzie Power & Renewables. 2018. “PV Pulse, WCM Dataset.” Wood Mackenzie Power &
Renewables.
———. 2021a. “Solar Tracker Vendor Market Shares for Calendar Year 2020.” Wood Mackenzie Power &
Renewables.
———. 2021b. “Global Solar PV Inverter and MLPE Landscape 2021.” Wood Mackenzie Power &
Renewables.
YOLE Developpement. 2016. “Power SiC 2016: Materials, Devices, and Applications.” YOLE
Developpement.
Yole Developpement. 2018. “Status of Power Electronics Industry.” Yole Developpement.
Yüce, Ceren, Kuninori Okamoto, Lindsey Karpowich, Adrian Adrian, and Norbert Willenbacher. 2019. “Non-
Volatile Free Silver Paste Formulation for Front-Side Meta lliza tion of Silicon Sola r Cells.” Sola r Energy
Materials and Solar Cells 200 (September): 110040. https://doi.org/10.1016/j.solmat.2019.110040.
SOLAR PHOTOVOLTAIC S SUPPLY CHAI N DEEP DIVE ASSESSMENT
97
Acknowledgments
This deep dive assessment of risk in the solar photovoltaics supply chain was supervised by DOE’s Sola r
Energy Technologies Office. The policy strategies, actions, and recommendations were prepared by DOE’s
Office of Policy. Most of the rema ining content was researched, analyzed, and compiled by the National
Renewable Energy Laboratory (NREL). Dr. Tsisilile Igogo, a deta ilee a t the DOE’s Off ice of Policy f rom
NREL, led the agency’s energy supply chain review.
DOE acknowledges all stakeholders that contributed input used in the development of this report – including
but not limited to federal agencies, state and local governments, U.S. industry, national labs, researchers,
academia, non-governmental organizations, and other experts and individuals. DOE a lso issued a request for
information (RFI) to the public on energy sector supply chains and received comments that were used to
inform policy strategies in this report.
Principal Authors
• Ba sore, Pa ul, Chief Scientist, DOE Solar Energy Technologies Office
• Feldma n, David, Economic/Financial Analyst, NREL
Contributors
• Coplon-Newfield, Gina , Chief of Staff, DOE Office of Policy (policy stra tegies)
• Dum mit, Krysta , ORISE Fellow, DOE Solar Energy Technologies Office (a ll cha pters)
• Igogo, Tsisilile, Lead Coordinator/Supply Chain Review, DOE Office of Policy (policy stra tegies)
• Nanayakkara, Sanjini, NREL (CdTe)
• Simmons, Bra d, Director, DOE International Market Development (policy strategies)
• Sm ith, Brittany, NREL (c-Si)
• Woodhouse, Micha el, NREL (c-Si)
Reviewers
• Cunliff, Colin, Physica l Scientist, DOE Office of Policy
• Jones-Albertus, Becca, Director, DOE Solar Energy Technologies Office
• Speakes-Backman, Kelly, Principal Deputy Assistant Secretary, DOE (EERE)
• Zuboy, Jarett, NREL
Portions of this report were prepared by the National Renewable Energy Laboratory, operated by Alliance for
Sustainable Energy, LLC, for the U.S. Department of Energy under Contract No. DE-AC36-08GO28308.
Funding provided by U.S. Department of Energy Office of Energy Efficiency and Renewable Energy (EERE)
Solar Energy Technologies Office.
The production of this report was supported in part by the Oak Ridge Institute for Science and Education
(ORISE) for the DOE. ORISE is managed by Oak Ridge Associated Universities (ORAU) under DOE contract
number DE-SC0014664. This report does not necessarily reflect the policies and views of ORAU or ORISE.

DOE/OP-0012 ▪ February 2022
For more information, visit:
energy.gov/policy/supplychains
