
Spring 2023
Solar Industry Update
David Feldman, NREL
Krysta Dummit, BGS Contractor for SETO
Jarett Zuboy, NREL
Robert Margolis, NREL
April 27, 2023
Photo by Werner Slocum, NREL 74637

NREL | 2
Global Solar Deployment1
U.S. PV Deployment
2
PV System Pricing
3
Global Manufacturing
4
Component Pricing
5
Market Activity
6
7 U.S. PV Imports
Agenda

NREL | 3NREL | 3
Global Solar Deployment
• IEA reported that in 2022, 231 GWdc of PV was installed globally, bringing cumulative
PV installs to 1.2 TWdc.
– China’s annual PV installations grew 57% y/y in 2022, representing 42% of total
global demand, with the majority coming from distributed PV.
– The U.S. was the second-largest market in terms of cumulative and annual
installations.
• Analyst project 2023 annual installations to grow to more than 300 GW and by 2025
more than 400 GW.
U.S. PV Deployment
• In 2022, PV represented approximately 46% of new U.S. electric generation capacity,
compared to 4% in 2010.
• Solar still represented only 9.0% of net summer capacity and 4.7% of annual generation
in 2022.
• However, 16 states generated more than 5% of their electricity from solar, with
California leading the way at 27.3%.
• The United States installed 17.0 GWac (20.2 GWdc) of PV in 2022, ending the year with
110.1 GWac (140.6 GWdc) of cumulative PV installations.
• The United States installed approximately 14.1 GWh, 4.8 GWac of energy storage onto
the electric grid in 2022, up 34% y/y.
PV System and Component Pricing
• The median system price for a select group of utility-scale PV projects in 2022 was
$1.49/Wac—up 13% y/y.
• The median reported price by EnergySage for residential PV systems increased 6.3%
y/y to $2.85/Wdc – the third straight period of increase, after never having done so
before.
• After plunging to a 1.5-year low of $20/kg in mid-January, global polysilicon spot prices
rebounded to $30/kg in mid-February and then dropped to $24/kg by mid-April.
• Global module prices have declined steadily since fall 2022 despite strong demand,
reaching lows in April 2023 that have not been seen for 2 years.
Global Manufacturing
• In 2022, global PV shipments were approximately 283 GW—an increase of 46% from
2021.
• In 2022, 96% of PV shipments were mono c-Si technology, compared to 35% in 2015.
• N-type mono c-Si grew to 51% - up from 20% in 2021 (and 5% in 2019).
• In 2022, the United States produced a around 5 GW of PV modules.
U.S. PV Imports
• According to U.S. Census data, 28.7 GWdc of modules and 2.5 GWdc of cells were
imported in 2022, an increase of 21% y/y (+5 GW) and 7% y/y (178 MW), respectively.
• Collectively, Malaysia, Vietnam, Thailand, and Cambodia represented 73% of c-Si
module imports (75% including c-Si cells).
• According to U.S. Census data, 2.5 GWdc of cells were imported in 2022. Quarterly cell
imports grew for the second quarter in a row in Q4 2022 (+60 MWdc, +9% q/q).
• In 2022, only 10% (2.7 GWdc) of modules reported a tariff, compared to 56% (13.2
GWdc) in 2021.
Executive Summary
A list of acronyms and abbreviations is available at the end of the presentation.

NREL | 4
Agenda
Global Solar Deployment1
U.S. PV Deployment
2
PV System Pricing
3
Global Manufacturing
4
Component Pricing
5
Market Activity
6
7 U.S. PV Imports
• IEA reported that in 2022, 240 GWdc of PV was installed
globally, bringing cumulative PV installs to 1.2 TWdc.
– China’s annual PV installations grew 93% y/y in 2022,
representing 44% of total global demand, with the
majority coming from distributed PV.
– The U.S. was the second-largest market in terms of
cumulative and annual installations.
• Analysts project 2023 annual installations to grow to more
than 300 GW and by 2025 more than 400 GW.
• At the end of 2022, global CSP capacity reached
approximately 6.4 GW, with 1.3 GW under construction.
NREL | 5NREL | 5
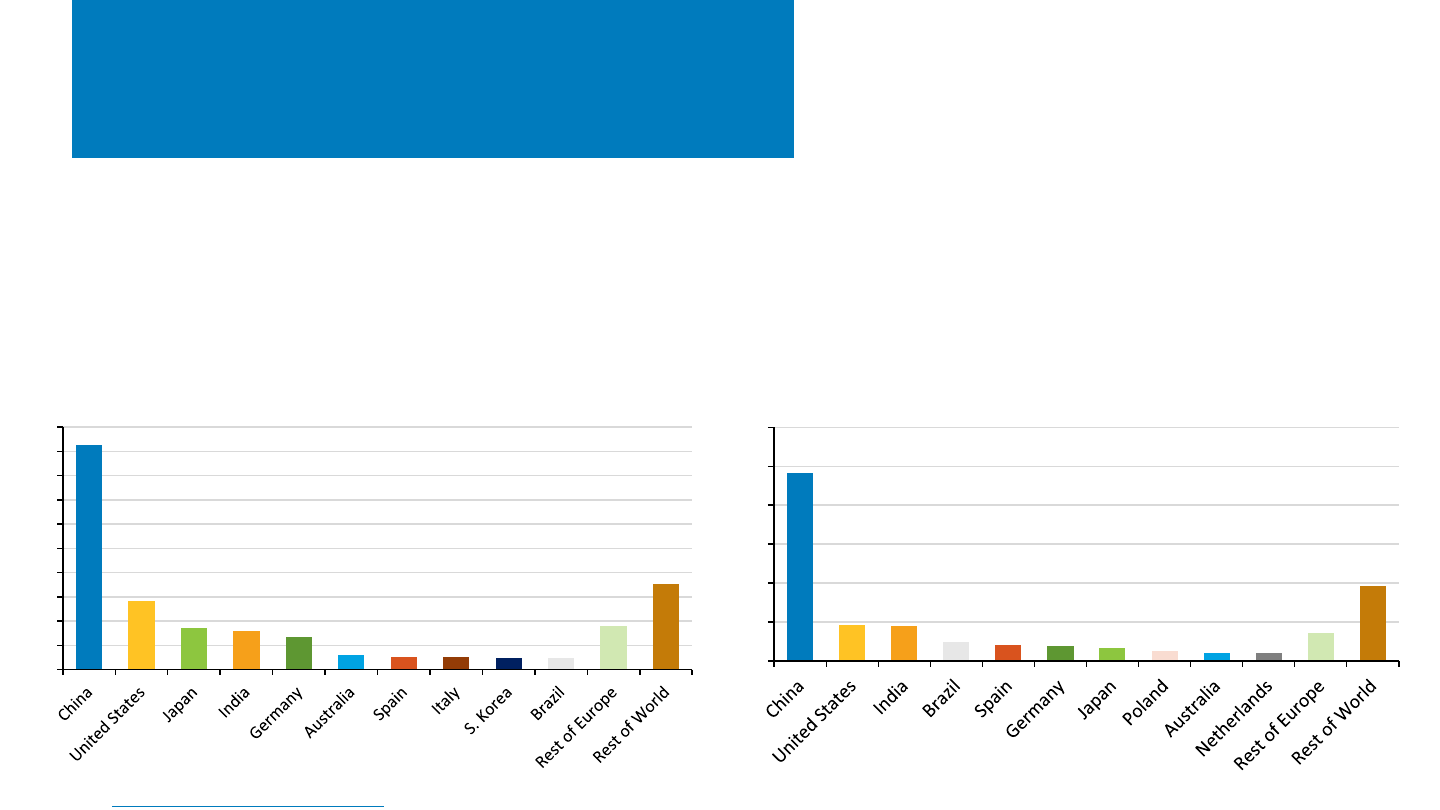
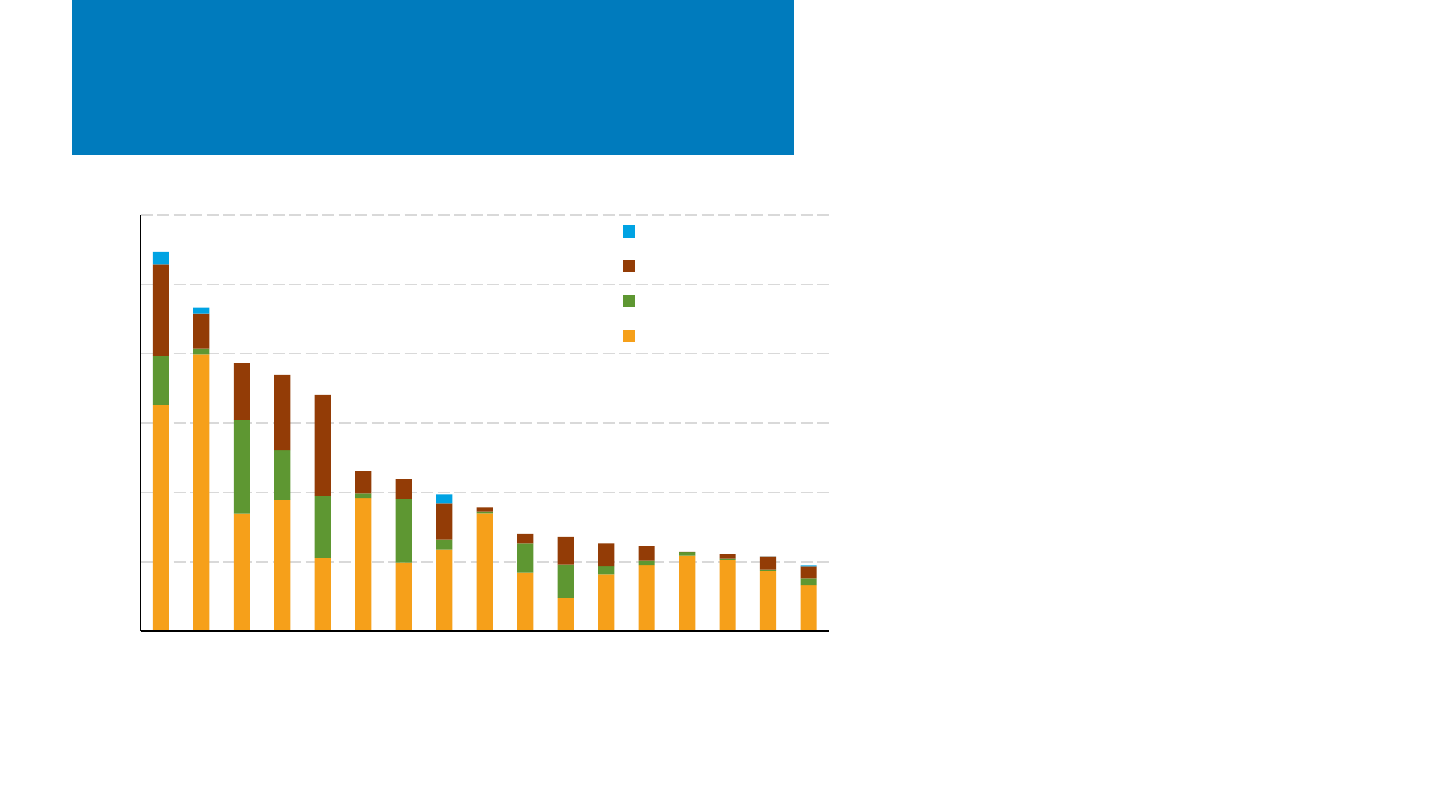
Top PV Markets
• The leading 10 markets in terms of cumulative capacity remained
relatively unchanged between 2021 and 2022.
– Brazil jumped ahead of Vietnam for the 10
th
spot in 2022.
• China’s annual PV installations grew 57% y/y in 2022,
representing 42% of total global demand.
• In 2022, despite a market contraction, the United States
was the second-largest PV country market in terms of
both cumulative and annual installations.
– The EU, however, was the second-largest market,
with 209 GWdc of cumulative installations (17% of
global installations and 3 countries in the top 10)
and 38.7 GWdc annual installations (17% of global
installations and 4 countries in the top 10) in 2022.
462
142
85
79
67
30
27
25
25
24
91
177
0
50
100
150
200
250
300
350
400
450
500
Cumulative PV Deployment - 2022 (1,233 GWdc)
96.6
18.6
18.1
9.9
8.1
7.5
6.5
4.9
3.9 3.9
14.3
38.3
0
20
40
60
80
100
120
Annual PV Deployment - 2022 (231 GWdc)
Note: Chinese numbers were adjusted, assuming Chinese DPV reported in Watts-DC (with an ILR of 1.1) and UPV reported in Watts-AC (with an ILR of 1.3).
Sources: IEA, Snapshot of Global PV Markets: 2023; Trends in Photovoltaic Applications 2022.
NREL | 6NREL | 6
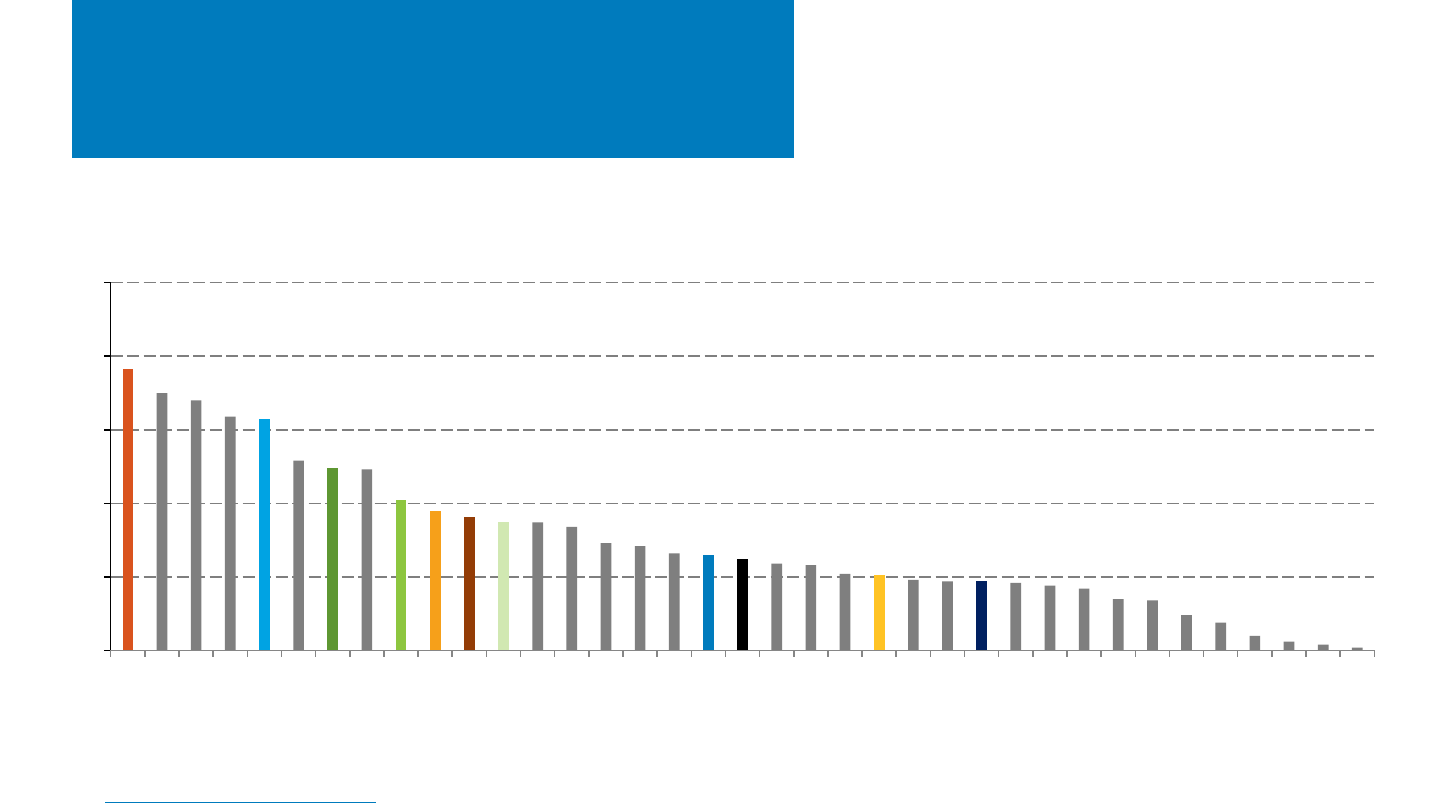
Global PV Penetration
• The United States, despite being a leading PV market, is
below the global average and other leading markets in
terms of PV generation as a percentage of total country
electricity generation, with 5%.
– If California were a country, its PV contribution
(28%) would be the highest.
• IEA estimates that in 2022, 6% of global electricity generation came
from PV.
Source: IEA, Snapshot of Global PV Markets: 2023.
0%
5%
10%
15%
20%
25%
Spain
Greece
Chile
Netherl…
Australia
Honduras
Germany
Israel
Japan
India
Italy
EU
Belgium
Portugal
Denmark
Switzerl…
Turkey
China
World
Austria
Bulgaria
Mexico
USA
Morocco
UK
S. Korea
France
Romania
S. Africa
Czech…
Thailand
Slovakia
Sweden
Canada
Malaysia
Finland
Norway
Percent of Annual Electricity Generation
NREL | 7NREL | 7
0
100
200
300
400
500
600
2021 2022 2023P 2024P 2025P 2026P
PV Annual Installations (GWdc)
European Union Europe (All) U.S. India Rest of World China
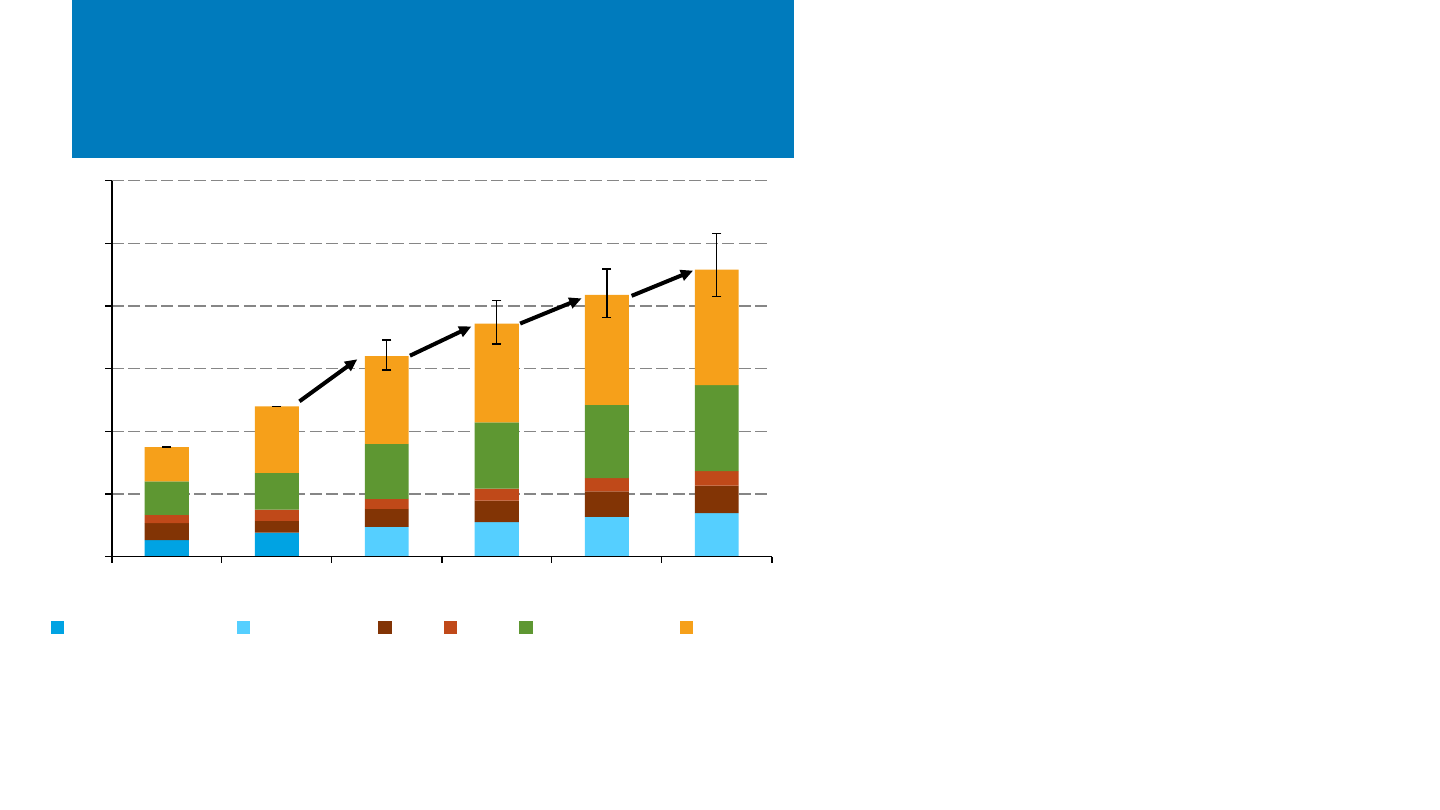
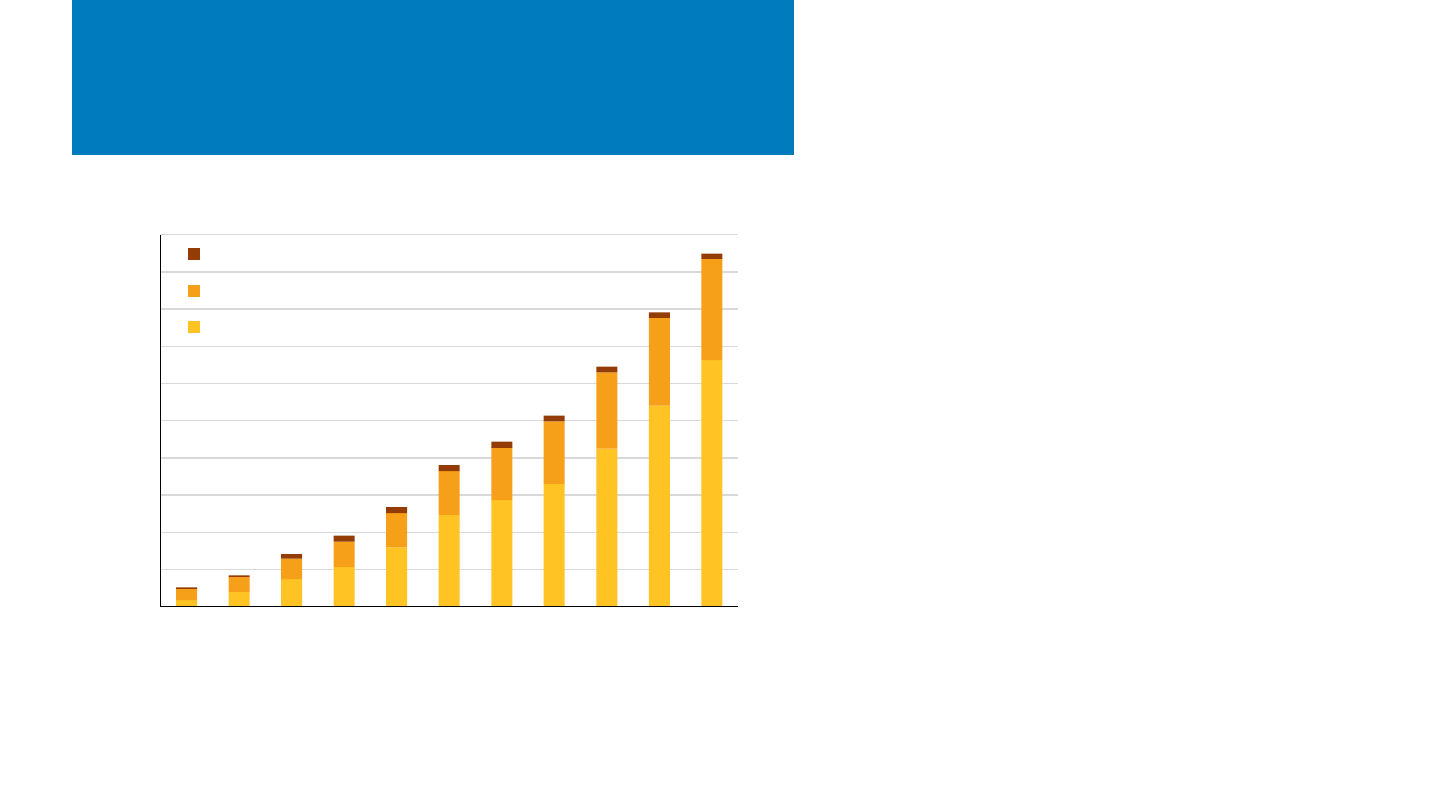
Annual Global PV Demand
Notes: E = estimate, P = projection. Colored bars represent median projections for region/country-level
estimates. Error bars represent high and low global projections. Not all sources have data for all categories.
Sources: BNEF, 1Q 2023 Global PV Market Outlook, 2/28/23; Goldman Sachs Equity Research, America’s
Clean Technology: Solar, 2023 Outlook, 12/18/22; IEA, Snapshot of Global PV Markets: 2022, 4/22; IEA,
Snapshot of Global PV Markets: 2023, 4/23; U.S. Energy Information Administration, Annual Energy
Outlook 2023, 3/16/23; U.S. Energy Information Administration, Monthly Energy Review, 12/22; Wood
Mackenzie and SEIA, US Solar Market Insight, 2022 Year in Review, 3/23.
• About 240 GWdc of PV were installed globally in 2022.
• Analysts project continued increases in annual global PV
installations.
– 320 GWdc in 2023
– 372 GWdc in 2024
– 418 GWdc in 2025
– 458 GWdc in 2026.
• Analysts who provided global projections 1 year ago
increased those projections this year (e.g., by 34%–38%
for 2025 projections).
• China, Europe, the United States, and India account for
about 70% of global PV installations over the period
shown.
+33%
+16%
+12%
+10%

NREL | 8NREL | 8
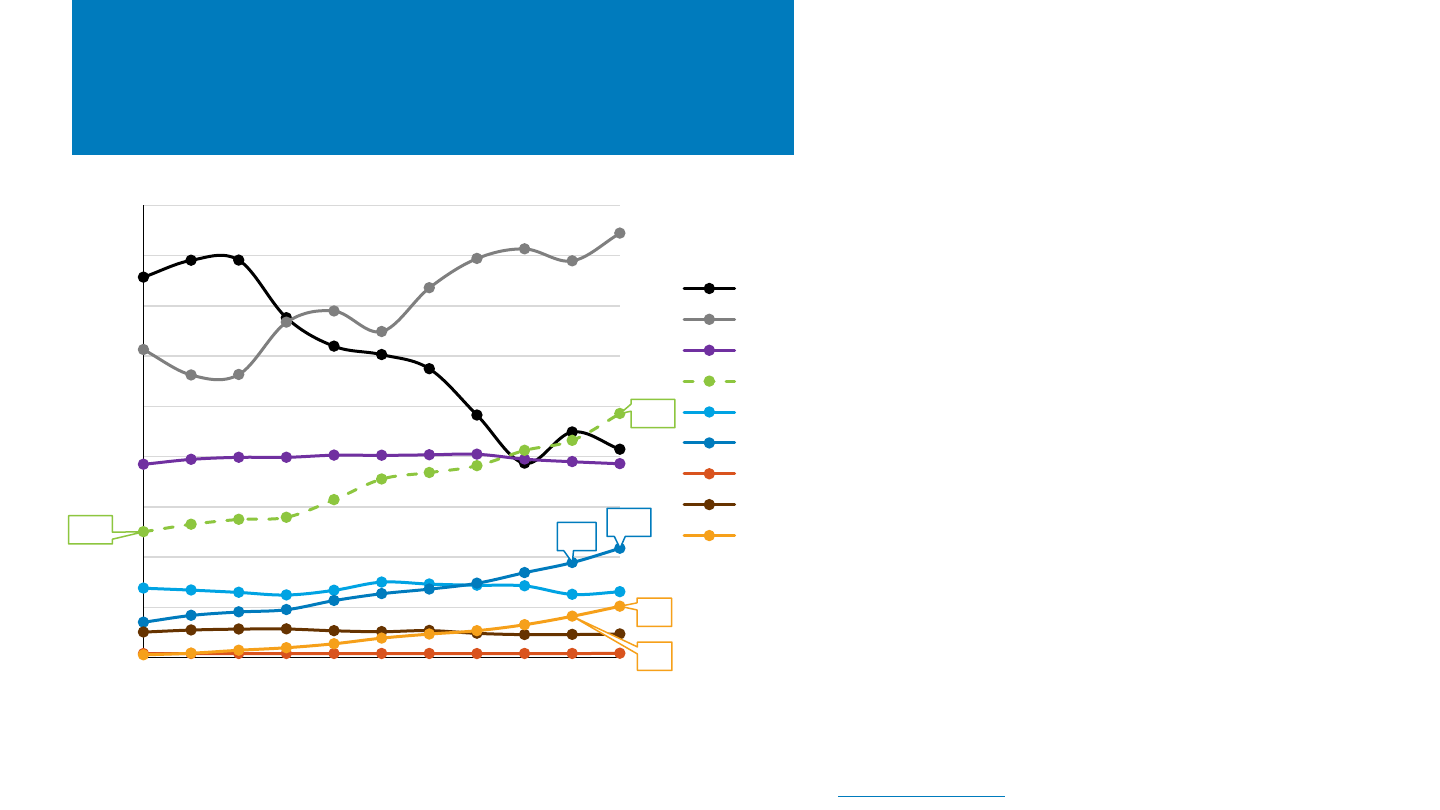
Change in Recent Global PV
Demand Projections
0
100
200
300
400
500
2020 2021 2022 2023 2024 2025 2026
PV Annual Installations (GWdc)
1
2
3 4
Reported Drivers of Growth in Installed PV Projections
1. Projections in Mid to Late 2021: COVID-19 coming
under control, improving supply chains, reduced
geopolitical trade risks.
2. Projections in Early 2022: invasion of Ukraine by
Russia, increasing desire for energy security, increasing
conventional energy prices, improving supply chains,
higher national PV targets.
3. Projections in Mid to Late 2022: increasing
conventional energy prices, increasing polysilicon supply,
declining module prices, adjusting for underestimation of
global market in official installation statistics.
4. Projections in Late 2022 to Early 2023: oversupply
throughout supply chain, declining module prices, large
module inventories, IRA and other U.S. policies, energy
cost inflation in Europe, supply chain normalization in
China, potentially explosive growth constrained only by
local conditions (permitting, interconnection, labor,
financing, etc.).
1
2
3
4
+81 GW
+34 GW
+42 GW
261 GW
in 2025
Sources: BNEF, Global PV Market Outlook, 11/25/21, 3/1/22, 8/26/22, 2/28/23; Goldman Sachs, Americas Clean Technology: Solar 2021 Outlook, 01/09/22; Goldman Sachs,
Americas Clean Technology: Solar, Assessing the Impact of Volatile Macro - Oil, Commodities & EU in Focus, Raise Demand View Thru 2025, 3/29/22; Goldman Sachs, America’s
Clean Technology: Solar, 2023 Outlook, 12/18/22; NREL, Solar Industry Update, 1/11/22, 4/26/22, 10/27/22, 4/27/23; Solar Power Europe, Global Market Outlook For Solar Power
2021-2025, 7/20/21; SolarPower Europe, Global Market Outlook For Solar Power: 2022-2026, 5/22.
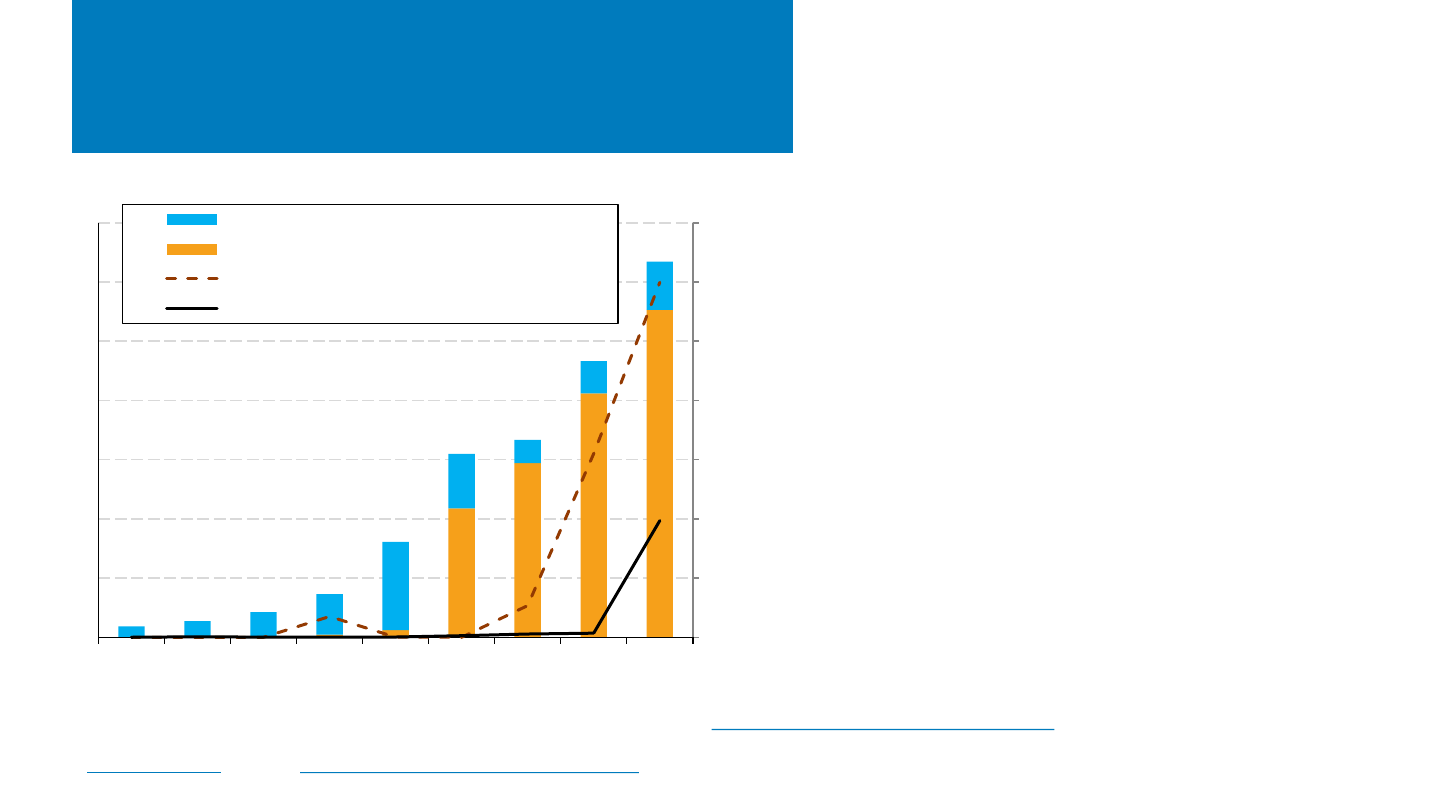
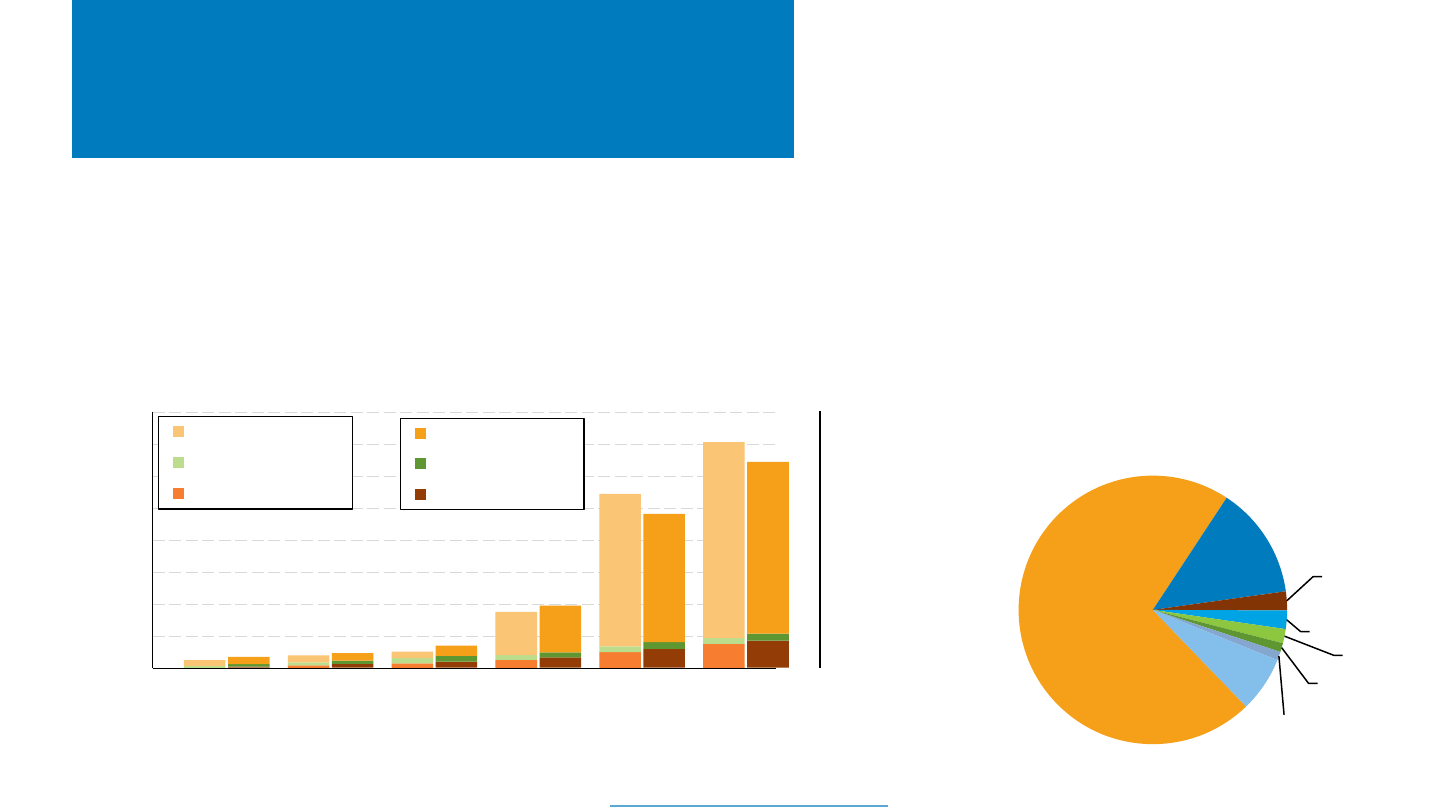
NREL | 9NREL | 9
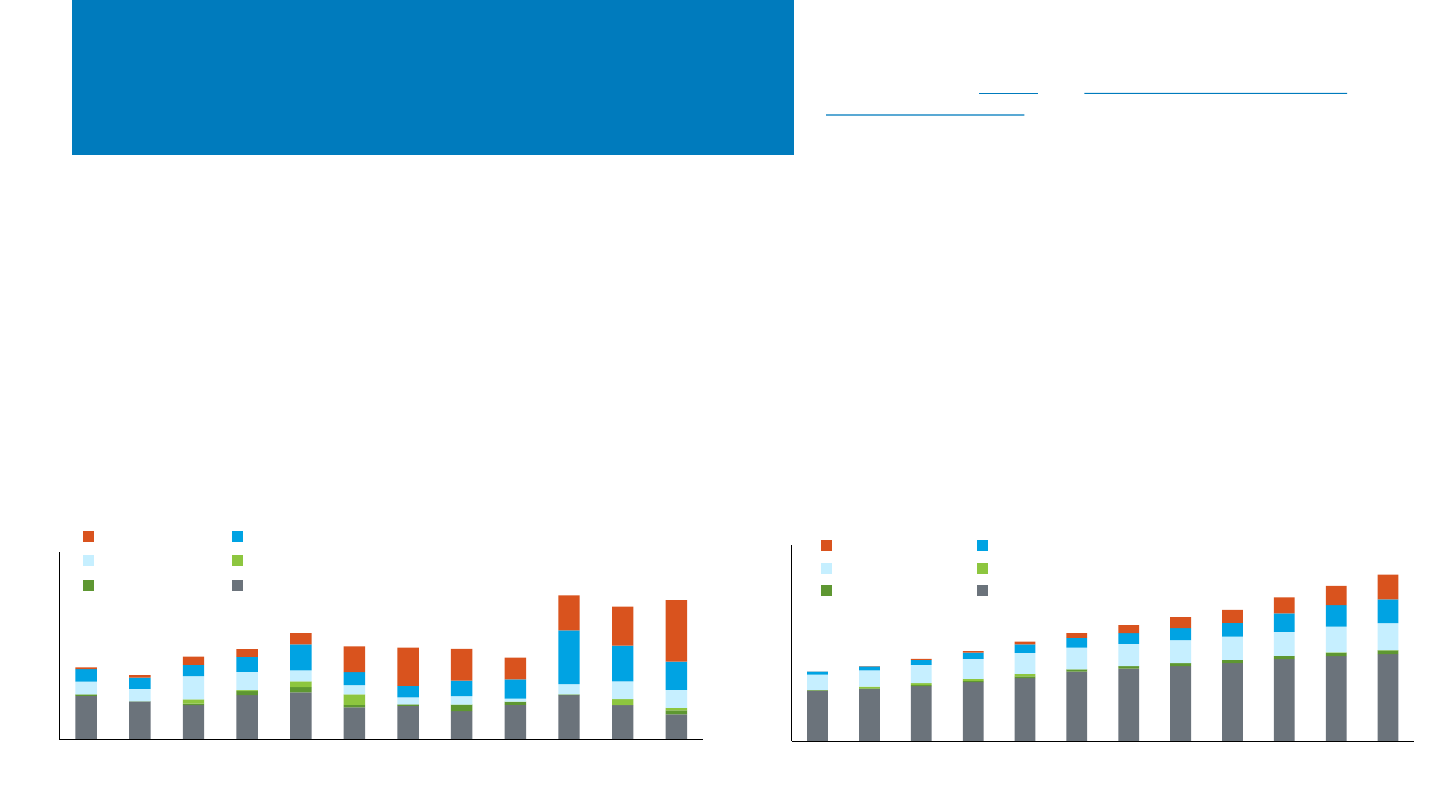
Chinese Generation Capacity
Additions by Source
Note: Based on new information, annual and cumulative solar values now assume
that China’s National Energy Administration (NEA) reports distributed PV in direct
current terms and utility-scale PV in alternating current terms.
Sources: China NEA (1/18/23); IEA, National Survey Report of PV Power
Applications in China, 2021
.
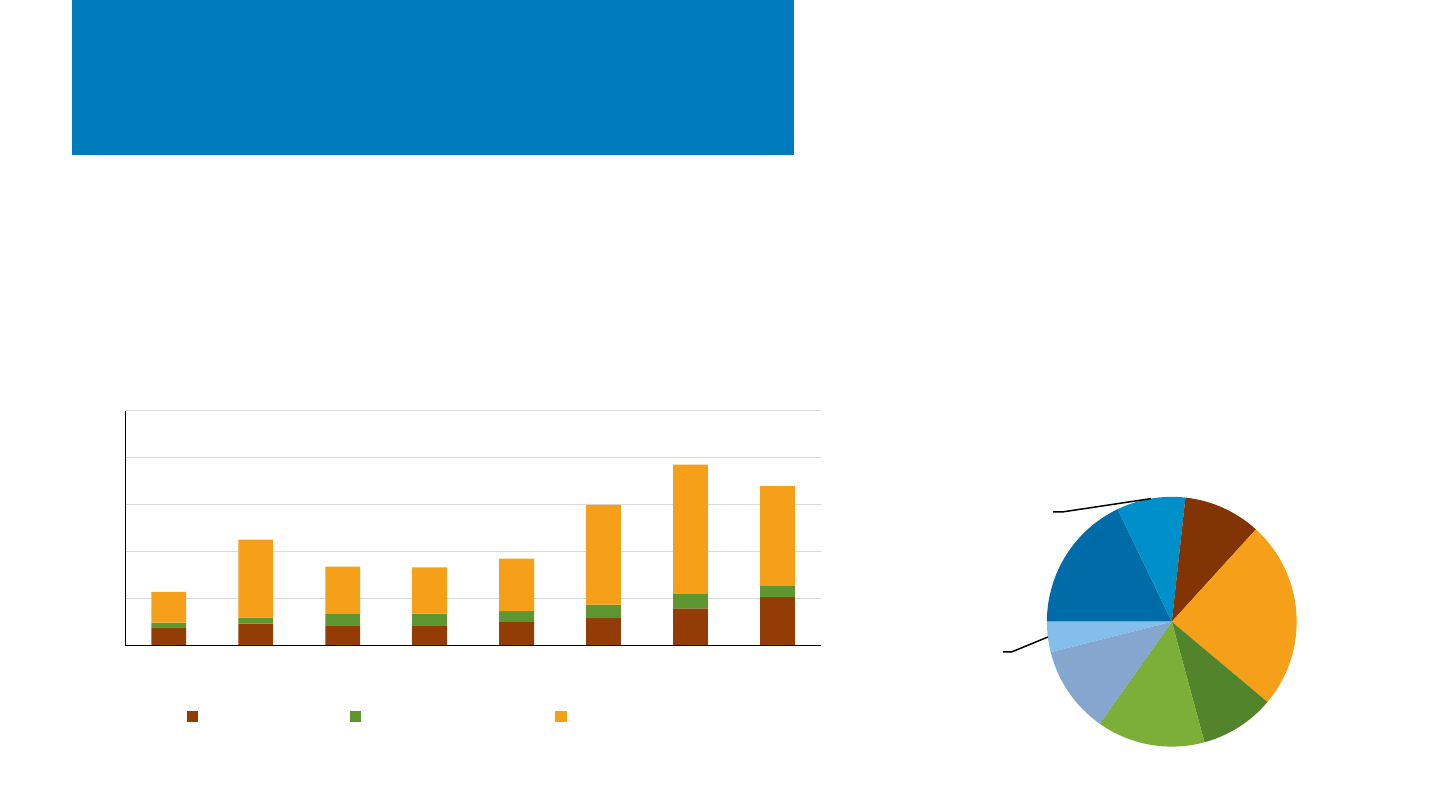
• In 2022, solar contributed 44% to new generation capacity in China (97 GWdc/82
GWac) and 15% of cumulative capacity (462 GWdc/378 GWac).
– The record for annual solar installed was broken for the second year in a row.
– In 2022, 61% of new PV was distributed, 39% was utility scale.
– Wind and solar accounted for 64% of capacity installed in 2022, and together
they have constituted the most capacity installed for 7 years running.
– Annual coal and gas additions fell for the second year in a row, reaching the
lowest level in more than a decade.
• Renewable sources continue to capture a larger
share of China’s growing electric capacity.
– In 2011, renewables made up 26% of 1.1 TW of
total capacity.
– In 2022, renewables made up 45% of 2.5 TW of
total capacity.
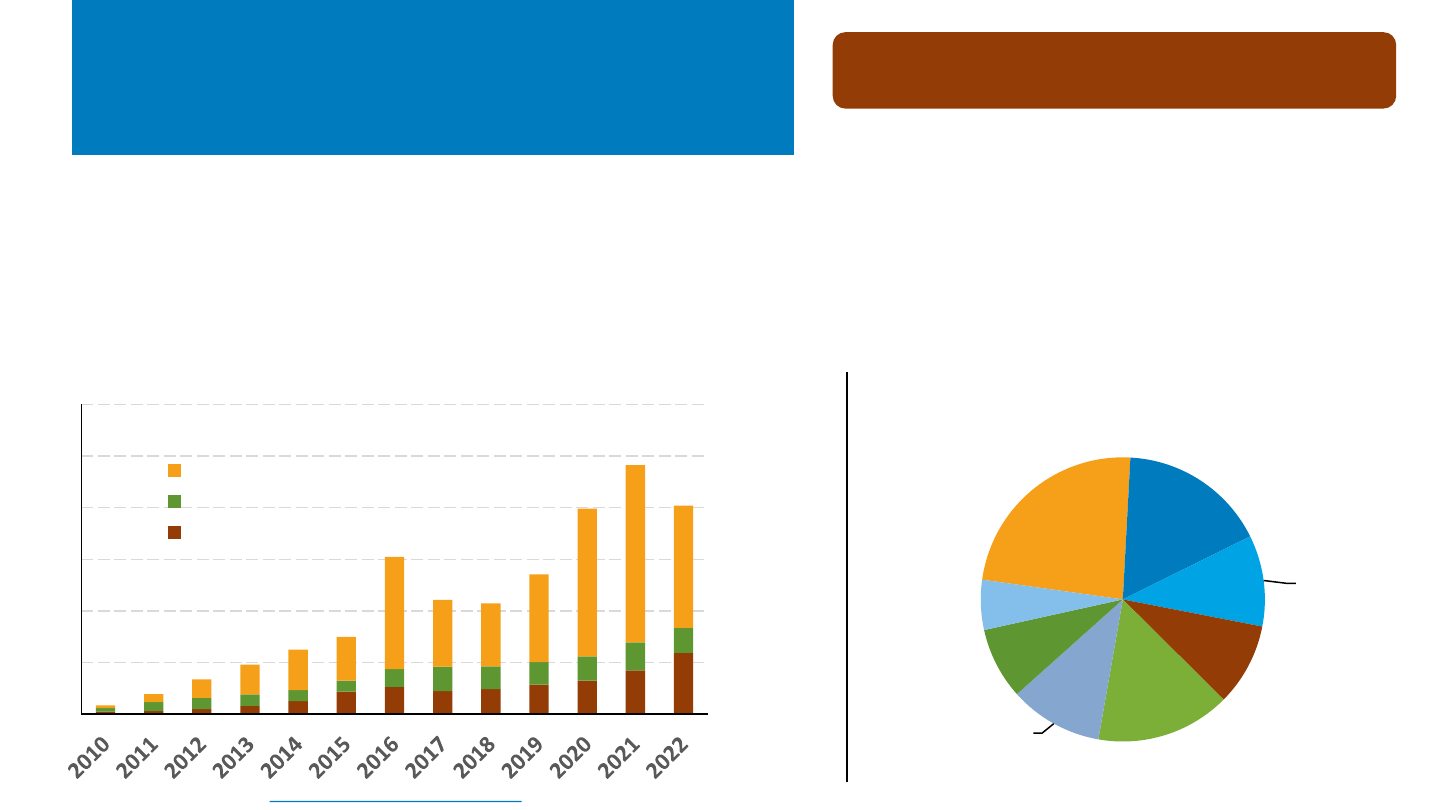
15
34
51
42
29
47
52
82
96
84
111
121
142
125
125
123
111
191
178
186
0
50
100
150
200
250
2011 2012 2013 2014 2015 2016 2017 2018 2019 2020 2021 2022
Annual Capacity Additions (GWac)
Solar ac Wind
Hydro Other
Nuclear Coal and Gas
41
75
126
168
197
244
296
378
1,063
1,147
1,258
1,379
1,521
1,652
1,777
1,900
2,011
2,200
2,373
2,545
0
500
1,000
1,500
2,000
2,500
3,000
2011 2012 2013 2014 2015 2016 2017 2018 2019 2020 2021 2022
Cumulative Capacity (GWac)
Solar ac Wind
Hydro Other
Nuclear Coal and Gas

NREL | 10NREL | 10
Chinese Market Update
Sources: BloombergNEF, China Will Produce 430 GW of Modules in 2023
Industry Says, 3/8/23; BloombergNEF, China’s Rooftops Are Becoming the Key to
the World’s Solar Boom, 3/31/23; China NEA (1/18/23); PV Tech (3/28/23,
3/30/23).
• Although China has continued to deploy PV rapidly, headwinds include high supply chain prices, constraints on land development,
and lack of transmission from remote PV projects to densely populated areas.
• One solution is more rooftop PV—for the second year, China installed more distributed PV than utility-scale PV in 2022.
– Distributed PV now constitutes about 40% of total PV capacity.
– The 50 GWac of distributed PV installed in 2022 eclipsed the total renewable energy installed by any other country; about 1 of
every 4 modules installed globally in 2022 was on a Chinese rooftop.
– Distributed PV surged in 2021 and 2022 owing to subsidies, lower sensitivity to module price, high electricity rates charged to
businesses along with power outages and pressure to decarbonize, and a bulk-buying program for local governments.
– Challenges going forward include strains from excess PV generation on distribution grids—which is stimulating time-of-use
rate structures—expiration of national subsidies in 2021, and higher costs due to requiring storage paired with PV in most
provinces.
• Another solution is funneling utility-scale PV onto low-value lands—the Chinese government is promoting deployment in desert
areas and oil and coal fields while discouraging deployment on farmlands and areas with ecological or cultural value.
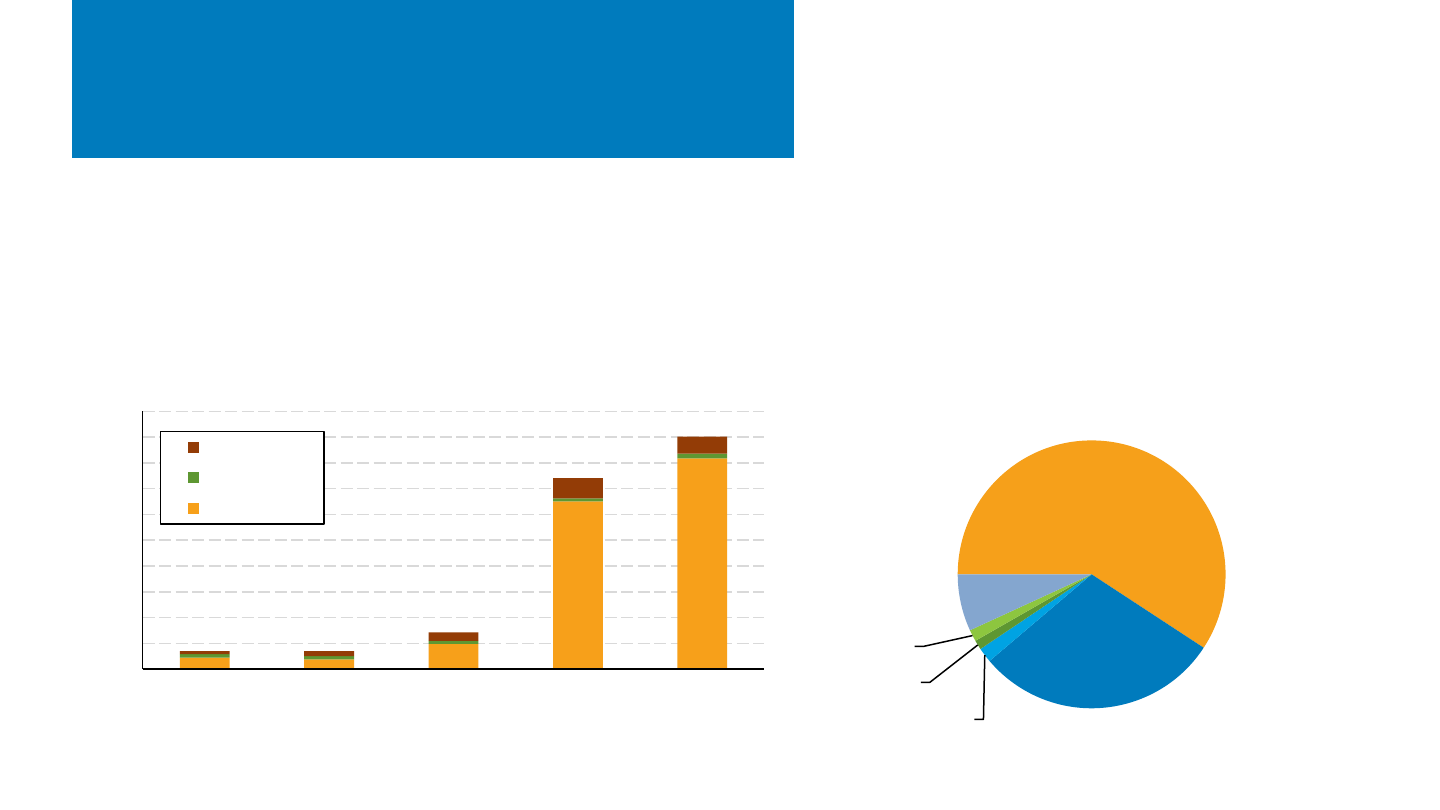
NREL | 11NREL | 11
Indian Market Update
Sources: BNEF, 1Q 2023 Global PV Market Outlook, 2/28/23; BNEF, 1H 2023 India Renewables Market
Outlook, 2/28/23; Mercom India Research, Q4 & Annual 2022 India Solar Market Update, 2/20/23; Mercom
(2/28/23).
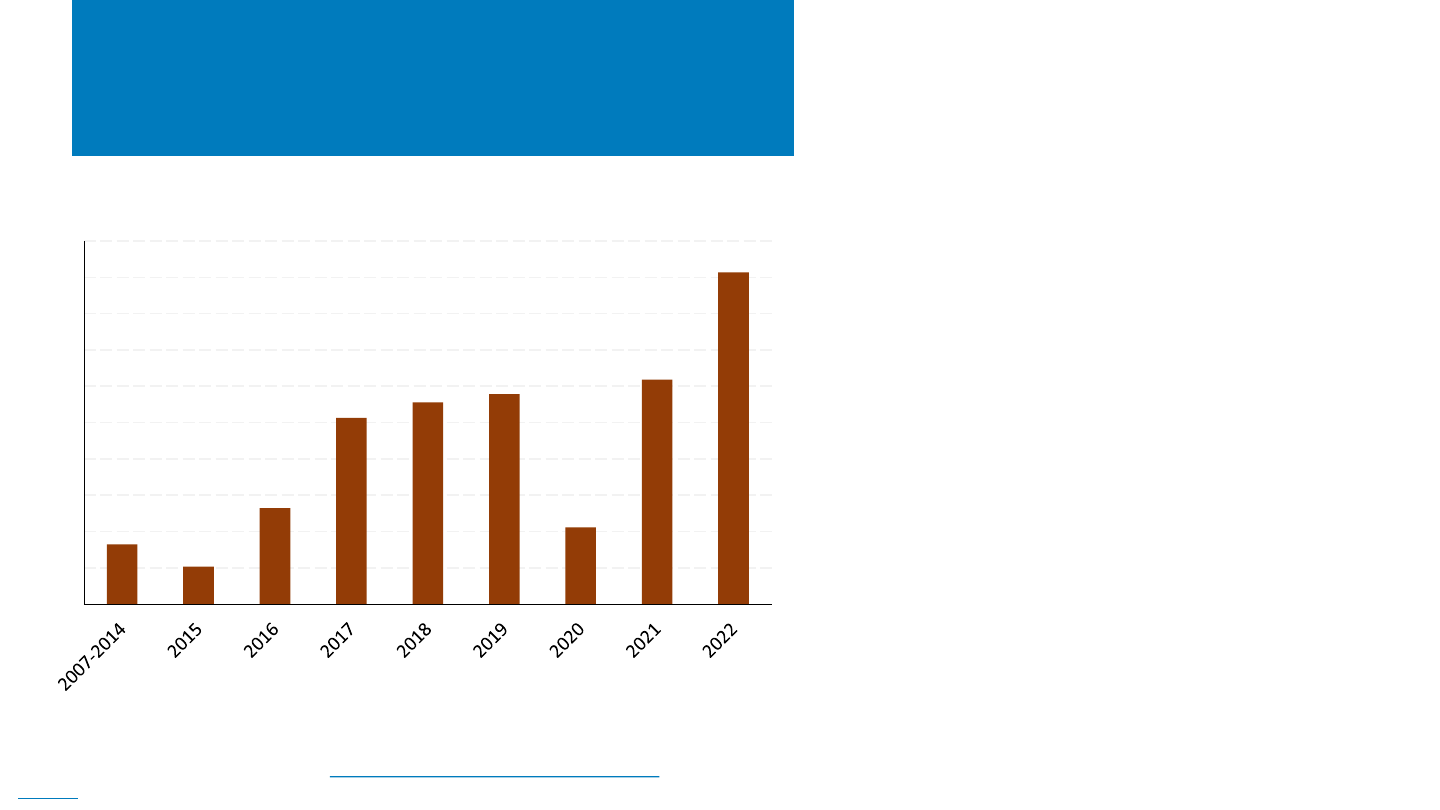
• India’s annual PV additions achieved a record in
2022 at 13 GWac (18 GWdc), up 27% from 2021.
– Large-scale projects increased 33% from 2021 and
made up 87% of new 2022 PV capacity.
– Rooftop projects decreased 4% from 2021 and made up
13% of new 2022 PV capacity.
– PV made up a record 82% of total capacity additions
and totaled 63 GWac at year end.
• Large project costs increased 7.3% in 2022.
– Costs increased for 10 consecutive quarters mainly
owing to higher module prices and supply constraints.
– PV auction tariffs rose for the first time in 2022,
primarily because of the higher equipment costs and
higher financing costs.
• At year end, 58 GWac of large projects were in the
pipeline, with another 51 GWac pending auction.
0
2
4
6
8
10
12
14
16
18
20
India's Annual PV Capacity Additions (GWdc)
NREL | 12NREL | 12
Indian Market Update
Sources: BNEF, 1H 2023 India Renewables Market Outlook, 2/28/23; BNEF, 1Q 2023 Global PV Market Outlook, 2/28/23; Goldman Sachs Equity Research,
America’s Clean Technology: Solar, 2023 Outlook, 12/18/22; JMK Research and Institute for Energy Economics & Financial Analysis, India’s Photovoltaic
Manufacturing Capacity Set to Surge, Mercom (3/10/23, 3/14/23); Mercom India Research, State of Solar PV Manufacturing in India, 3/23.
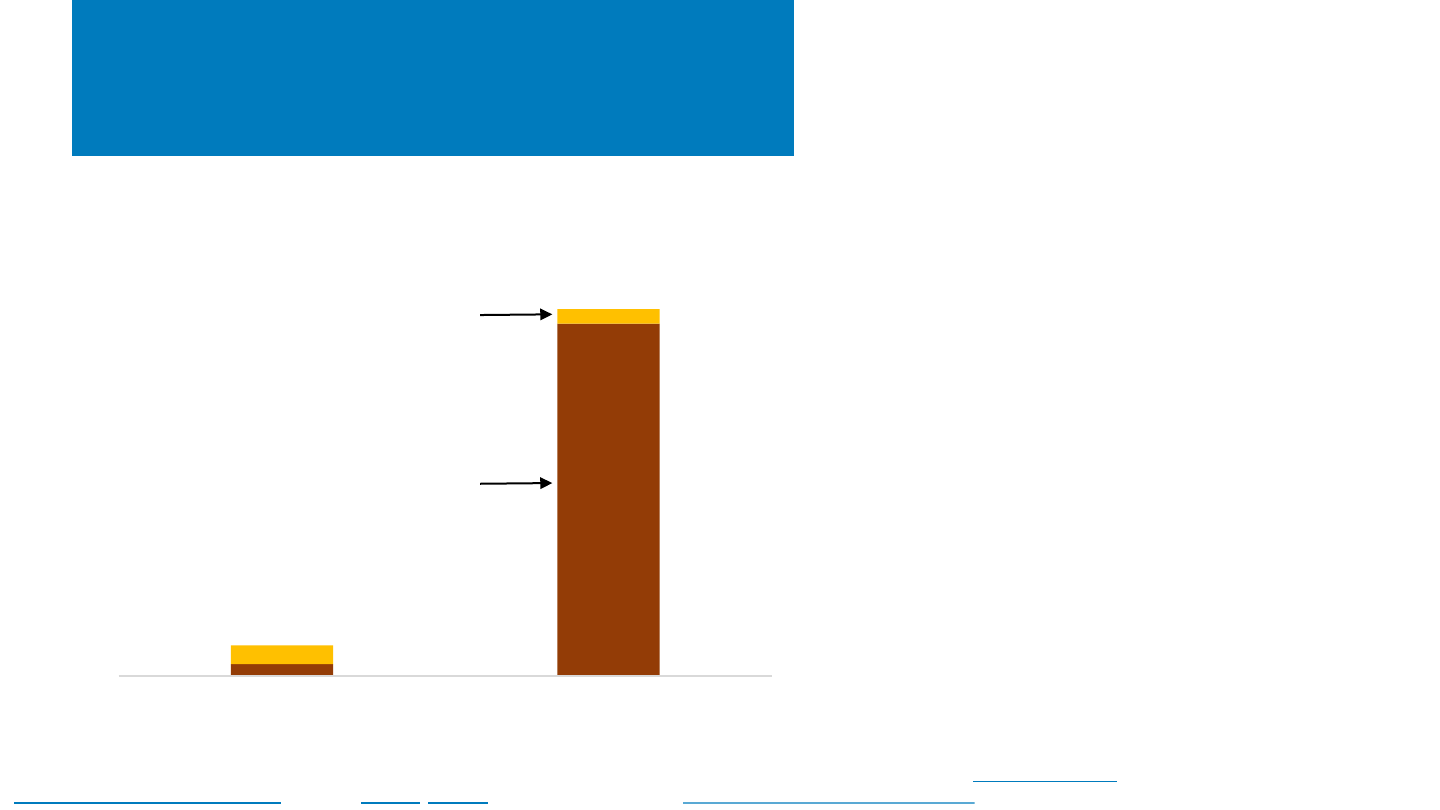
• Indian module exports jumped more than tenfold
between the first and second halves of 2022, with
all the increase going to the United States.
– India’s module manufacturing capacity reached 40
GWdc in 2022, but only 10 GWdc was for modules of
500 Wdc or higher.
– One projection shows India’s module manufacturing
capacity reaching 110 GWdc by 2026, which is 90 GWdc
more than projected domestic installations in that year.
– The U.S. module market yields higher profit margins
than the Indian market.
– Mid-year U.S. policies (UFLPA, AD/CVD investigation)
contributed to demand for Indian modules.
– Indian module exports to the U.S. totaled about 1.5–2.0
GWdc in 2022.
• Indian manufacturing is promoted through import
barriers and incentives, but some Indian
manufacturers are expanding without incentives.
• Indian manufacturers are reportedly considering
U.S. module plants to benefit from IRA incentives.
0
100
200
300
400
500
600
January-June 2022 July-December 2022
Million U.S. dollars
Value of Indian Module Exports: H1 2022 vs. H2 2022
Exported
to the U.S
Exported
elsewhere
NREL | 13NREL | 13
Japanese Market Update
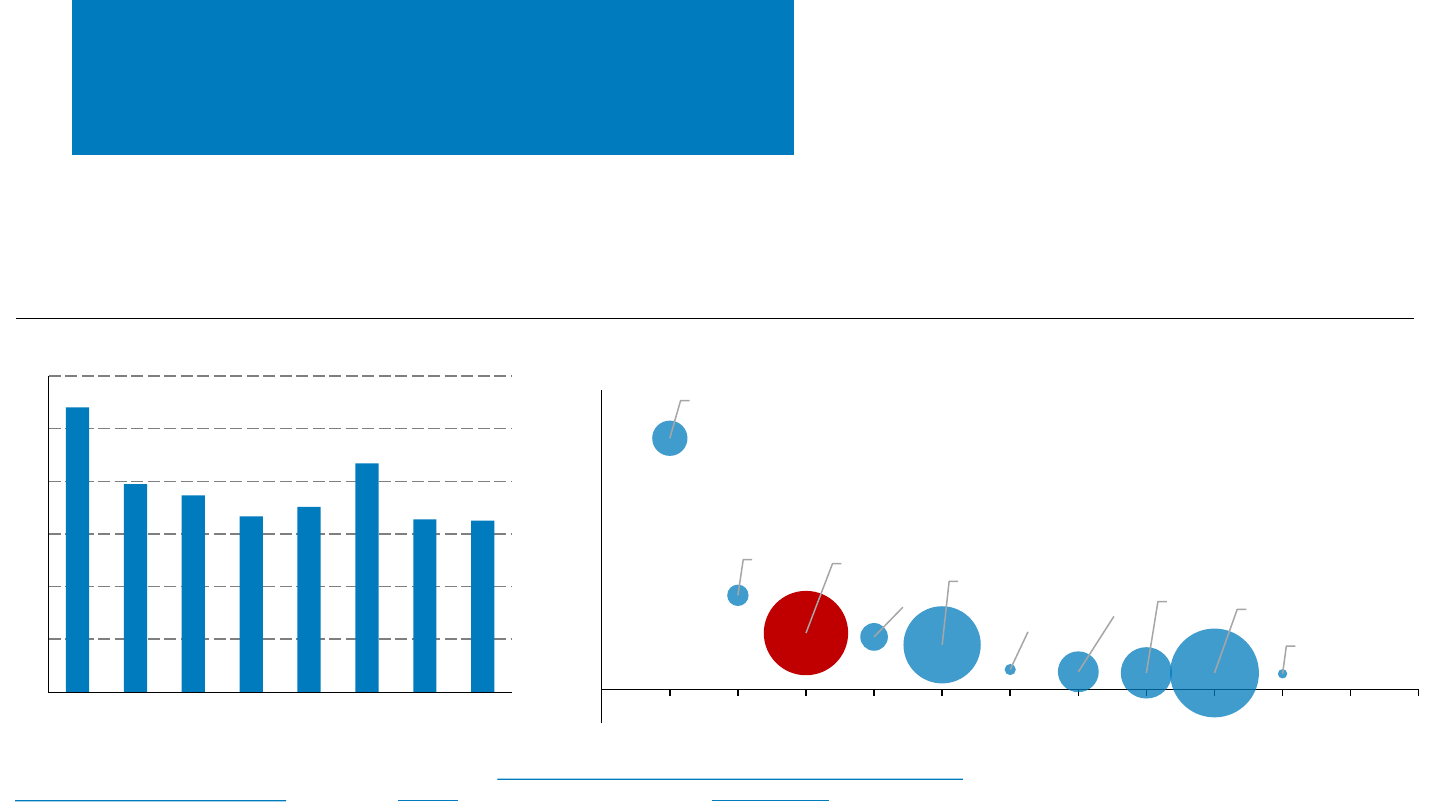
• Japan installed 6.5 GWdc of PV in 2022, about the same as in
2021 as part of a mostly declining trend since the high in 2015.
• Cumulative capacity at the end of 2022 was about 85 GWdc.
• Scarce land and decreasing feed-in tariff rates
continue to constrain PV deployment, while goals
require at least doubling PV capacity by 2030.
• Japan is experimenting with requiring PV on new
buildings and with deploying agrivoltaics.
• Government subsidies stimulated an increase in
corporate PPAs in 2021 (91 MWdc) and 2022 (228
MWdc), most of which were PV PPAs.
China, 39
USA, 14
Japan, 225
India, 24
Germany, 188
Australia, 4
Spain, 53
Italy, 83
S Korea, 249
Brazil, 3
-50
0
50
100
150
200
250
300
350
400
450
0 1 2 3 4 5 6 7 8 9 10 11 12
Cumulative PV capacity (GWdc)
Top 10 countries for PV installed in 2022
Japan’s High PV Density
Cumulative PV capacity per sq km of total (land + water) country area, 2022
Sources: BloombergNEF, 1Q 2023 Global PV Market Outlook; IEA, National Survey Report of PV Power Applications in Japan, 2021; IEA,
Snapshot of Global PV Markets: 2023; PV Magazine (3/21/23); U.S. Central Intelligence Agency, World Factbook.
0
2
4
6
8
10
12
2015 2016 2017 2018 2019 2020 2021 2022
Japan's PV Capacity Additions (GWdc)
NREL | 14NREL | 14
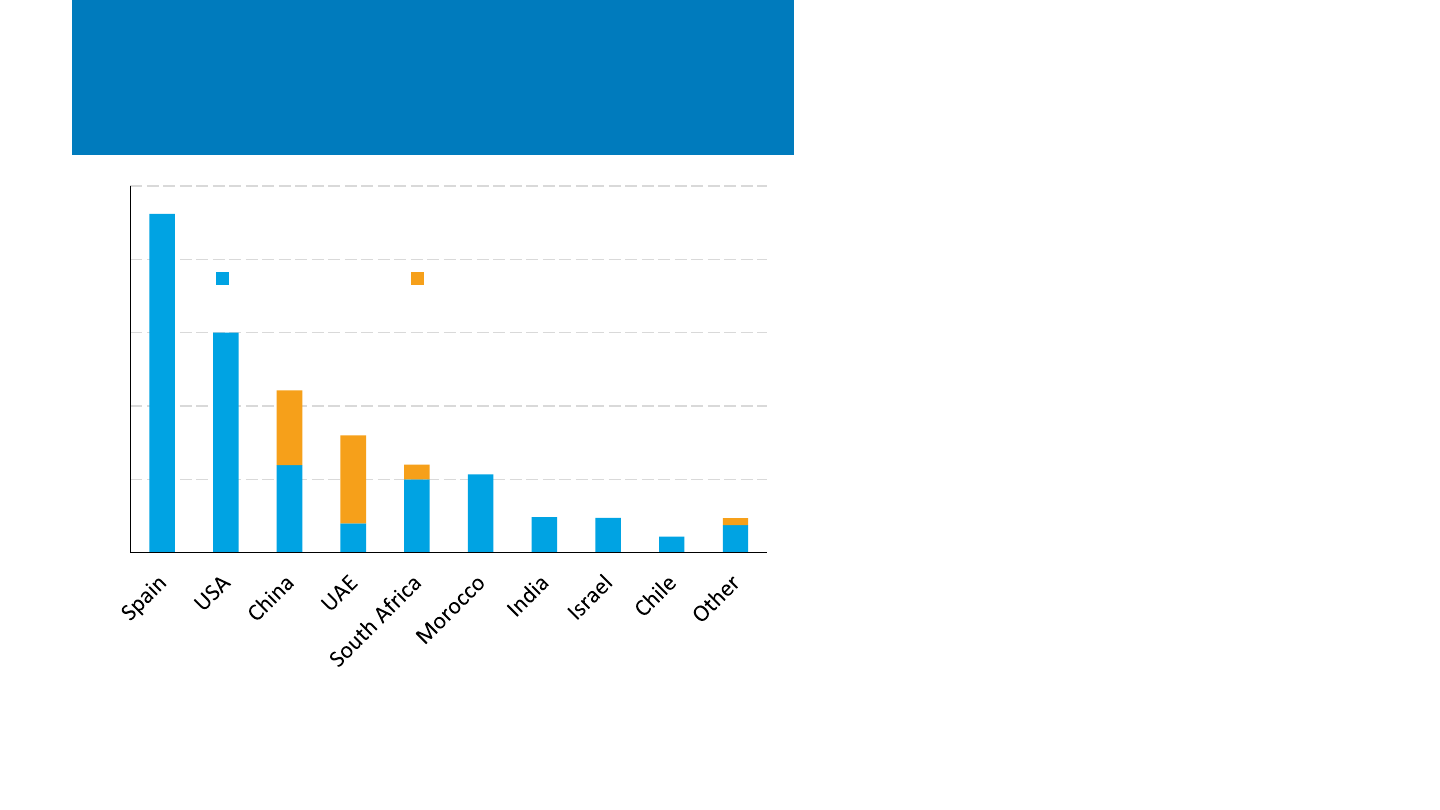
Global CSP Capacity
• At the end of 2022, global CSP capacity reached
approximately 6.4 GW, with 1.3 GW under
construction.
– While no CSP projects were installed in 2022, the Noor
facility in UAE added 100 MW of CSP in February 2023.
– All Chinese CSP projects under construction are co-
located with PV.
• There are an additional 3 GW of CSP projects
under development in China, not included in
these numbers.
Sources: Richard Thonig, Alina Gilmanova & Johan Lilliestam. (2023). CSP.guru 2023-01-01 [Data
set]. Zenodo.https://doi.org/10.5281/zenodo.1318151.
0.0
0.5
1.0
1.5
2.0
2.5
CSP Capacity (GWac)
Operational Under Construction

NREL | 15NREL | 15
Global CSP Capacity
• 73% of current CSP capacity uses parabolic
trough technology, compared to 51% of those
under construction.
Sources: Richard Thonig, Alina Gilmanova & Johan Lilliestam. (2023). CSP.guru 2023-01-01 [Data
set]. Zenodo.https://doi.org/10.5281/zenodo.1318151.
• Over half of CSP projects in operation have storage, with
36% of the capacity having 6 hours or more of storage.
• Projects under construction, on average, have storage,
and longer hours of storage, than those currently in
operation.
0
1
2
3
4
5
6
7
Operational Under Construction
CSP Capacity (GWac)
Technology
Fresnel
Tower
Trough
0
1
2
3
4
5
6
7
Operational Under Construction
CSP Capacity (GWac)
Hours of Storage
10+ hrs.
6-10 hrs.
2-6 hrs.
<2 hrs.
No Storage
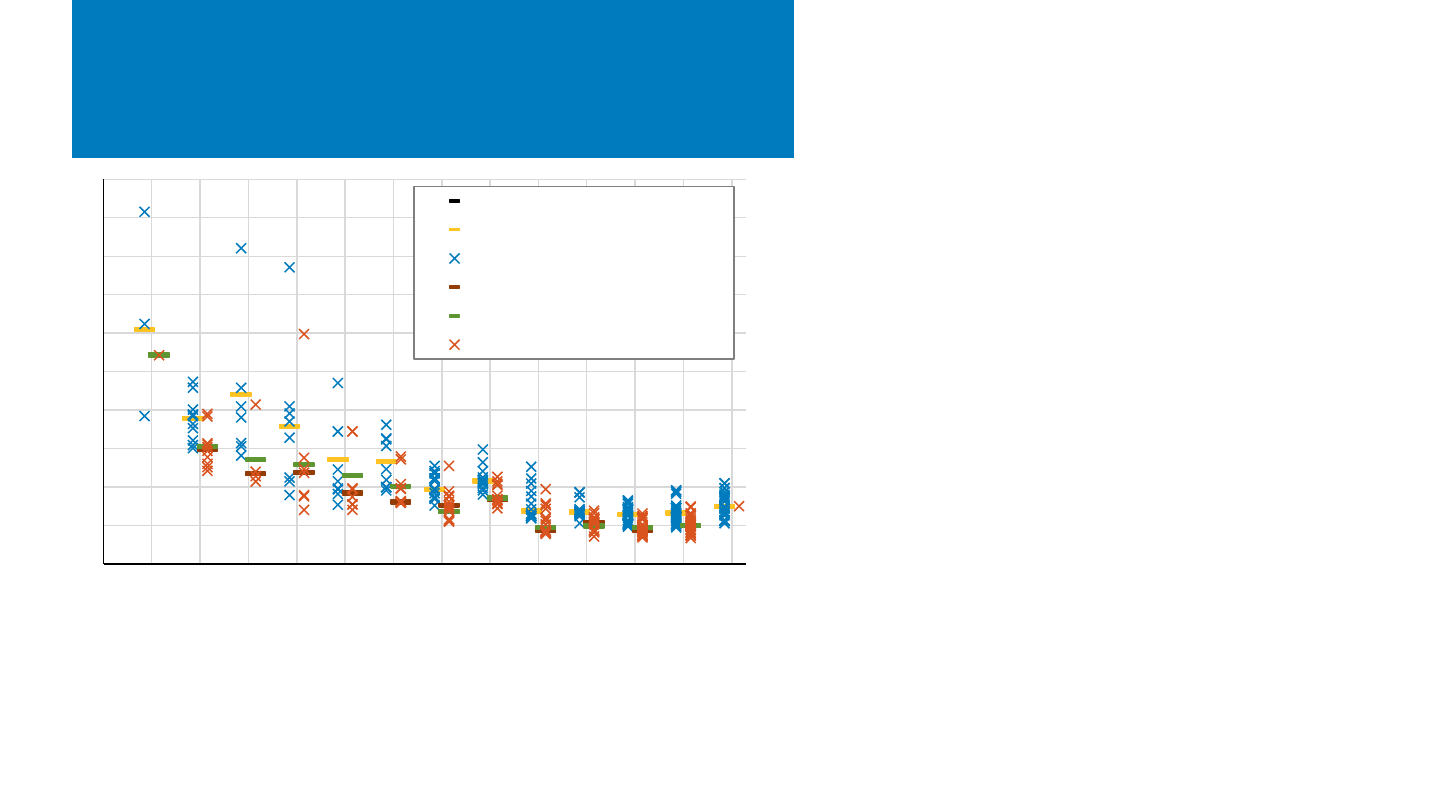
NREL | 16NREL | 16
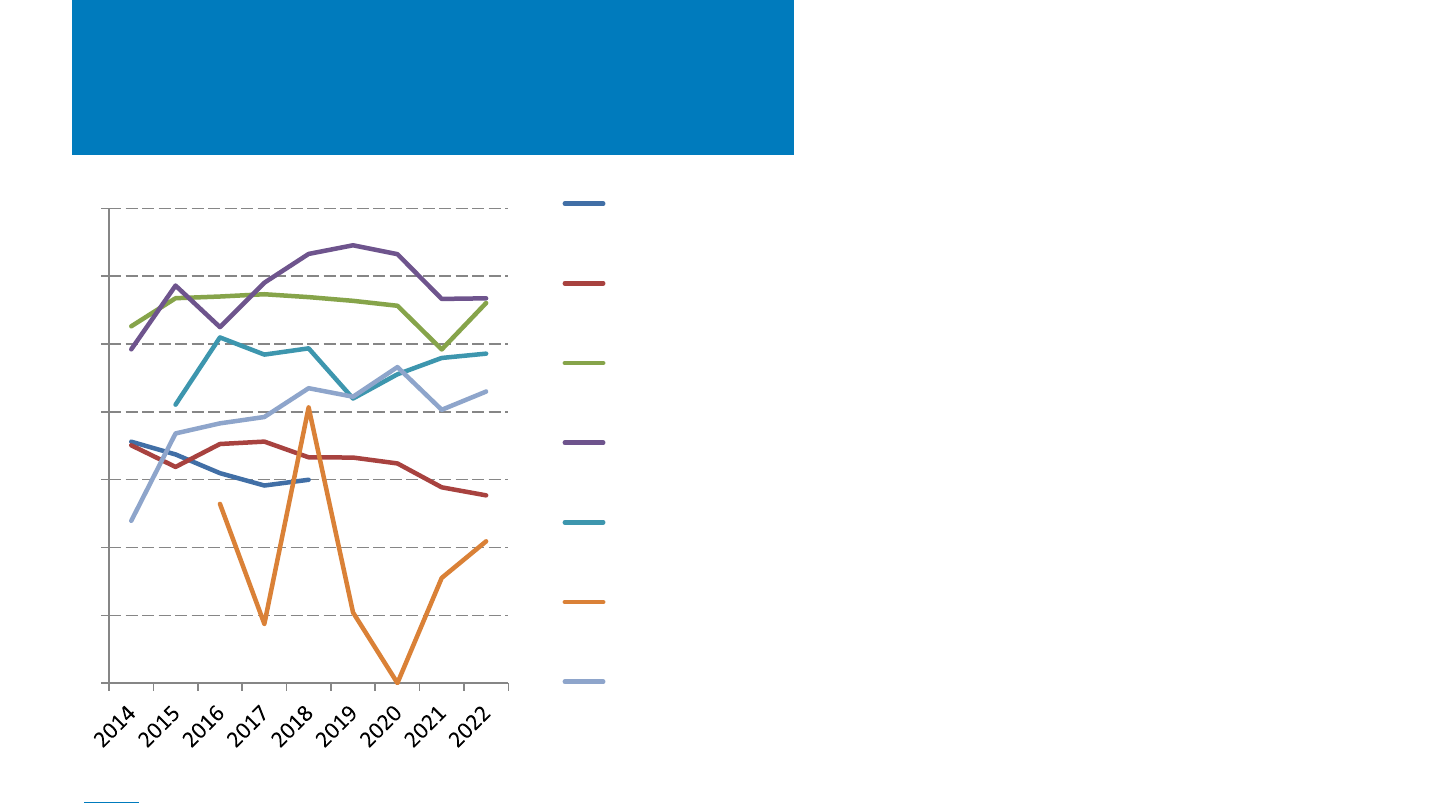
U.S. CSP Project Generation
Performance, 2014–2022
Source: EIA, Form 923.
• While it took a few years to optimize the
operation of the five U.S. CSP plants brought
online from 2013–2015, four of them now
generally perform better than when they
began operation.
– Annual weather variation also caused some
of the differences in annual production.
– Tonopah continues to have, however
produced power for seven months of the
year in 2022 – the most since 2018. In
September and October it reported an
average capacity factor of 29%.
• Absolute capacity factor is not necessarily the
best metric for performance as plants can be
designed and operated differently.
0%
5%
10%
15%
20%
25%
30%
35%
Capacity Factor
SEGS III-IX
(Trough)
Nevada Solar One
(Trough)
Genesis (Trough)
Solana (Trough+6
hours storage)
Mojave (Trough)
Tonopah
(Tower+10 hours
storage)
Ivanpah (Tower)

NREL | 17
Agenda
Global Solar Deployment1
U.S. PV Deployment
2
PV System Pricing
3
Global Manufacturing
4
Component Pricing
5
Market Activity
6
7 U.S. PV Imports
• In 2022, PV represented approximately 46% of new U.S.
electric generation capacity, compared to 4% in 2010.
– Nearly 30 GWac of new installed capacity was either from
renewable energy or battery technologies in 2022, a decline of 7
GWac compared to 2021.
• Solar still represented only 9.0% of net summer capacity
and 4.7% of annual generation in 2022.
– However, 16 states generated more than 5% of their
electricity from solar, with California leading the way at
27.3%.
• The United States installed 17.0 GWac (20.2 GWdc) of PV in
2022, ending the year with 110.1 GWac (140.6 GWdc) of
cumulative PV installations.
• The United States installed approximately 14.1 GWh, 4.8
GWac of energy storage onto the electric grid in 2022, up
34% y/y.

NREL | 18NREL | 18
Recent Solar News (Congressional)
Repeal of the AD/CVD waiver/“bridge”
– On April 1, 2022, at the request of Auxin Solar, Commerce initiated country-wide circumvention inquiries on whether imports of c-Si PV cells and modules
from Cambodia, Malaysia, Thailand, or Vietnam using parts and components from China are circumventing AD and CVD orders.
– On June 6, 2022, President Biden declared an emergency and authorized the temporary extension of time and duty (and deposit)-free importation of solar
cells and modules from Southeast Asia for up to 24 months, over concerns the lack of panel supply would cause electric grid reliability issues.
– In December 2022, the U.S. Department of Commerce issued a preliminary decision to impose anti-circumvention duties on some solar panels and cells
produced in Vietnam, Malaysia, Thailand, and Cambodia. A final determination was set to be due May 1, 2023, but has been extended to August 17
th
, 2023.
– In January 2023, a bipartisan group of lawmakers objected to the two-year waiver under the Congressional Review Act (CRA), which allows Congress to
repeal executive decisions if a simple majority is reached and passed within 60 days.
– On April 18, 2023, a group of over 400 U.S. solar companies led by the Solar Energy Industries Association (SEIA) petitioned Congress to uphold the waiver.
SEIA stated that if the CRA legislation passes, it will eliminate 30,000 U.S. solar jobs, including 4,000 in the manufacturing sector, cost U.S. solar companies
over $1B in retroactive duties, and lead to the cancellation of 4 GW in planned projects.
– On April 28, 2023, the House passed the CRA (221-202) and the Senate passed it on May 3
rd
(56-41). On April 24, the WH promised to veto the legislation.
House debt ceiling bill:
– Repeals the ITC/PTC extension (including the domestic content, energy community, and low-income bonuses, as well as the labor requirements), and the
25D extension (including revoking the battery storage tax credit)
– Repeals the 48C increase (including the energy community and labor requirements) and repeals the MPTC
– Repeals the elective payment and transferability options
– Ultimately repeals or revisits 24 different tax incentives from IRA.
Sources: past 2022 Quarterly Solar Industry Updates, PV Tech in January and in April (18 and 19), WH press release, H.R. ___ - Limit, Save, Grow Act of 2023

NREL | 19NREL | 19
Recent Solar News
• On April 4, 2023, the White House released a Guidebook intended to help Tribal and indigenous communities navigate IRA opportunities. The Guidebook
provides descriptions and eligibility information for Tribes to benefit from IRA grant, loan, and clean energy incentives. It also provides a brief summary of
each program, key dates to watch out for, and important links for further information.
• On April 19, 2023, the EPA released its framework for the Greenhouse Gas Reduction Fund (GGRF), a $27B fund for clean energy projects targeting low-
income and disadvantaged communities.
– The framework outlines three grant competitions: the National Clean Investment Fund ($14B), the Clean Communities Investment Accelerator ($6B), and
the Solar for All competition ($7B), which will provide 60 grants to States, Tribal governments, municipalities, and nonprofits.
– The EPA invites feedback by May 12
th
on this framework, and also plans to hold six public listening sessions.
• Sunnova VPP loan guarantee
– The U.S. Department of Energy Loan Program Office (LPO) announced a conditional commitment of up to $3B in a partial loan guarantee (i.e., a 90%
guarantee of up to $3.3B) to Sunnova to support its Project Hestia. Certain conditions must still be satisfied before the DOE loan guarantee is issued,
including finalization of definitive financing documents.
– Sunnova’s Project Hestia offers disadvantage individuals and communities better access to loans for solar installations, battery systems, or other Sunnova
Adaptive Home™ technologies. To be eligible, the energy system must be outfitted with Sunnova’s VPP-enabling software, which is designed to improve
customer insights regarding their power usage and to facilitate demand response behavior.
– The project is expected to provide loans for ~75,000-115,000 homeowners throughout the United States, with Sunnova targeting 20% of their loans to
homeowners in Puerto Rico and at least 20% to customers with FICO credit scores of 680 or less. The ~568 MW, 25-year project is also estimated to
created 3,400 job.
– Sunnova has agreed to: provide monthly servicing reports supplemented by hardware and software deployment information to DOE, measure the
reduction in greenhouse gases associated with Project Hestia, and deliver collateral pools that realize agreed criteria related to FICO distributions and
certain concentrations of customers located in disadvantaged communities.
Sources: iratracker.org, WH press release, EPA press release, Solar Power World, LPO press release, Sunnova press release
NREL | 20NREL | 20
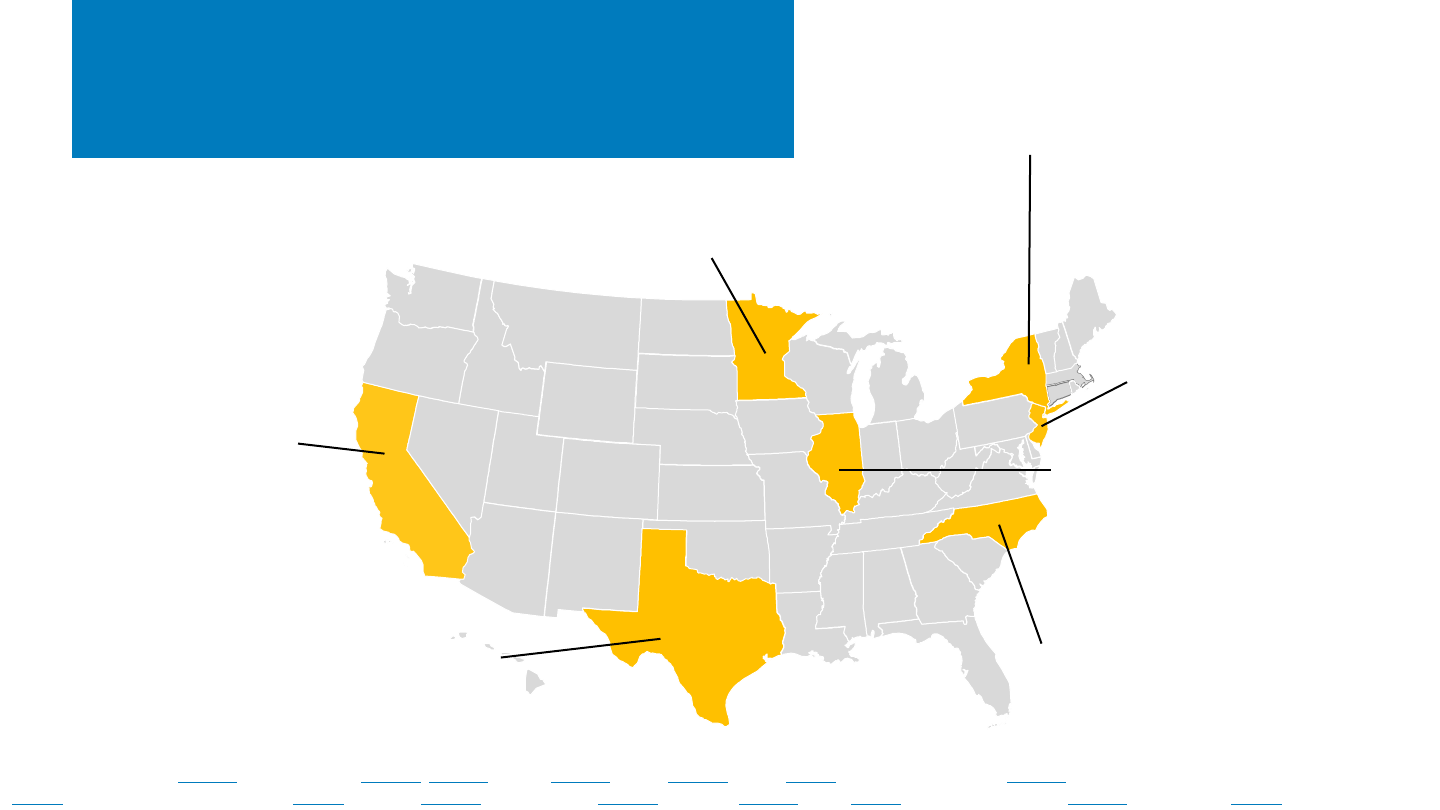
States: Q1 2023 Updates
Source: Canary Media (1/27/23), Canary Media (2/24/23, 3/27/23), CPUC (2/23/23), Grist (9/15/21), Grist (3/2/23), Inside Climate News (2/27/23), New Jersey Legislature
(8/8/22), Office of Governor Tim Walz (2/7/23), Politico (1/30/23), PV Magazine (2/15/23), PV Tech (2/20/23), RMI (3/6/23), State of New Jersey (2/15/23), Utility Dive (2/7/23)
A Minnesota law requires electric utilities to reach 100% carbon-free power
by 2040. North Dakota, an exporter of coal-generated power, is considering
suing Minnesota under the Constitution’s Dormant Commerce Clause.
Three executive orders
accelerate New Jersey’s
100% zero-carbon electricity
target by 15 years, to 2035.
Legislation is required to
implement the orders. A bill
revising the state’s
renewable portfolio standard
was introduced in 2022.
A controversial Illinois law prevents
local governments from limiting or
banning solar and wind in support of
the state’s 2021 law targeting
carbon-free power by 2045.
California and New York have taken
similar actions.
A New York State Public Service Commission
authorization provides $4.4 billion to fund 62
local transmission upgrades, which will enable 3.5
GW of renewable energy capacity. The upgrades
are expected in the 2024–2030 timeframe.
A California Public Utilities
Commission (CPUC) order
requires 4 GW of zero-
carbon capacity by 2027, to
support grid reliability and
decarbonization, in addition
to 11.5 GW ordered in 2021.
CPUC also approved an
integrated resource plan
targeting 86 GW of new
resources—mostly solar and
batteries—by 2035.
Texas’ Aggregated Distributed Energy Resources
Pilot Program is enabling controllable energy
equipment (such as PV + storage) on homes and
businesses to act as virtual power plants.
A utilities commission ruling in North
Carolina adds rooftop PV minimum
bills, introduces time-of-use rates, and
incentivizes PV-plus-storage systems.
NREL | 21NREL | 21
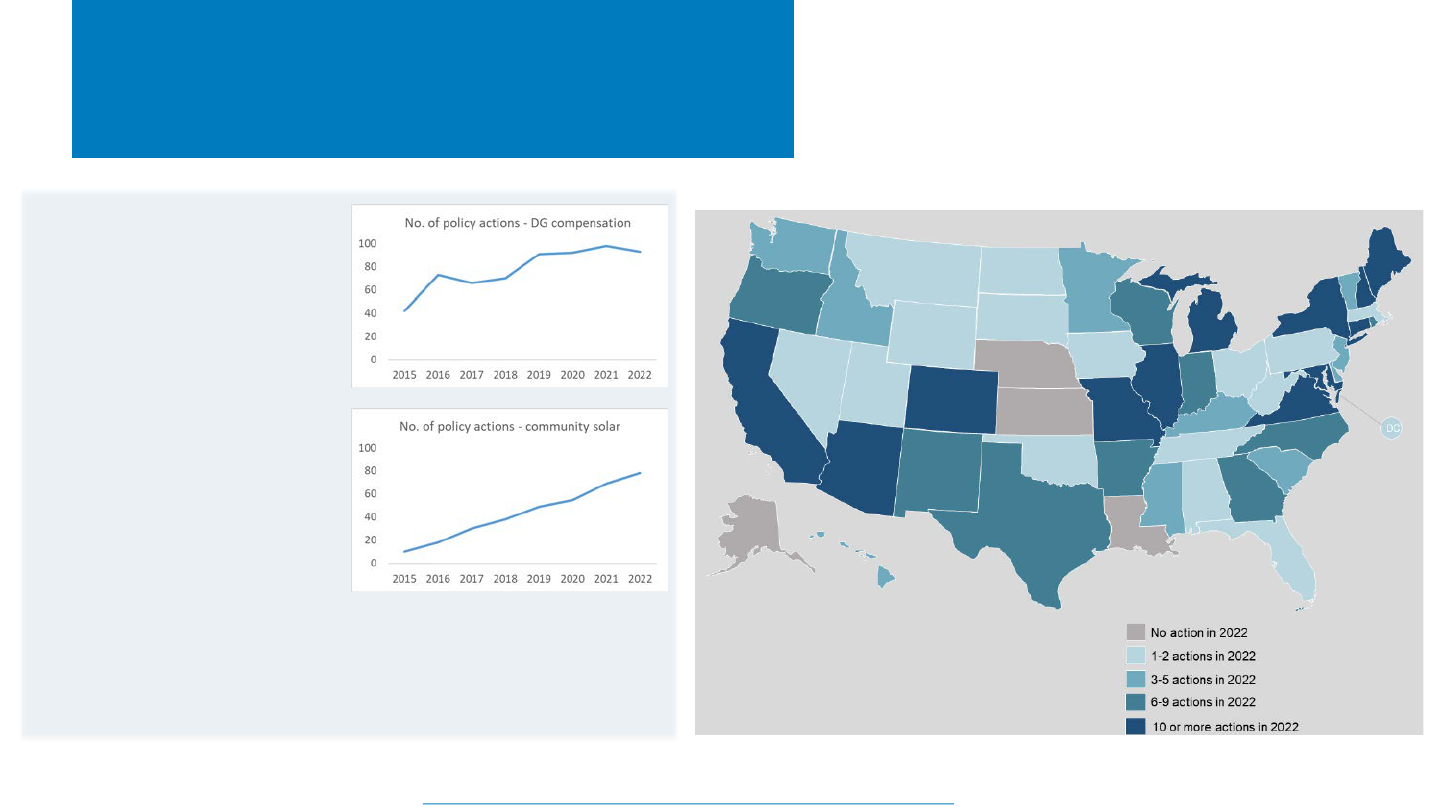
States: 2022 Year-in-Review
Source: North Carolina Clean Energy Technology Center, The 50 States of Solar: 2022 Policy Review and Q4 2022 Quarterly Report, January 2023. Map reproduced with permission.
Top Solar Policy Trends of 2022
• Less use of traditional net
metering
• More use of net billing and
time-varying compensation
• More consideration of grid-
access fees and minimum bills
(with mixed results)
• Incorporation of PV provisions
specific to low- and medium-
income households
• Consideration of community
solar programs
• Promotion of PV + battery
systems
• Linking of labor requirements with PV programs
• Increased complexity of PV programs
• Use of iterative approaches to PV program design.
Number of solar policy and rate design actions in 2022
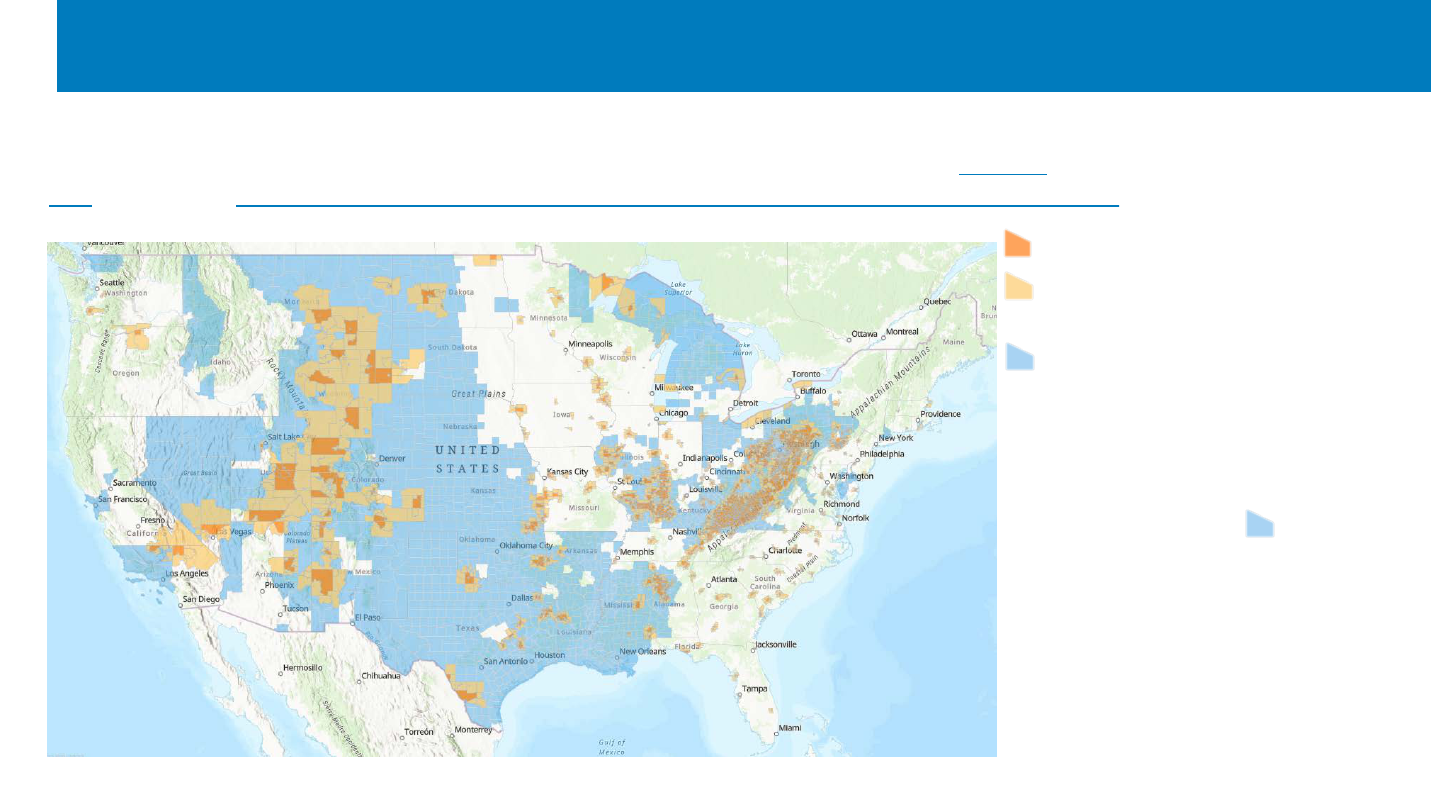
Energy Communities Bonus Credit Program: a 10% increase to the Investment or Production Tax Credits (ITC/PTC) to brownfields, fossil
fuel communities with high unemployment, and coal closure communities. Treasury released guidance on April 4
th
, including releasing a
map hosted by the Interagency Working Group on Coal & Power Plant Communities & Economic Revitalization, DOE and IRS.
- Coal Closure Community
- Adjacent to a Coal Closure
Community
- Metropolitan or Non-Metropolitan
Statistics Areas that meet the Fossil
Fuel Employment Threshold
*Unemployment rates from 2022 are
not yet available, so the areas are
not yet confirmed as energy
communities.*
Not depicted:
- Brownfields
- Fossil fuel communities as
determined based on tax revenue.
New Guidance on the Energy Communities Bonus

New Guidance on the Energy
Communities Bonus
• Brownfield Category: Treasury clarified that any federal, state, territory, or federally recognized Indian tribal
assessment process is sufficient to qualify, or the completion of an ASTM E1903 Phase II Environmental Site
Assessment (Phase I for < 5 MW
ac
sites) to confirm the presence of hazards and/or pollutants.
• Statistical Area Category (a.k.a. Fossil Fuel Communities w/High Unemployment): Treasury clarified how
metropolitan and non-metropolitan statistical areas were defined, how fossil fuel employment was defined, and
how unemployment rates are calculated (and how those rates will be updated annually each May).
– Treasury has invited public comments by May 4
th
addressing possible data sources, revenue categories, and procedures for determining
eligibility based on Fossil Fuel Tax Revenue (instead of Fossil Fuel Employment).
• Coal Closure Category: Treasury clarified that census tracts are defined via the 2020 census, how a coal mine is
deemed abandoned, how a coal-fired electric generating unit is deemed retired, and that “directly adjoining” is
defined as a single point of contact.
• Timing:
– For the PTC: the facility can located within an energy community for any part of the taxable year.
– For the ITC: the facility must be within an energy community when it is placed in service.
– Grandfather clause: If a facility begins construction within an energy community, the location can continue to be considered an energy
community for the duration (for ITC or PTC).
• Location: ≥50% of a facility’s nameplate capacity (dc for solar, MWh for storage, ac otherwise) must be within the
boundaries of an energy community. Offshore projects can attribute their capacity to their land-based
transmission/distribution equipment that is closest to the point of interconnection.

Canada via Budget 2023
• Clean Electricity Investment Tax Credit: 15% refundable tax credit for eligible investments in non-emitting electricity generation
(wind, solar, hydro, nuclear, abated natural gas), storage, and transmission equipment, lasts from 2024-2034, and includes labor
incentives.
• Investment Tax Credit for Clean Technology Manufacturing: 30% refundable tax credit on the cost of investments in new machinery
and equipment used to manufacture or process clean technologies, or extract/process/recycle critical minerals.
• "Canada must either meet this historic moment - this remarkable opportunity before us - or we will be left behind.“
• These two tax credits are estimated to cost $25.7B + $11.1B = $36.8B CAD.
Australia via the National Reconstruction Fund
• $15B AUD fund to invest in 7 “priority areas” for the Australian economy:
- Renewables and low-emission technologies were one category, as was mining and raw material processing.
- $3B AUD was allocated for investing in: green metals; clean energy component manufacturing; hydrogen electrolyzers and fuel
switching; and agricultural methane reduction and waste reduction.
- $1B AUD was allocated for investment in advanced manufacturing.
• One of “the largest peacetime investments in Australian manufacturing capability.”
Source: Chapter 3: A Made-In-Canada Plan: Affordable Energy, Good Jobs, and a Growing Clean Economy | Budget 2023, National Reconstruction Fund | Policies | Australian Labor Party (alp.org.au),
Australia’s Response To Inflation Reduction Act | TaiyangNews
International Versions of IRA
Low-Income Communities Bonus Credit Program (48(e)), awards an upfront 10% or 20% bonus tax credit for a maximum of 1.8 GW
dc
per
year of solar projects ≤ 5 MW
ac
in size. Treasury announced in February how the credits would be allocated in 2023:
700 MW 200 MW
10% credit low-income community as defined by the New Markets Tax Credit Indian Land
20% credit qualified low-income economic benefit project
qualified low-
income residential
building
Applications in Q3 2023
Applications after
Q3 2023
Treasury and the IRS can reallocate excess capacity to any oversubscribed categories, with any unallocated capacity rolling over. Only the
owner of the project can apply; projects cannot apply to more than one category; and projects placed in service prior to receiving an
awarded an allocation are not eligible.
Treasury is still developing additional selection criteria, which may include 1) ownership by community-based organizations and mission-
driven entities; 2) encourages new market participants; 3) provide substantial benefits to low-income communities and individuals
marginalized from economic opportunities; and 4) have a high degree of commercial readiness.
Most of the guidance only applies to 2023 allocations and further guidance is still required in many key areas (to be provided later).
New Guidance on the Low-Income Communities Bonus
1
3
2
4

On February 13, as mandated by law, the IRS issued guidance on the two Treasury tax credit programs with an allocation process.
• Advanced Energy Project Credit (48C ITC), administered by DOE’s MESC, awards an upfront 30% tax credit (if labor requirements are met)
for capital investments made to purchase and commission an industrial or manufacturing facility.
– 48C was originally established under the 2009 ARRA with $2.3B in funding and with a scope only covering green manufacturing.
– IRA reestablished the program, expanding eligibility to include industrial facilities, and authorizing $10B in allocated tax credits, with
$4B of the allocations going to projects in “energy communities” and that have not been allocated a credit before.
• Notable 48C guidance issues on February 13
th
– Selection will follow the standard DOE two-step FOA process of concept papers which received encourage/discourage letters, followed
by review of a full application. The program will begin accepting concept papers on May 31, 2023, for a first round of $4 billion in
credits, with approximately $1.6 billion reserved for projects in energy communities. Concept papers will be due no later than July 31,
2023.
– The IRS will provide additional guidance May 31, 2023 on the technical review criteria that will be used to evaluate proposals. The IRS
anticipates the criteria will include net impact on greenhouse gas reduction; community benefits of the project (community and labor
engagement, as well as high quality, accessible jobs, and workforce pathways); the extent to which the proposed project addresses
specific gaps, vulnerabilities, or risks to domestic clean energy production (including the risk associated with foreign involvement); and
others.
– Appendix A of the Notice provides further guidance by giving examples of property, product, and technology that are eligible and
ineligible. Solar property is defined quite broadly.
New Guidance Issued on 48C
NREL | 27NREL | 27
U.S. Generation, 2012–2022
Sources: U.S. Energy Information Administration (EIA), “Electricity Data Browser.” Accessed April 10, 2023; and a Today In Energy article (March 27, 2023).
• The United States generated 4,300 terawatt-hours (or
4.3 petawatt-hours) of electric power last year.
• Energy generation from renewables continued its
steady upward trend, as a result of increases in both
wind and solar generation.
– Solar and wind generation combined accounted for
15% of electric generation in 2022, up from 13% in
2021.
• The percentage of electricity generated by fossil fuels
in the United States dropped from 69% in 2012 to 60%
in 2022, while the percentage of electricity generated
by renewable generation increased from 12% to 23%
over the same period.
• In 2022, renewable energy facilities continued to
produce more electricity than both nuclear and coal
sources.
– EIA attributed the decrease in coal-fired generation to
several plants retiring and the remaining plants being
less used. The decrease in nuclear generation was
similarly the result of the Palisades nuclear power
plant retiring.
12%
23%
9%
10%
4%
5%
0
200
400
600
800
1,000
1,200
1,400
1,600
1,800
2012 2014 2016 2018 2020 2022
Annual Generation (TWh)
Coal
Natural gas
Nuclear
Renewables
Hydro
Wind
Geothermal
Other
Solar
NREL | 28NREL | 28
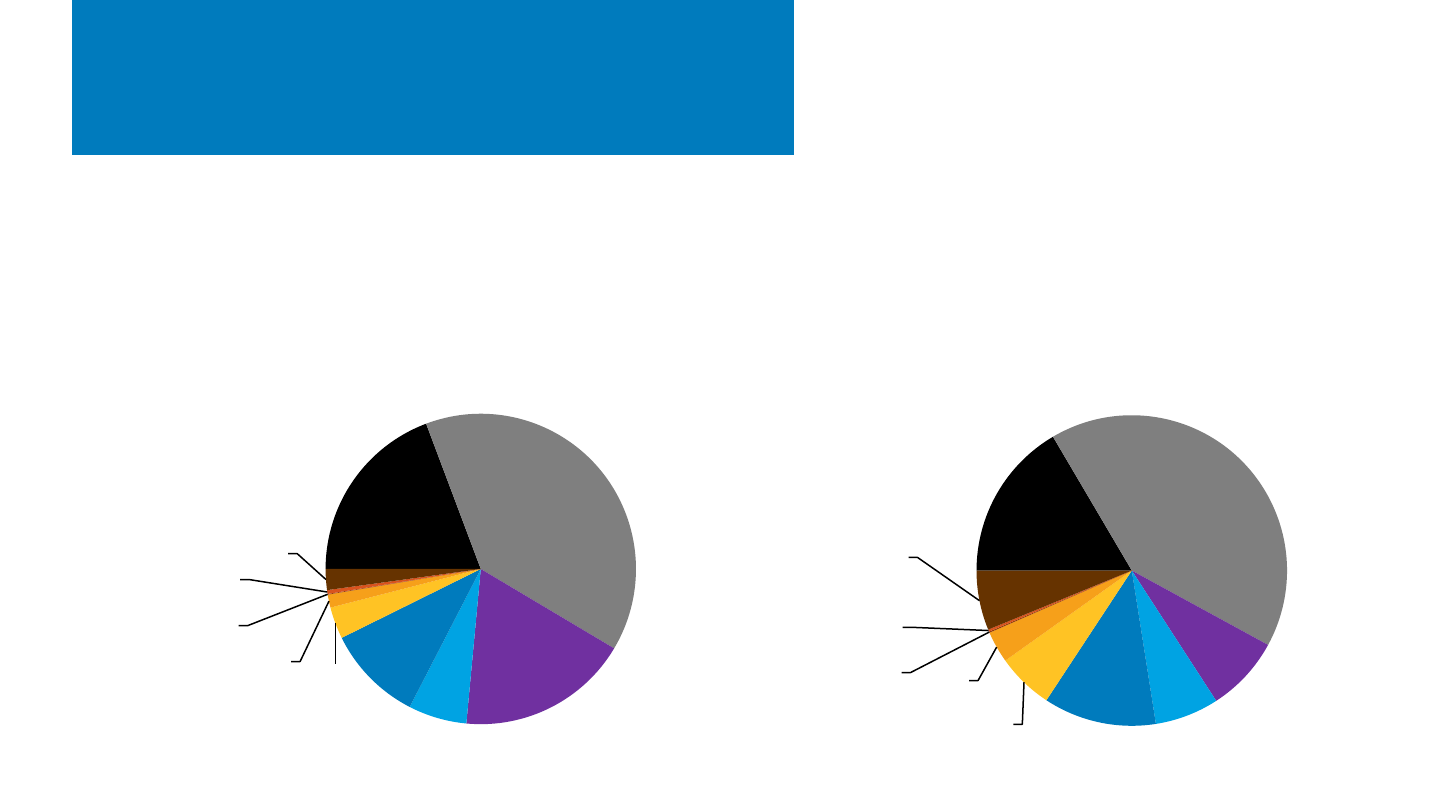
2022 U.S. Generation and Capacity
Sources: EIA, “Electric Power Monthly” Tables 6.1, 6.1A, February 2023, “Electricity Data Browser,” April 10, 2023.
• Renewables are becoming an increasingly large part of the U.S.
electric generation mix, representing 28% of capacity and 23% of
generation in 2022.
– Adding nuclear, non-carbon sources represented 36% of
capacity and 41% of generation.
• Solar still represents a small but growing
percentage of the U.S. electric generation mix.
– In 2021, solar represented 9.0% of net
summer capacity and 4.7% of annual
generation.
• Capacity is not proportional to generation, as
certain technologies (e.g., natural gas) have lower
capacity factors than others (e.g., nuclear).
Coal
19%
Natural gas
39%
Nuclear
18%
Hydro
6%
Wind
10%
UPV
3.3%
DPV
1.4%
CSP
0.1%
Geothermal
0.4%
Other
2.2%
2022 U.S. Generation (Total 4,302 TWh)
Coal
17%
Natural gas
41%
Nuclear
8%
Hydro
7%
Wind
12%
UPV
5.9%
DPV
3.3%
CSP
0.1%
Geothermal
0.2%
Other
6%
2022 U.S. Generation Capacity (Total 1.2 TW)
NREL | 29NREL | 29
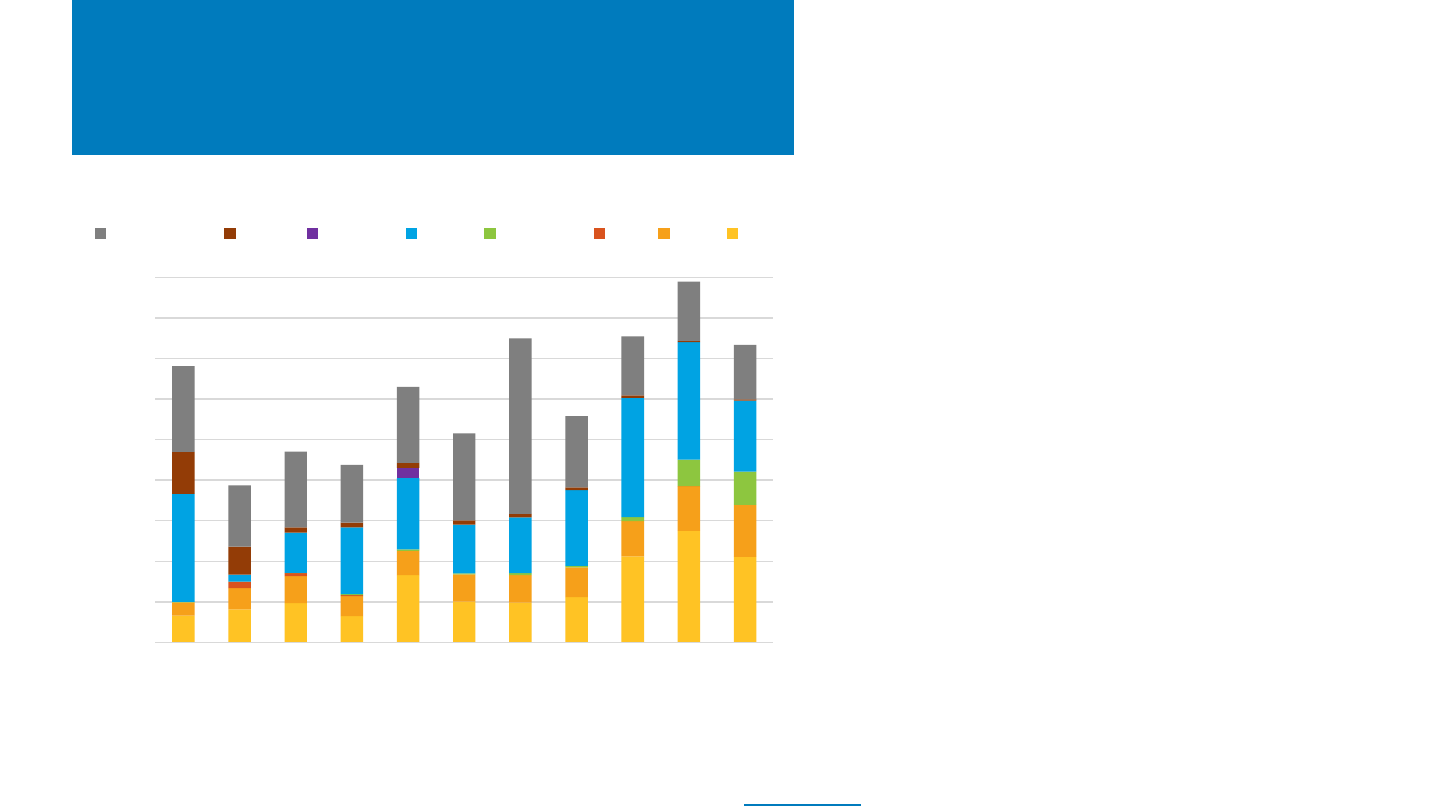
New U.S. Capacity Additions,
2012–2022
Note: “Other” includes coal, geothermal, landfill gas, biomass and petroleum.
Sources: EIA, “Electric Power Monthly” Tables 6.1, 6.2B, 1.1, 1.1A; Forms 860M & 861M. April 2023. Today in Energy.
• In 2022, PV represented approximately 46% of
new U.S. electric generation capacity (29% UPV,
17% DPV), compared to 15% in 2012.
– Wind represented 24% of added capacity
and batteries an additional 11%, for a total
of 81% of capacity additions from those
three technologies.
• Nearly 30 GW
ac
of new installed capacity was
either from renewable energy or battery
technologies in 2022, a decline of 7 GW
ac
compared to 2021.
– Both solar and wind installations declined
in 2022, although solar installations still
nearly doubled that of wind.
– Only battery installations grew from 3.3 to
4.1 GW
ac
in 2022.
0
5
10
15
20
25
30
35
40
45
2012 2013 2014 2015 2016 2017 2018 2019 2020 2021 2022
U.S. Electric Capacity Additions (GW
dc
)
Natural gas Other Nuclear Wind Batteries CSP DPV UPV
NREL | 30NREL | 30
0
10
20
30
40
50
60
70
80
U.S. Generation Capacity Additions (GWac)
Other
Nuclear
Natural Gas (Other)
Natural Gas CT
Natural Gas CC
Batteries
Wind
DPV
UPV
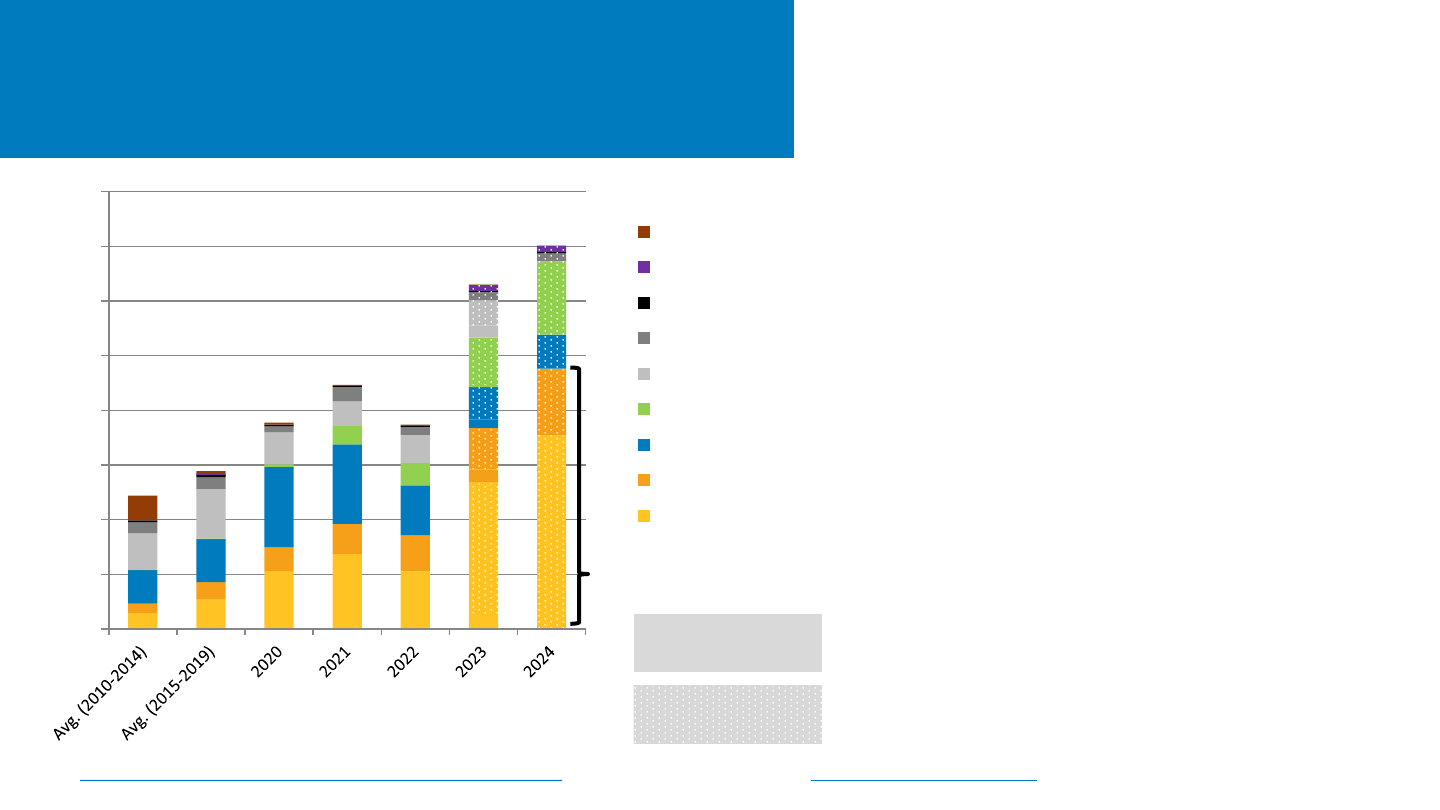
68%
U.S. Generation Capacity Additions by Source:
2010–2022 and Planned 2023–2024
Sources: EIA Form 860M/Preliminary Monthly Electric Generator Inventory (“Planned” and “Operating”) and EIA Short-term Energy Outlook Table 7e,
downloaded April 25, 2023; Wood Mackenzie and SEIA US Solar Market Insight Full Report 2022 Year in Review, Mar 2023.
• EIA projects the percentage of U.S. electric capacity
additions from solar will grow from 46% in 2022
(17 GWac) to 58% in 2023 (37 GW
ac
), and 68% (47
GWac) in 2024.
– Wind accounts for 12% and batteries 14%, and nuclear
2% of estimated capacity in 2023; in 2024 those
percentages are 9%, 19%, and 2%, respectively.
– Natural gas accounts for the remaining 13% in 2023.
• Over the next two years, EIA projects there will be
nearly 100 GWac of capacity additions from wind
and solar alone.
• Wood Mackenzie/SEIA projects 26-30 GW
dc
of solar
installations in 2023 and 30-36 GW
dc
in 2024,
depending both on favorable supply chain
conditions (both domestic and international) as
well as the ability to optimize the Inflation
Reduction Act bonus credits.
– Over the next five years, Wood Mackenzie/SEIA
projects about 20 GWdc upside or downside relative to
their base case as a result of these factors.
Began operating
through March 2022
Planned April 2023
and full 2024
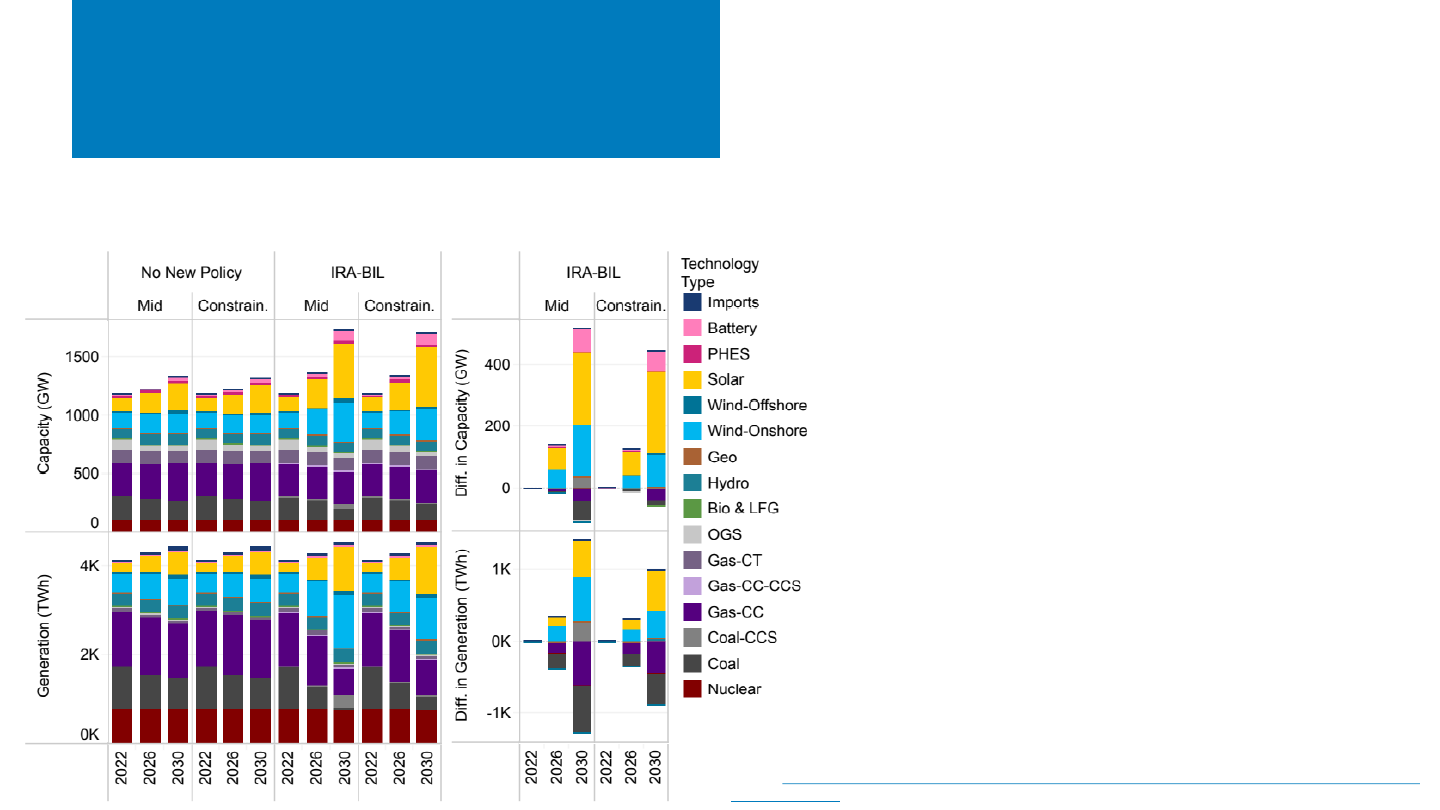
NREL Report on Projected
BIL + IRA Impacts
Using ReEDS (the Regional Energy Deployment System), a team at NREL looked at the impact of IRA + BIL on the contiguous U.S.
power sector from 2023 to 2030. They found:
• Clean electricity could grow from 41% of total
generation in 2022, to 71-90% by 2030.
– Without IRA+BIL, clean electricity would only
account for 46-52% of the grid.
– This is mainly the result of increased production
from wind and solar, supplemented by battery
storage and long-distance transmission.
• Annual power sector CO
2
emissions could decline
by 72-91% below 2005 levels by 2030.
– Estimated avoided climate damages range from $160B
to $230B.
• IRA+BIL are estimated to lead to a net decrease in
power system costs of $8B-$25B annually by 2030
or $50B-115B from 2023 to 2030.
• Annual average deployment rates for wind and
solar combined range from 44 GW/yr–93 GW/yr.
Source: Evaluating Impacts of the Inflation Reduction Act and Bipartisan Infrastructure Law on the U.S. Power
System (nrel.gov)
NREL | 32NREL | 32
U.S. Installation Breakdown
Annual: EIA (GWac)
• The United States installed 17.0 GWac of PV in 2022—down 12%
y/y.
– Residential (5.2 GWac), was up 30%, however C&I (1.3
GWac), and utility-scale PV (10.6 GWac) were down 19% and
23%, respectively, in 2022.
• Approximately 52% of U.S. PV capacity installed in
2022 was in Texas, Florida, and California.
• Despite a concentration of PV installations in the
top three markets, diversification of growth
continues across the United States.
– 20 states had more than 1 GWac of cumulative PV
installations at the end of 2022 (Oregon achieved
this distinction for the first time in 2022), and 29
states installed more than 100 MWac in 2022.
13.2
1.5
3.9
Texas
18%
Southwest
9%
Florida
10%
California
24%
Midwest
10%
Southeast
14%
Northeast
11%
Other
4%
2022 U.S. PV Installations by Region
(17.0 GWac)
5.7
11.3
8.4
8.3
9.3
15.0
19.3
17.0
0
5
10
15
20
25
2015 2016 2017 2018 2019 2020 2021 2022
PV Installed (GWac)
U.S. PV Installations by Market Segment
Residential PV Non-Residential PV Utility PV
Note: EIA reports values in Wac which is standard for utilities. The solar industry has traditionally reported in Wdc.
Sources: EIA, “Electric Power Monthly,” forms EIA-023, EIA-826, and EIA-861 (March 2023, April 2022, February 2021, February 2019).
NREL | 33NREL | 33
0
5
10
15
20
25
30
Annual PV Installed (GWdc)
U.S. PV Installations by Market Segment
Utility
Nonresidential PV
Residential PV
U.S. Installation Breakdown
Annual: SEIA (GWdc)
• SEIA reports that the United States installed 20.2 GWdc of PV in 2022
(140.6 cumulative)—an annual decrease of 16% y/y.
– 11.8 GWdc UPV (-31% y/y), 2.4 GWdc Non-residential (-10% y/y), and
5.9 GWdc Residential (40% y/y).
• Q4 2022 installations totaled 6.6 GWdc.
• In 2022, 50% of installed capacity occurred in California,
Texas, and Florida, however 28 states installed more
than 100 MW.
Sources: Wood Mackenzie/SEIA: U.S. Solar Market Insight: 2022 YIR.
Unlike the previous slide, these values are in GWdc—not GWac.
California
24%
Texas
17%
Southwest
10%
Florida
9%
Southeast
15%
Northeast
11%
Midwest
8%
Other
6%
2022 U.S. PV Installations by Region
(20.2 GWdc)
NREL | 34NREL | 34
27.3%
23.3%
19.3%
18.5%
17.0%
11.5%
11.0%
9.9%
8.9%
7.0%
6.8%
6.3%
6.1%
5.7%
5.6%
5.4%
4.7%
0%
5%
10%
15%
20%
25%
30%
CA NV MA VT HI UT RI AZ NC ME NJ CO NM GA VA FL U.S.
Solar Generation as a Percentage of Total
Net Generation
CSP
Residential
C&I
UPV
Solar Generation as a Percentage
of Total Generation, 2022
• During 2022, 16 states generated more than 5%
of their electricity from solar, with California
leading the way at 27.3%.
– Five states (California, Nevada, Massachusetts,
Vermont, and Hawaii) generated more than 15% of
their electricity using solar.
– These five states have consistently led in solar
generation for several years, although Nevada
overtook Massachusetts and Vermont overtook
Hawaii relative to 2021.
– Colorado, Maine, Georgia, Virginia, and Florida all
recently surpassed 5% solar generation.
Interestingly, despite having significant levels of
deployment, Texas, at 4.8%, has yet to hit this
threshold.
• Nationally, 4.7% of electricity was generated
from solar—up from 3.9% during calendar year
2021.
• The roles of utility and distributed solar varies
by state. Southern and Western states rely more
on utility-scale solar, while northern states and
Hawaii rely more on distributed solar.
Note: EIA monthly data for 2022 are not final. Additionally, smaller utilities report information to EIA on a yearly basis, and
therefore a certain amount of solar data has not yet been reported. “Net Generation” includes distributed PV generation. Net
generation does not take into account imports and exports to and from each state, and therefore the percentage of solar
consumed in each state may vary from its percentage of net generation.
Source: U.S. Energy Information Administration (EIA), “Electricity Data Browser.” Accessed March 31, 2023.
▲ ▼ ▲ ▼
NREL | 35NREL | 35
Solar Generation as a Percentage
of Total Generation, 2012–2022
• In 2012, solar produced approximately
0.3% of total U.S. electric generation.
• By 2022, solar grew to 4.7% of electric
generation.
– 3.3% from utility-scale PV (UPV), a nearly
40-fold increase
– 1.4% from distributed PV (DPV), a 9-fold
increase
– 0.1% from concentrating solar power
(CSP), a 3-fold increase.
Note: EIA monthly data for 2022 are not final. Additionally, smaller utilities report information to EIA on a yearly basis, and
therefore, a certain amount of solar data has not yet been reported.
Source: U.S. Energy Information Administration, “Electricity Data Browser.” Accessed April 10, 2023.
0.0%
0.5%
1.0%
1.5%
2.0%
2.5%
3.0%
3.5%
4.0%
4.5%
5.0%
2012 2013 2014 2015 2016 2017 2018 2019 2020 2021 2022
Percent of U.S. Electric Generation
CSP
DPV
UPV
NREL | 36NREL | 36
5
10
15
20
25
Dec-13
Jun-14
Dec-14
Jun-15
Dec-15
Jun-16
Dec-16
Jun-17
Dec-17
Jun-18
Dec-18
Jun-19
Dec-19
Jun-20
Dec-20
Jun-21
Dec-21
Jun-22
Dec-22
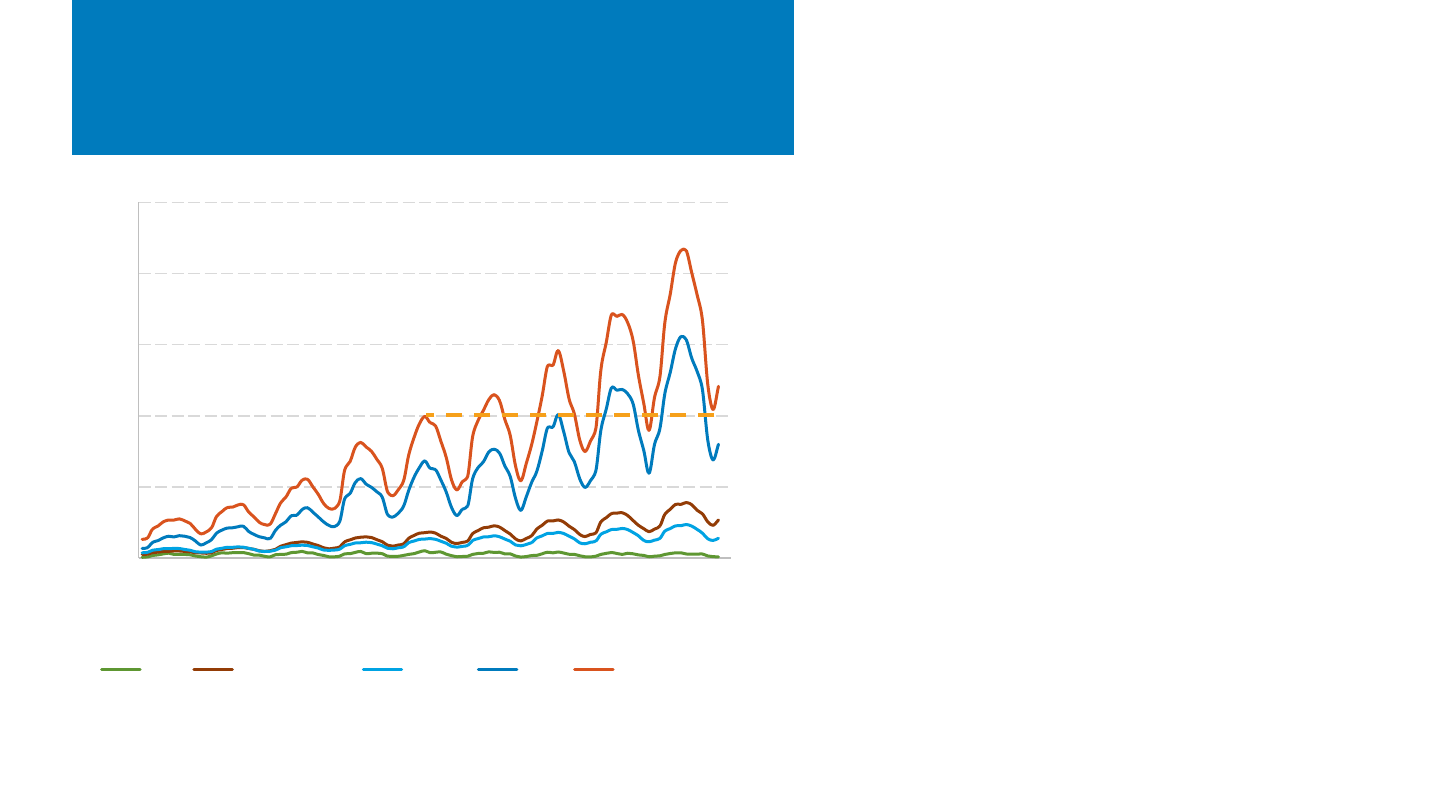
U.S. Solar Electric Generation (TWh)
CSP Residential PV C&I PV UPV Total PV
Monthly U.S. Solar Generation,
2014–2022
• Total peak monthly U.S. solar generation increased
by a factor of 7.2 from 2014 to 2022.
– U.S. electric generation in December 2022 (during the
low seasonal period of electric generation) was above
the peak solar production in 2018 (orange dotted line).
– In April 2022, solar produced 5.8% of all U.S. electricity
production, and produced over 5% of all U.S.
electricity production in April, May, June, September,
and October of 2022.
• Utility-scale solar electricity production (including
PV and CSP technologies) dropped by 56% from its
summer peak (June 2022) to its winter low
(December 2022), and DPV systems dropped 47%.
– The drop in production would likely be greater without
continued builds of solar installations throughout the
year.
Note: EIA monthly data for 2022 are not final. Additionally, smaller utilities report information to
EIA on a yearly basis, and therefore, a certain amount of solar data have not yet been reported.
“Net Generation” includes DPV generation.
Sources: EIA, “Monthly Energy Review,” (April 2023).
NREL | 37NREL | 37
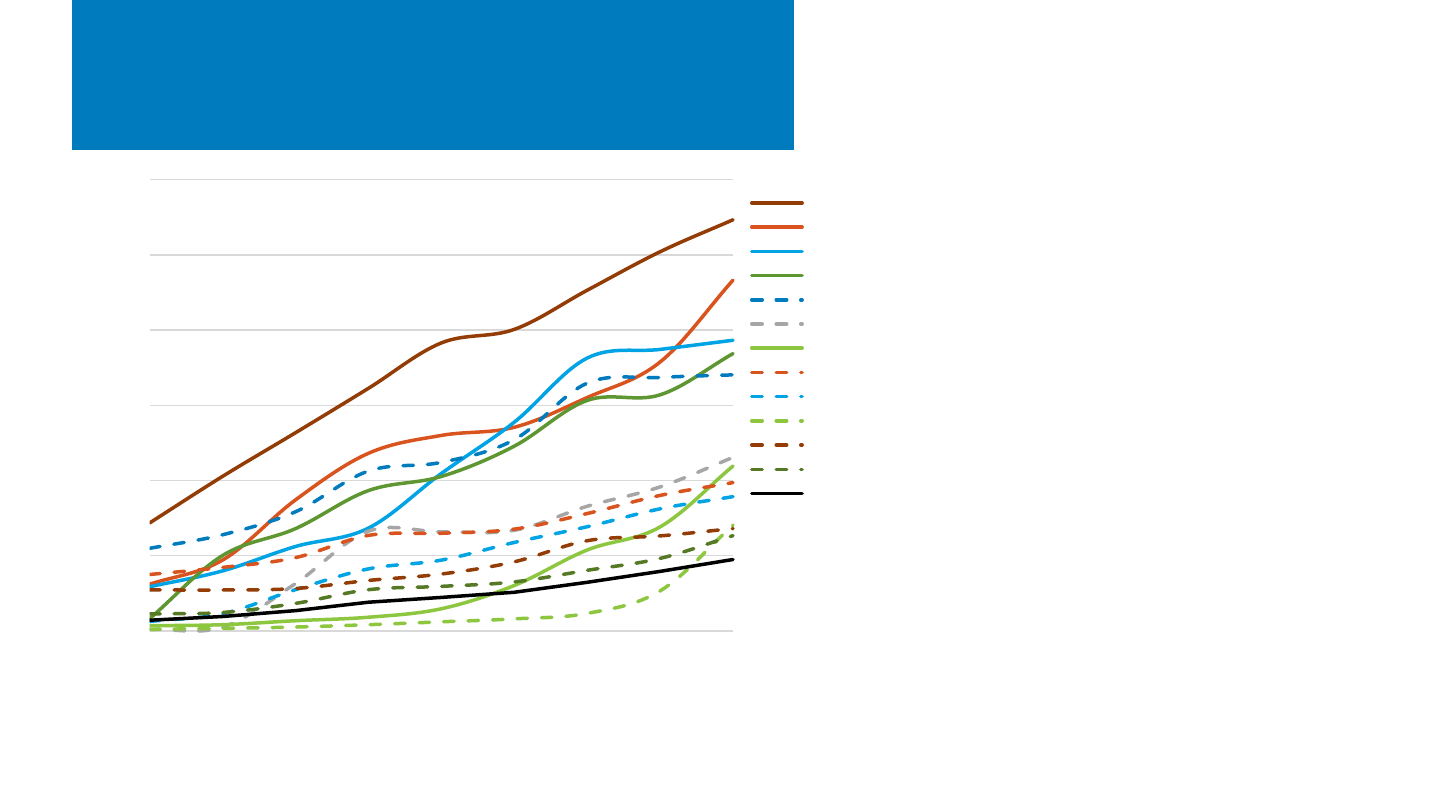
Solar Generation as a Percentage
of Total Generation, 2014–2022
• From 2014 to 2022, leading solar deployment
states greatly increased solar electricity
penetration.
– Rhode Island and Maine (light green) in
particular have seen substantial growth since
2019.
• In the past 5 years, five states (solid lines) shifted
over 9% of their electricity generation to solar
sources.
– Some of the increase in Massachusetts's percentage is
due to significant reduction in total electricity
production within the state.
• The United States, as a whole, has a much lower
level, but it has still increased generation by
573% since 2014.
Note: EIA monthly data for 2022 are not final. Additionally, smaller utilities report information to EIA on a yearly
basis, and therefore a certain amount of solar data has not yet been reported. “Net Generation” includes DPV
generation. Net generation does not include imports and exports to and from each state, and therefore the
percentage of solar consumed in each state may vary from its percentage of net generation.
Source: U.S. Energy Information Administration (EIA), “Electricity Data Browser.” Accessed April 4, 2023.
0%
5%
10%
15%
20%
25%
30%
2014 2015 2016 2017 2018 2019 2020 2021 2022
Solar Generation as a Percentage of Total
Net Generation
CA
NV
MA
VT
HI
UT
RI
AZ
NC
ME
NJ
CO
U.S.
NREL | 38NREL | 38
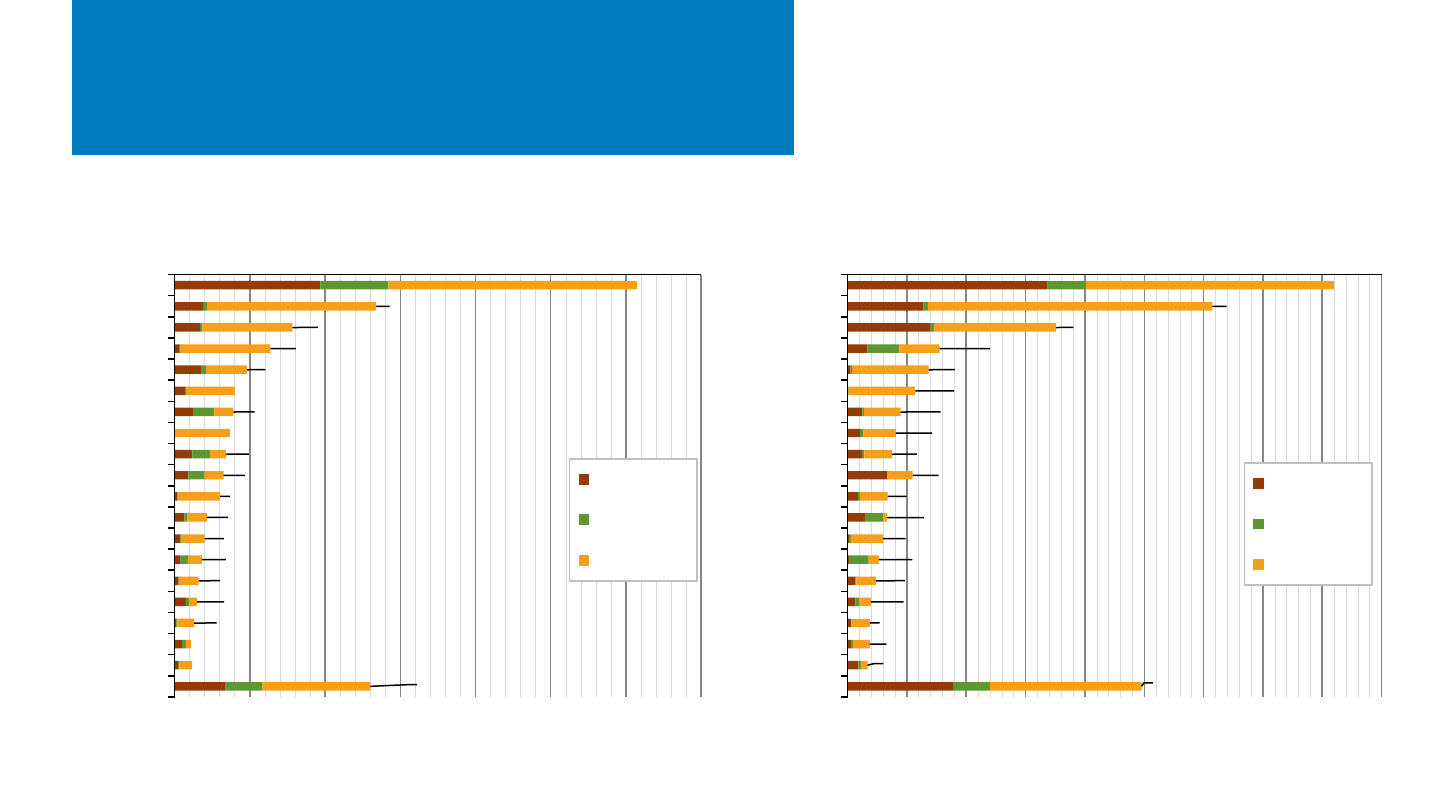
4,098
3,074
1,756
776
683
570
447
408
376
363
337
332
300
264
239
197
188
187
169
2,477
0 500 1,000 1,500 2,000 2,500 3,000 3,500 4,000 4,500
California
Texas
Florida
New York
Virginia
Georgia
Nevada
Illinois
Colorado
Arizona
North Carolina
New Jersey
Wisconsin
Maine
Washington
Maryland
Michigan
Iowa
Massachusetts
Other
PV Capacity Installed in 2022 (MWac)
Residential
C&I
Utility-scale
30,738
13,404
7,838
6,371
4,806
4,008
3,906
3,676
3,413
3,257
3,032
2,154
2,001
1,815
1,602
1,496
1,309
1,107
1,173
13,009
0 5,000 10,000 15,000 20,000 25,000 30,000 35,000
California
Texas
Florida
North Carolina
Arizona
Nevada
New York
Georgia
New Jersey
Massachusetts
Virginia
Colorado
Utah
Illinois
South Carolina
Maryland
Minnesota
Hawaii
New Mexico
Other
Cumulative PV Capacity Installed as of Dec 2022 (MWac)
Residential
C&I
Utility-scale
U.S. Installation Breakdown
by State
Note: EIA monthly data for 2022 are not final. Additionally, smaller utilities report information to EIA on a yearly basis, and therefore, a certain amount of solar data have not
yet been reported. “Net Generation” includes DPV generation. Arizona’s C&I installations in 2022 were net negative.
Sources: EIA, “Electric Power Monthly,” forms EIA-023, EIA-826, and EIA-861 (February 2023, February 2022).
At the end of 2022, there were 110.1 GWac of solar PV systems in the United States, of which 70.6 GWac were utility-scale
PV, 26.3 GWac were residential PV, and 13.2 GWac were C&I PV.
NREL | 39NREL | 39
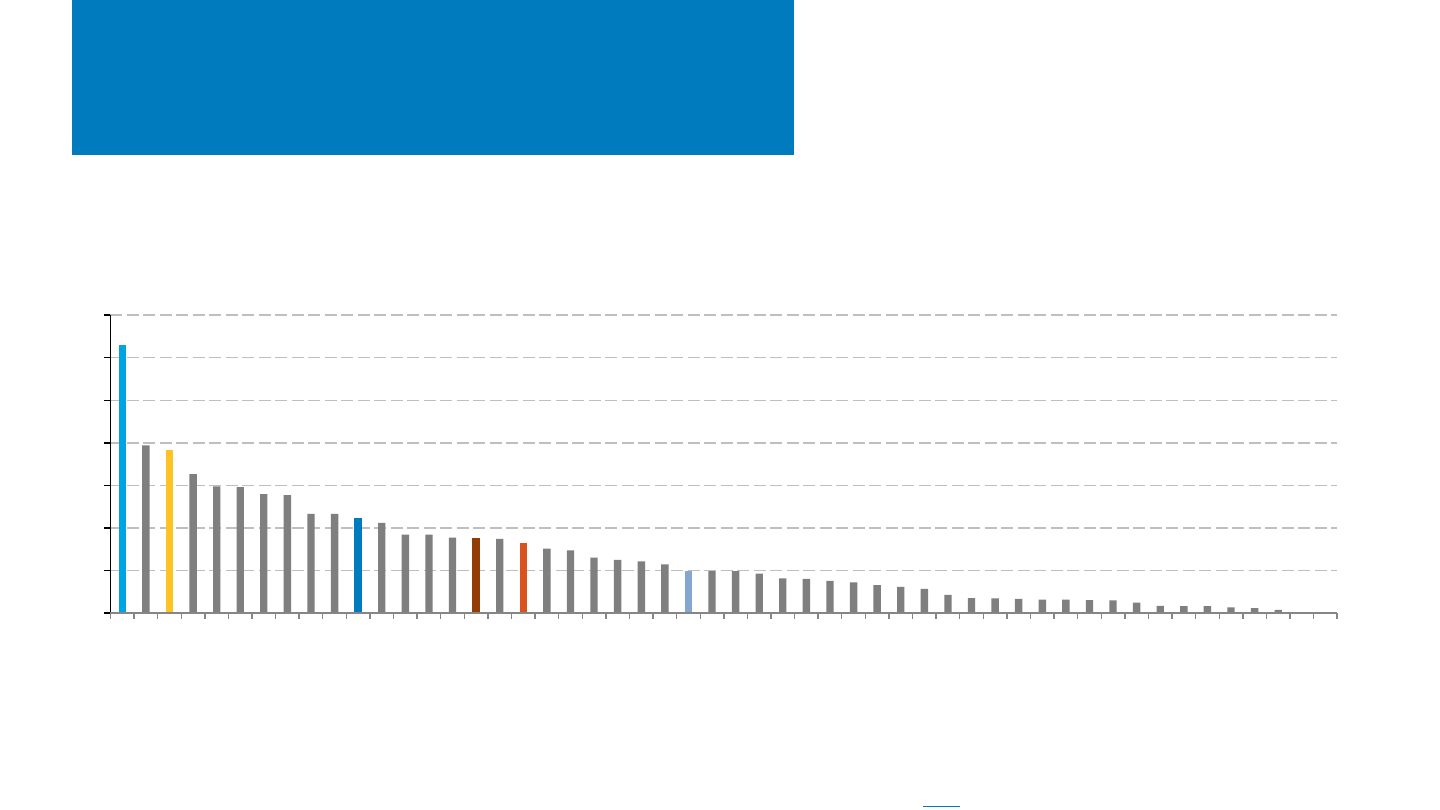
Cumulative U.S. PV Capacity Per
Capita (2022)
Note: EIA monthly data for 2022 are not final. Additionally, smaller utilities report information to EIA on a yearly basis, and therefore, a certain amount of solar data have not
yet been reported. “Net Generation” includes DPV generation. Virginia’s C&I installations in 2021 were net negative.
Sources: EIA, “Electric Power Monthly,” forms EIA-023, EIA-826, and EIA-861 (February 2023); United States Census Bureau (2023).
• Some large states that ranked high in total cumulative capacity at the end of 2022, such as Texas (#2), Florida (#3) and New
York (#7), are noticeably lower in rankings on a watts per capita basis. Texas drops to #11, Florida to #16, and New York to #25.
– Conversely, Nevada and Hawaii, which ranked 6
th
and 19
th
in cumulative PV capacity, jump to 1
st
and 3
rd
in terms of PV
watts per capita.
0
200
400
600
800
1,000
1,200
1,400
Nevada
California
Hawaii
Arizona
North Carolina
Utah
Rhode Island
New Mexico
Massachusetts
Vermont
Texas
Maine
Colorado
New Jersey
Georgia
Florida
Virginia
U.S.
South Carolina
Connecticut
Oregon
Idaho
Maryland
Minnesota
New York
DC
Delaware
Wyoming
Arkansas
Wisconsin
Iowa
Illinois
NH
Indiana
Mississippi
Alabama
Missouri
Michigan
Washington
Ohio
Louisiana
Pennsylvania
Tennessee
Montana
Kentucky
Nebraska
Kansas
Oklahoma
Alaska
West Virginia
South Dakota
North Dakota
Cumulative PV Capacity Per Capita
(Wac/person)
NREL | 40NREL | 40
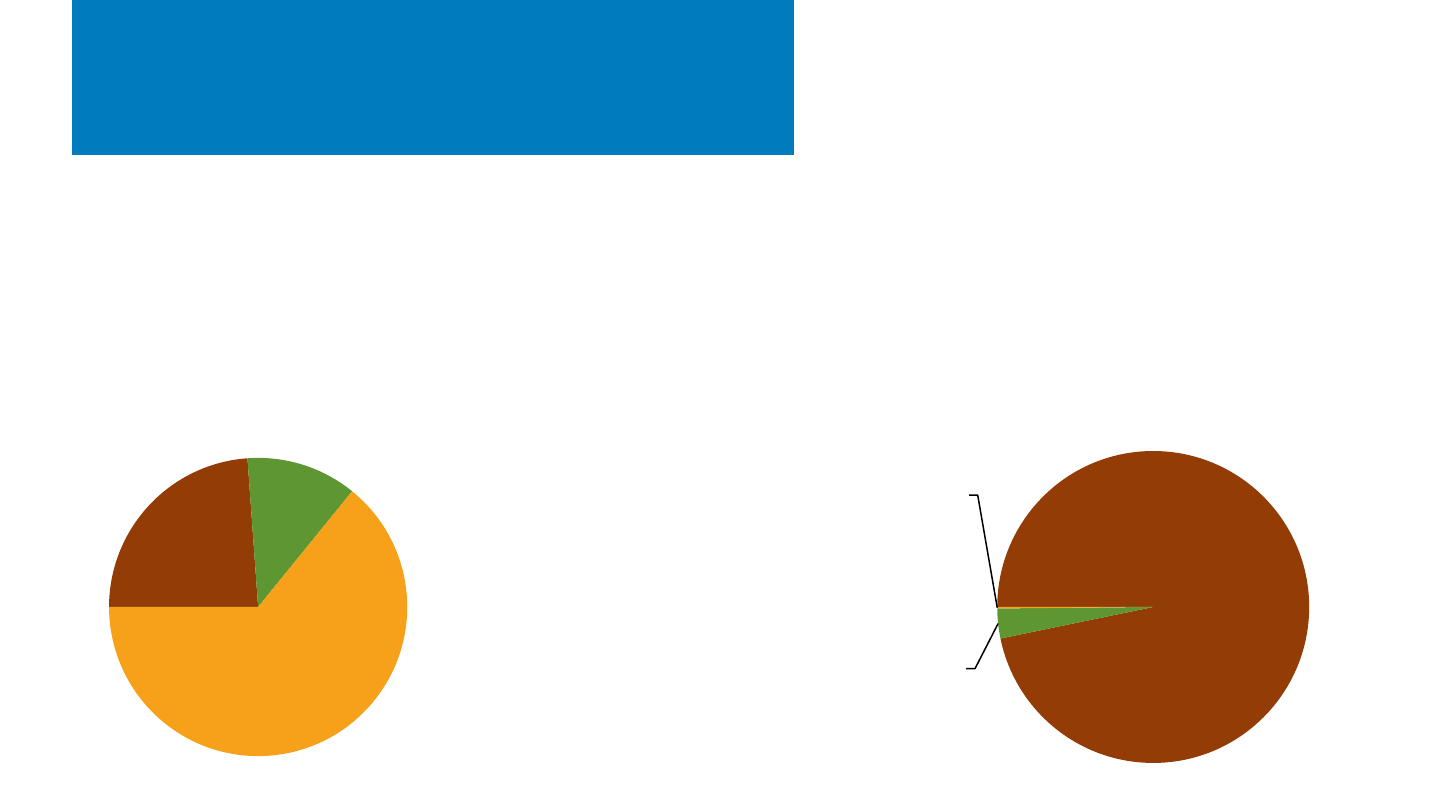
U.S. Installation Breakdown
Annual: EIA (GWac)
• At the end of 2022, there were 110.1 GWac of cumulative PV
installations.
• EIA reports that at the end of 2022, 64% of U.S. installed PV capacity
was from utility-scale PV systems.
• Despite representing only 24% of installed U.S. PV
capacity at the end of 2022, 97% of PV systems—over
3.6 million systems—were residential applications.
Note: EIA reports values in Wac which is standard for utilities. The solar industry has traditionally reported in Wdc. See the next slide for values reported in Wdc.
Sources: EIA, “Electric Power Monthly,” forms EIA-023, EIA-826, EIA-860, and EIA-861 (April 2023).
Residential
26.3
C&I
13.2
Utility-scale
70.6
Cumulative U.S. PV Installations as of
December 2022 (110.2 GWac)
Residential
3,647,828
C&I
116,546
Utility-scale
5,707
Cumulative U.S. PV Installations as of
December 2022 (3.8 million systems)
NREL | 41NREL | 41
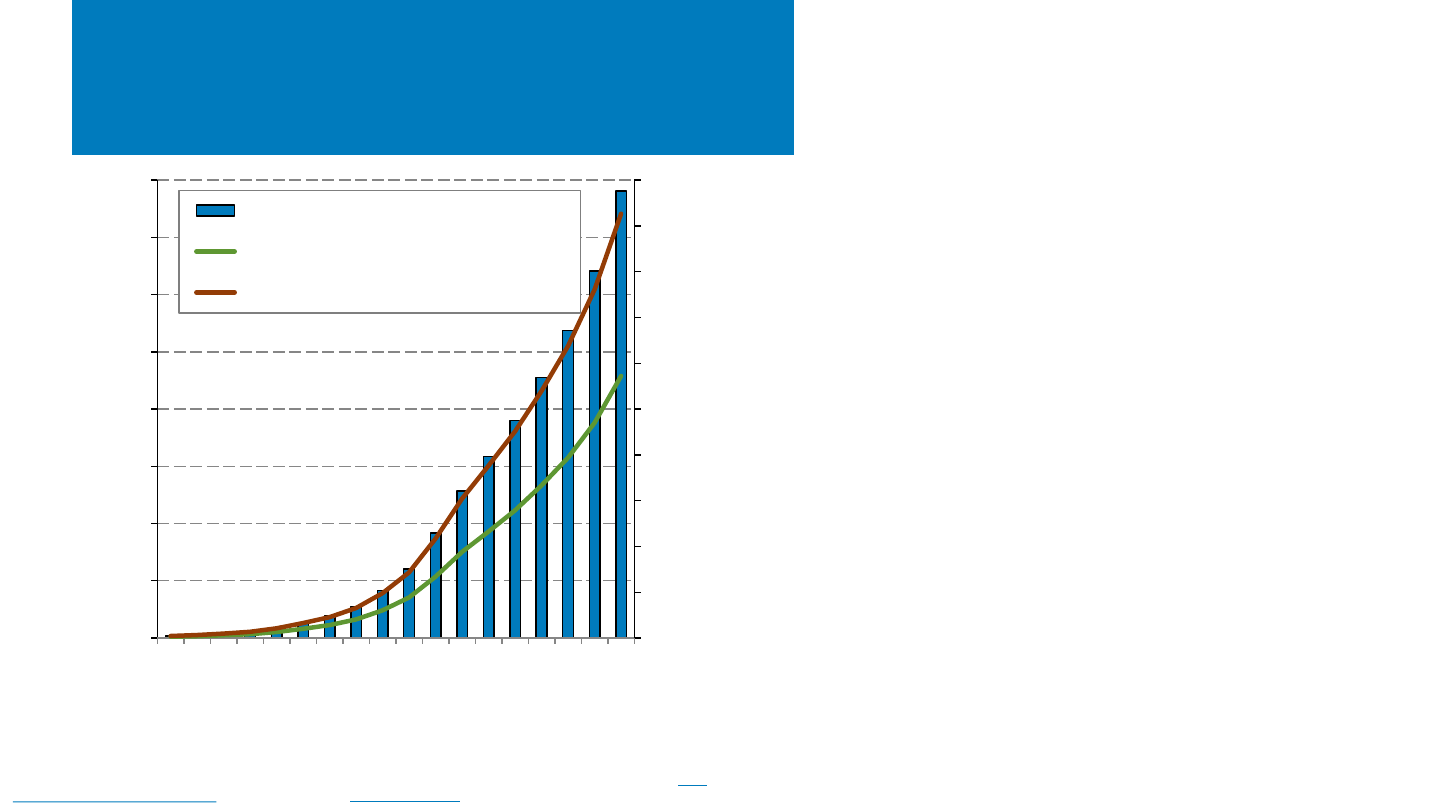
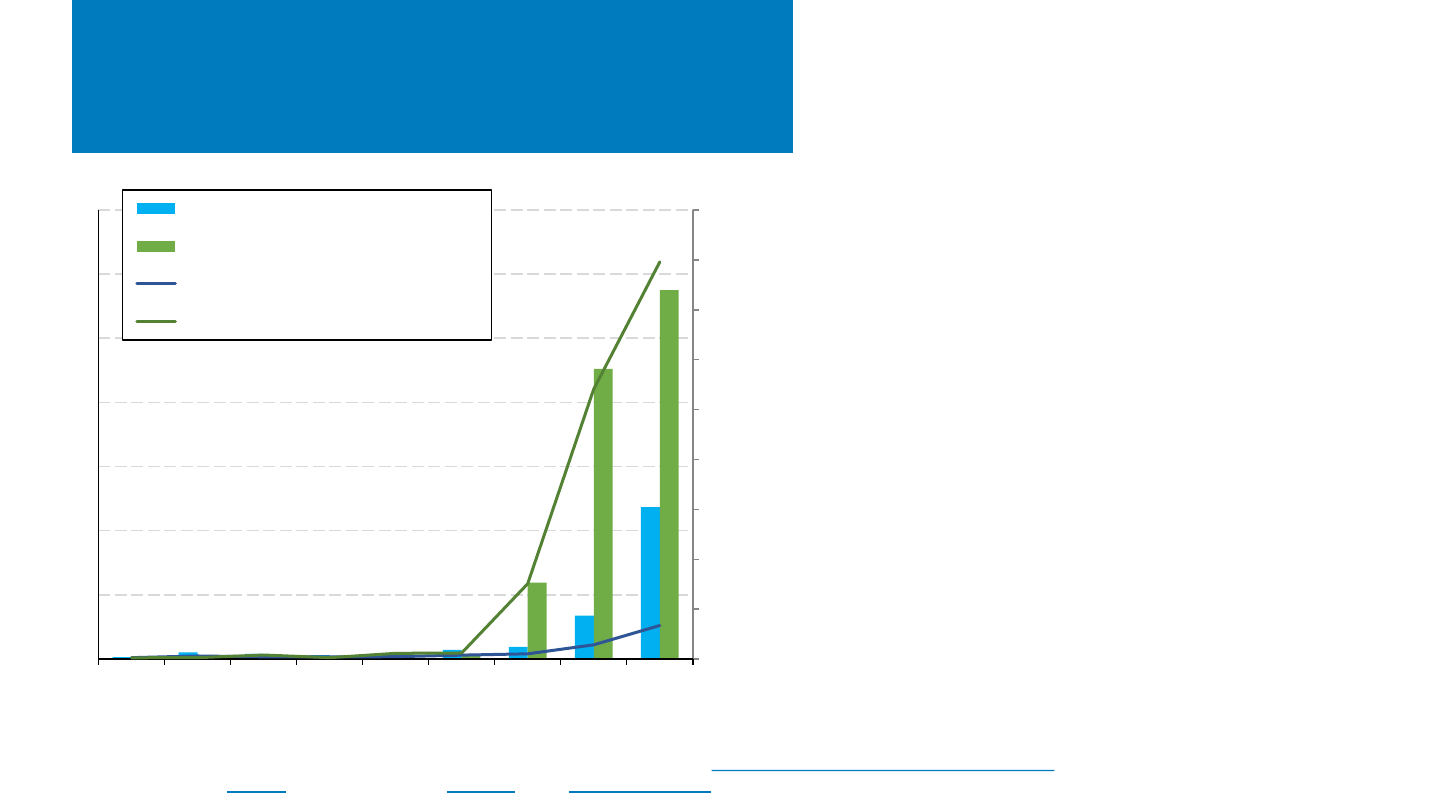
U.S. Residential PV Penetration
• Since 2005 when Congress passed the
investment tax credit, the number of annually
installed residential PV systems has grown by
approximately 37% per year, or over 200X.
• At the end of 2022, there were approximately
3.9 million residential PV systems in the United
States.
– Still, only 2.7% of households own or lease a
PV system (or 4.4% of households living in
single-family detached structures).
– However, solar penetration varies by
location. Hawaii, California, and Arizona
have residential systems on an estimated
33%, 20%, and 12% of households living in
single-family detached structures.
Sources: Res. PV Installations: 2000-2009, IREC 2010 Solar Market Trends Report; 2010-2022, SEIA/Wood Mackenzie Solar
Market Insight 2022 Year-in-Review; U.S. Households from U.S. Census Bureau.
0
400,000
800,000
1,200,000
1,600,000
2,000,000
2,400,000
2,800,000
3,200,000
3,600,000
4,000,000
0.0%
0.6%
1.2%
1.8%
2.4%
3.0%
3.6%
4.2%
4.8%
2005
2006
2007
2008
2009
2010
2011
2012
2013
2014
2015
2016
2017
2018
2019
2020
2021
2022
Cum. # of Res. PV Systems
% of households with PV
Residential PV systems (right axis)
U.S. households (left axis)
Single-family detached houses (left axis)
NREL | 42NREL | 42
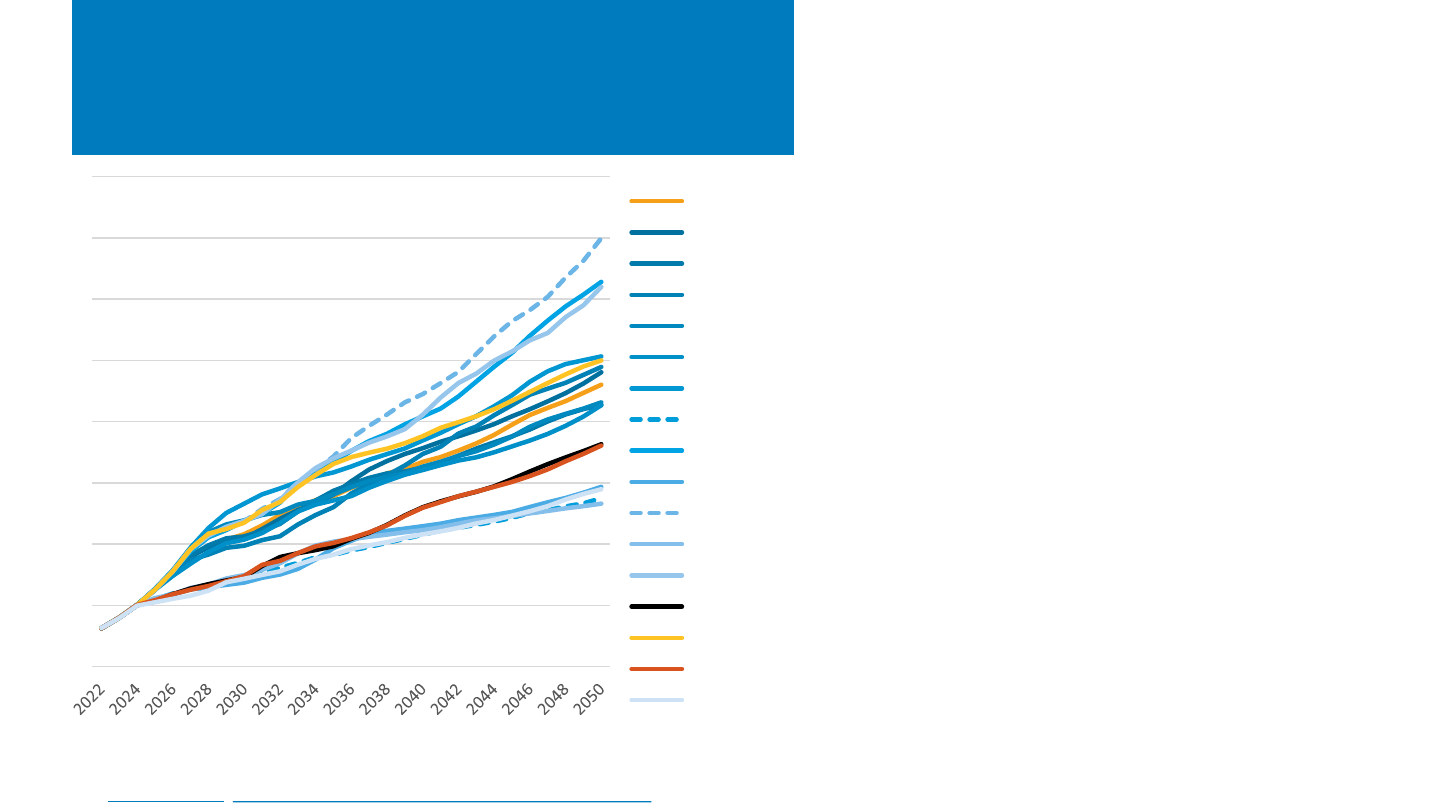
AEO2023 Projections
Note: “Other” includes coal, geothermal, landfill gas, biomass and petroleum.
Sources: EIA Today in Energy, Issues in Focus: Inflation Reduction Act Cases in AEO2023
EIA projects that total U.S. solar capacity
(including both UPV and DPV) could range from
0.5 TWac to 1.4 TWac by 2050, across the 16
scenarios investigated.
EIA estimates that IRA could result in as much as
270 GWac more capacity by 2050 than there
would be without the law.
• The High Uptake case, which assumes that
qualified projects receive the maximum
bonus tax credits, projects 660 GWac of solar
capacity by 2035, and 1 TWac by 2050.
• In the Reference case, the electric power
sector solar is assumed to take the
production tax credit and meet the labor
requirements, growing to 560 GWac of solar
capacity by 2035, and 920 GWac by 2050.
• Low Uptake case, which assumes most
qualified projects only receive the base tax
credit, projects only 400 GWac of solar
capacity in 2035, and 720 GWac by 2050.
– The SunShot Vision Study (released in
2012, projected 715 GWac of solar by
2050).
• No IRA case excludes energy-related IRA
provisions and trends nearly identically to
the Low Uptake case.
0
0.2
0.4
0.6
0.8
1
1.2
1.4
1.6
Solar Net Summer Capacity (TWac)
Reference case
High Economic Growth
Low Economic Growth
High Oil Price
Low Oil Price
High Oil and Gas Supply
Low Oil and Gas Supply
High Zero-Carbon Technology Cost
Low Zero-Carbon Technology Cost
High Macro and High Zero-Carbon Technology Cost
High Macro and Low Zero-Carbon Technology Cost
Low Macro and High Zero-Carbon Technology Cost
Low Macro and Low Zero-Carbon Technology Cost
No Inflation Reduction Act
High Uptake of Inflation Reduction Act
Low Uptake of Inflation Reduction Act
AEO2022 Reference case
NREL | 43NREL | 43
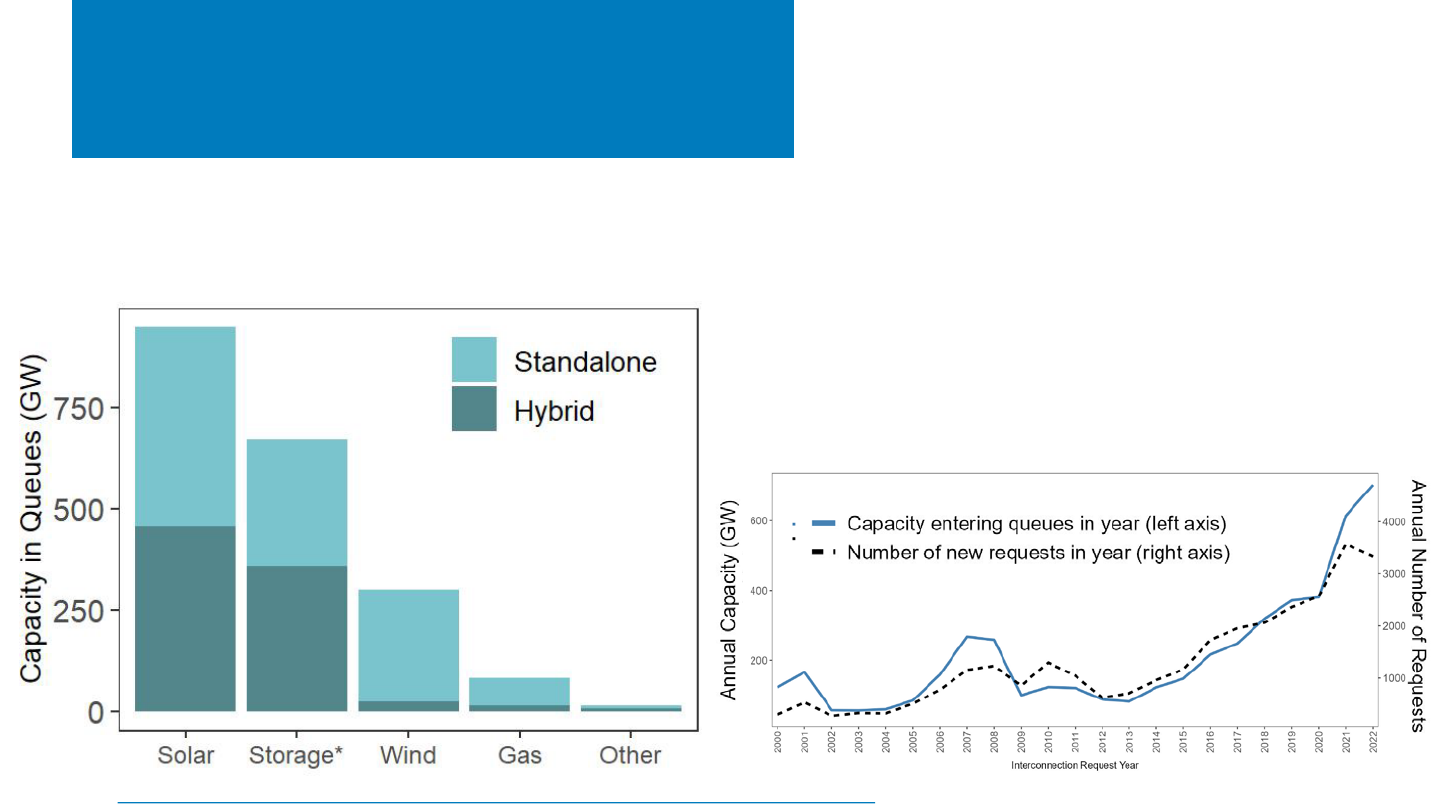
U.S. Transmission
Interconnection Queues
• Substantial solar and storage capacity have been proposed in most
regions of the United States.
– Over 10,000 projects representing 1.35 TWac of generator
capacity (1.26 TW of which is zero-carbon and 0.95 TW is solar)
and 0.7 TWac of storage are seeking interconnection.
• Annual interconnection requests have increased dramatically—in
terms of both number and capacity—since 2013; over 700 GWac was
added in 2022 alone. Hybrids represent a significant portion of solar
capacity.
• Only 14% of proposed solar projects entering queues from 2000 to
2017 have reached commercial operations (compared to 21% for all
technologies).
• The average time spent in queues has increased over time. The typical
projects built in 2022 took 5 years from interconnection request to
commercial operation. This compares to 3 years in 2015 and less than
2 years in 2008.
Source: LBNL, Queued Up: Characteristics of Power Plants Seeking Transmission Interconnection as of the End of 2022.
Proposed Interconnections by Technology
Interconnection Requests by Year
NREL | 44NREL | 44
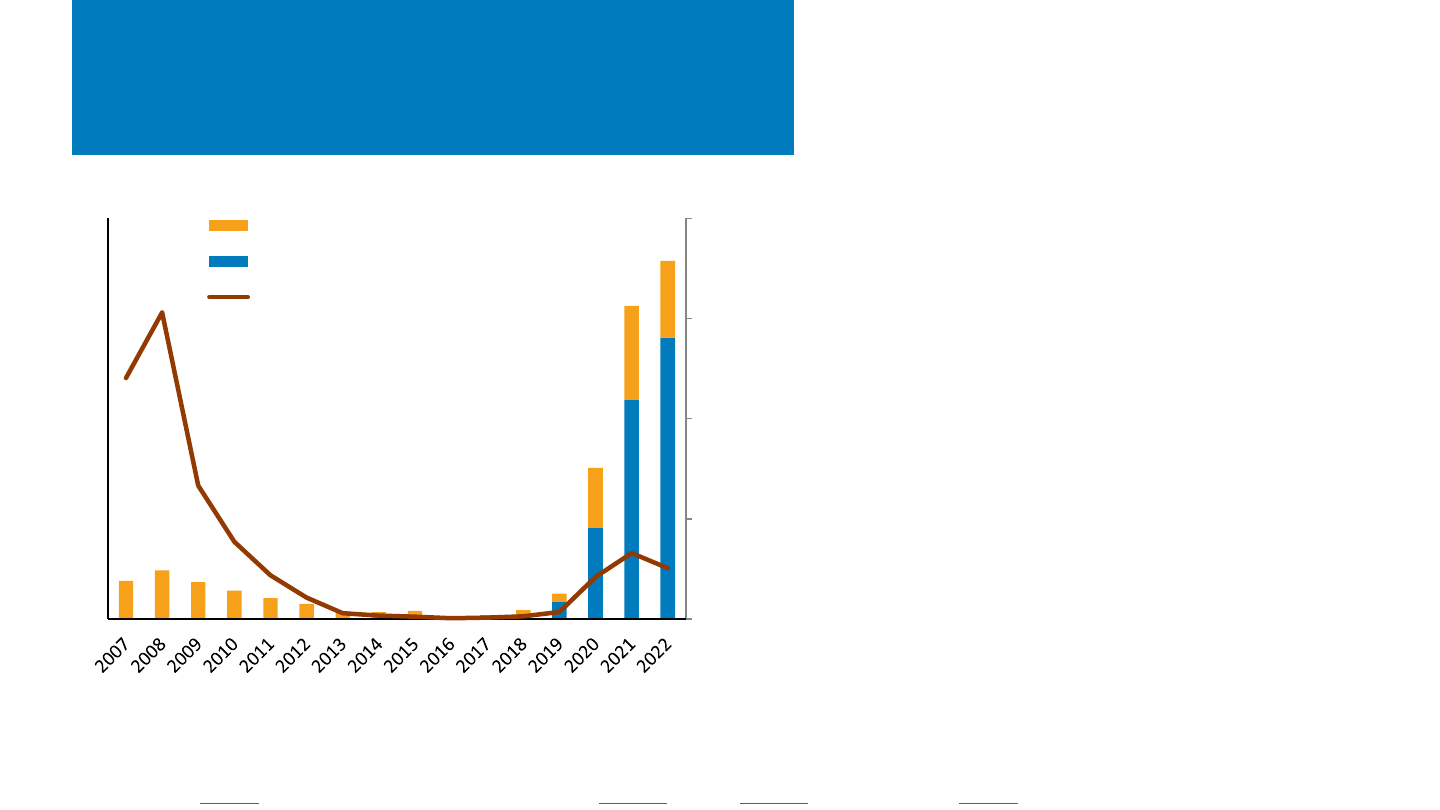
Residential Building-Integrated PV
Rebound in California
• In 2022, 8.9 MWdc of residential building-integrated
photovoltaics (BIPV) was installed in the territories
of California’s investor-owned utilities.
– After stagnating for more than a decade, residential BIPV
averaged 140% growth in annual installations from 2020
through 2022.
– During this period, 72% of the BIPV systems were
coupled with energy storage.
– Tesla installed 98% of BIPV capacity in 2021 and 94% in
2022.
– GAF Energy—a spinoff of the major roofing
manufacturer—began offering solar shingles in 2022 and
captured 3% of the year’s BIPV market share.
• Despite the recent growth, BIPV made up only
0.5%–0.7% of total residential PV installed in the
California IOU territories in 2021 and 2022.
• About 3,000 Tesla BIPV “Solar Roofs” (~30 MWdc)
have been installed nationwide since launching in
2016, constituting around 0.2% of the national
residential PV market in 2021 and 2022.
Note: BIPV, as defined by the California Energy Commission’s PV Module List, includes modules that are not rack mounted. The residential data
described on this slide include standalone PV and PV-plus-storage systems installed in the territories of Pacific Gas & Electric (PG&E), Southern
California Edison (SCE), and San Diego Gas & Electric (SDG&E).
Sources: Canary Media (3/30/23); CA NEM database (1/31/23); Fast Company (05/03/22); Forbes (04/19/21); Wood Mackenzie (3/30/23).
0%
1%
2%
3%
4%
0
1
2
3
4
5
6
7
8
9
10
Percent of resi. installs in PG&E, SCE, SDG&E (line)
Resi. installs in PG&E, SCE, SDG&E (bars, MWdc)
Standalone BIPV
BIPV+storage
BIPV market share
NREL | 45NREL | 45
Bifacial Increase in California
Distributed PV Installations
• In 2022, 81 MWdc of bifacial modules was installed
in the California IOU territories—56% more than in
2021.
– 24 MWdc (1.3%) of residential capacity was
bifacial.
– 58 MWdc (15.9%) of nonresidential capacity
was bifacial.
• Ground-mount and flat-roof nonresidential PV
installations can provide bifacial energy gain, but
typical sloped residential rooftop installations do
not provide bifacial gain.
• Installers may use bifacial modules to avoid tariff-
related module costs: bifacial modules were
exempted from Section 201 tariffs starting in June
2019.
• California’s distributed generation data do not
include utility-scale PV projects, which are the
primary application for bifacial modules.
Note: Bifacial modules are defined as having the term “bifacial” in the description field in the California Energy Commission’s PV Module List.
Source: CA NEM database (1/31/23); Solar Power World (11/16/21); DOE, Solar Futures Study
0%
2%
4%
6%
8%
10%
12%
14%
16%
18%
0
10
20
30
40
50
60
70
2014 2015 2016 2017 2018 2019 2020 2021 2022
Percent of Market
Installations (MWdc)
Bifacial residential
Bifacial non-residential
Bifacial market share residential
Bifacial market share non-residential
NREL | 46NREL | 46
Bifacial Prevalence in New York’s
Community Solar
• New York’s dataset reported a larger share of
bifacial modules in 2022 than California’s NEM
database.
– 4 MWdc (3.8%) of NY residential was bifacial.
– 347 MWdc (54.8%) of NY nonresidential was
bifacial.
• Differences between state datasets include project
sizes and prevalence of community solar.
– For all nonresidential capacity in 2022, the
median was 39 kWdc in CA vs. 162 kWdc in NY,
and the mean was 132 in CA vs. 1,431 in NY.
– Community solar accounted for 87% of NY non-
residential capacity in 2022 vs. 1% in CA.
– 60% of NY community solar capacity (median
project 420 kWdc) was bifacial in 2022 vs. 20%
of other non-residential capacity (median
project 39 kWdc).
– The bifacial share varied by system size in CA,
but less dramatically than in NY; for example,
the share for systems ≥ 400 kWdc was 17% vs.
6% for systems < 40 kWdc.
Note: Bifacial modules are defined as having the term “bifacial” in the description field in the California Energy Commission’s PV Module List. New
York data are for projects supported by the New York State Energy Research and Development Authority (NYSERDA).
Source: CA NEM database (1/31/23); Solar Electric Programs Reported by NYSERDA (3/3/23); Wood Mackenzie & SEIA, US Solar Market Insight: 2022
Year in Review (3/23).
0%
10%
20%
30%
40%
50%
60%
70%
0
100
200
300
400
500
600
700
2014 2015 2016 2017 2018 2019 2020 2021 2022
Bifacial Share
Installations (MWdc)
Total non-community solar (nonresidential)
Total community solar (nonresidential)
Bifacial share of community solar
Bifacial share of non-community solar
NREL | 47NREL | 47
U.S. Energy Storage Installations
by Market Segment (Energy Storage
Association)
California and Texas represented 85% of installed capacity in
2022, though the islands of Puerto Rico and Hawaii came in 3
rd
and 5
th
, respectively, installing around 300 MW of storage each.
– 12 states installed more than 40 MWh of storage in 2022.
The United States installed approximately 14.1 GWh (4.8 GW
ac
) of energy storage
onto the electric grid in 2022, +34% (+30%) y/y as a result of high levels of
residential deployment and grid-scale deployment.
– Grid-scale and residential storage installations were up 29% (34%) and 50% (44%) in
2022 y/y respectively.
– The increase came despite a 40% (34%) reduction deployment in Q4 2022, y/y.
California
71%
Texas
14%
PR 2%
NV 2%
HI 2%
MA 1%
NY 1%
Other
7%
2022 U.S. Energy Storage Installations by Region
(14.1 GWh)
0
2,000
4,000
6,000
8,000
10,000
12,000
14,000
16,000
2017 2018 2019 2020 2021 2022
Energy Storage Installed (MWh)
U.S. Energy Storage Installations by Market Segment
Grid-Scale (MWh)
CCI (MWh)
Residential (MWh)
0
1,000
2,000
3,000
4,000
5,000
6,000
Energy Storage Installed (MW)
Grid-Scale (MW)
CCI (MW)
Residential (MW)
Note: Front-of-the-meter refers to all projects deployed on the utility side of the meter, regardless of size or ownership. CCI
refers to Community-scale, commercial and industrial.
Source: Wood Mackenzie Power & Renewables and Energy Storage Association, U.S. Energy Storage Monitor: Q4 2022.
NREL | 48NREL | 48
U.S. Energy Storage Installations
by Market Segment (EIA)
California represented 59% of installed battery storage capacity,
followed by Texas (30%).
– The top five markets represented 93% of installed energy storage
capacity.
The United States installed approximately 4.5 GW
ac
of energy storage onto the
electric grid in 2022— up 22% y/y as a result of high levels of utility-scale and C&I
deployment.
– EIA reported a 16% reduction in residential storage installations.
Note: EIA reports no storage from Puerto Rico.
Sources: EIA Form 860M.
348
347
713
3,702
4,510
0
500
1,000
1,500
2,000
2,500
3,000
3,500
4,000
4,500
5,000
2018 2019 2020 2021 2022
Energy Storage Installed (MW)
U.S. Energy Storage Installations by Market Segment
Residential
C&I
Utility-scale
California,
2671
Texas, 1333
Nevada, 81
Massachusetts,
52
Hawaii, 64
Other, 309
2022 U.S. Energy Storage Installations by Region (4.5
GW)

NREL | 49
Agenda
Global Solar Deployment1
U.S. PV Deployment
2
PV System Pricing
3
Global Manufacturing
4
Component Pricing
5
Market Activity
6
7 U.S. PV Imports
• In a select data set of utility-scale PV systems owned by 25
regulated utilities for 202 projects totaling 9.6 GWac installed
from 2010 to 2022, the median system price in 2022 was
$1.49/Wac—up 13% y/y.
• The median reported price by EnergySage for residential PV
systems increased 6.3% y/y to $2.85/Wdc – the third straight
period of increase, after never having done so before.
• From H1 2022 to early 2023, the median reported distributed
PV system price across Arizona, California, Massachusetts,
and New York:
– Increased 5% to $4.40/Wdc for systems 2.5 to 10 kW
– Increased 9% to $3.92/Wdc for systems 10 to 100 kW
– Increased 4% to $2.59/Wdc for systems 100 to 500 kW
– Increased 13% to $2.08/Wdc for systems 500 kW to 5 MW.
NREL | 50NREL | 50
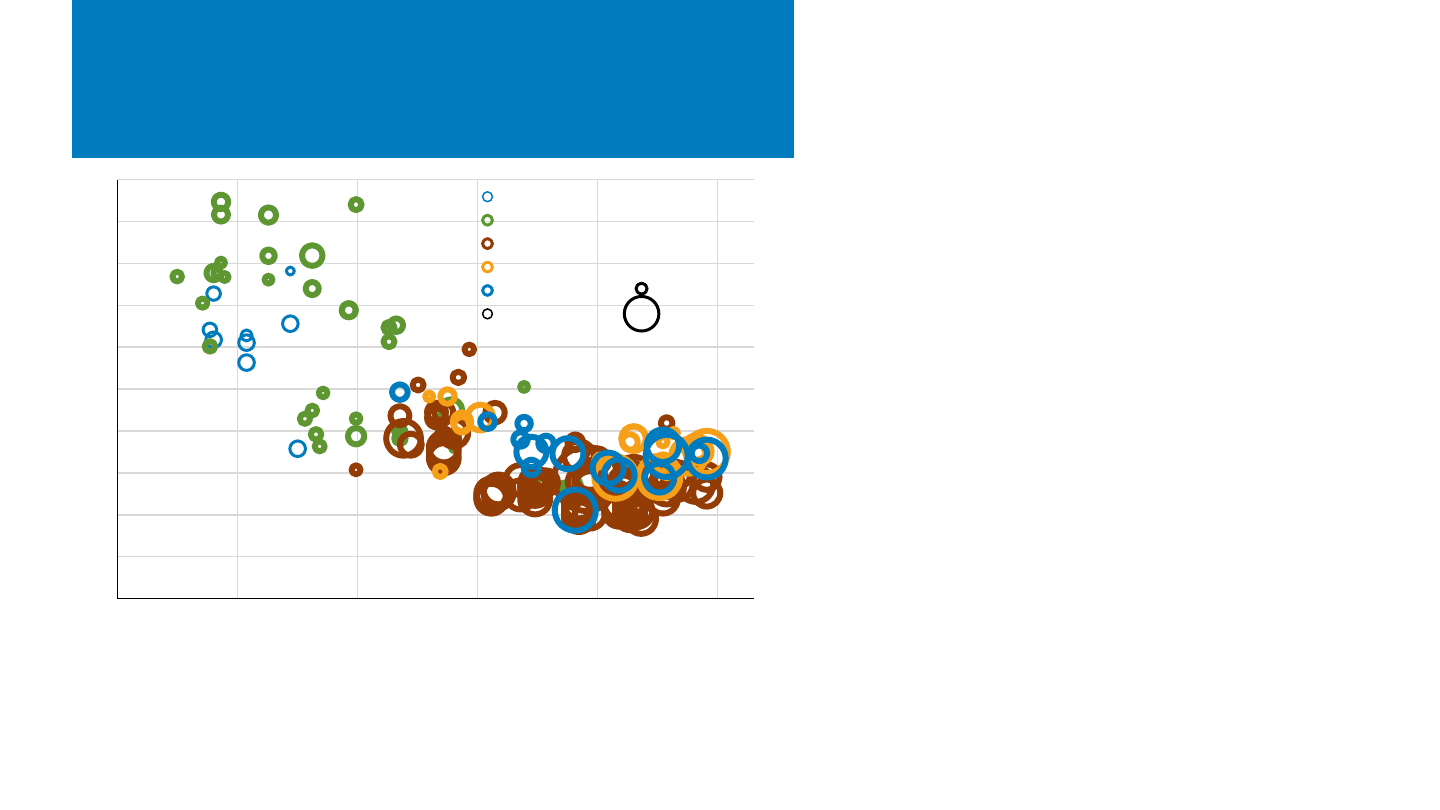
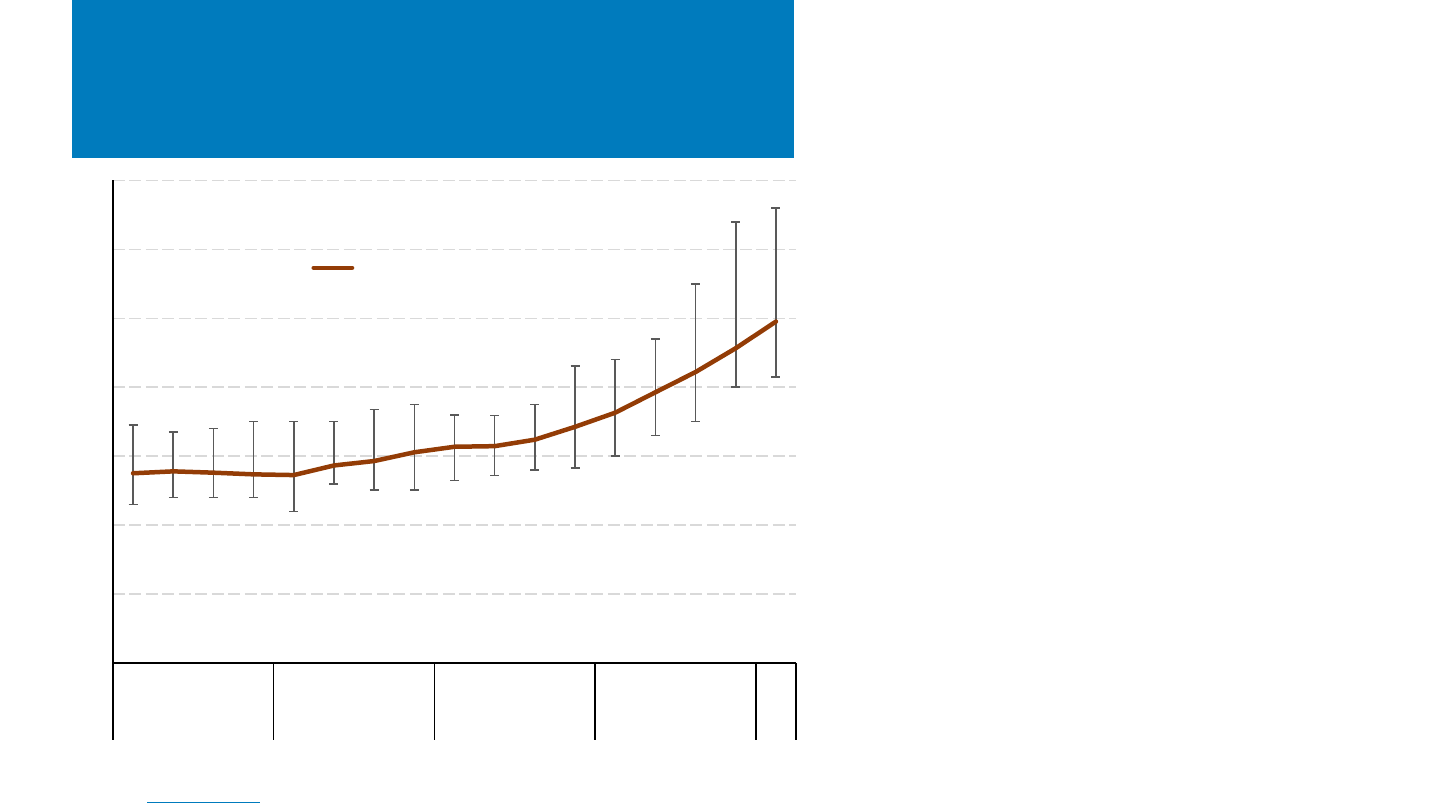
Utility-Owned PV Pricing (>5 MW)
Sources: FERC Form 1 filings from the from the following utilities: Alabama Power, Allete, Arizona Public Service, Avangrid, Dominion, DTE, Duke
Energy, El Paso Electric, Entergy, Florida Power and Light, Georgia Power, Indiana Michigan Power, Kentucky Utilities, MidAmerican, Nevada
Power, Pacific Gas and Electric, Public Service of New Mexico, Southern California Edison, Tampa Electric, Tucson Electric, United Illuminating,
Union Electric, UNS Electric, Virginia Electric, and Wisconsin Public Service.
In a select data set of utility-scale PV systems owned
by 25 regulated utilities for 202 projects totaling 9.6
GWac installed from 2010 to 2022, the median
system price in 2022 was $1.49/Wac—up 13% y/y.
– The lowest and highest reported prices in 2022 were
$1.06/Wac and $2.10/Wac, respectively.
– Still, from 2010 through 2022, system prices fell 11%
per year.
$0
$1
$2
$3
$4
$5
$6
$7
$8
$9
$10
2009 2010 2011 2012 2013 2014 2015 2016 2017 2018 2019 2020 2021 2022
Installed Cost ($/ac)
Project Completion Year
Median (AC)
Capacity-weighted Average (AC)
Individual Projects (AC)
Median (DC)
Capacity-weighted Average (DC)
Individual Projects (DC)
NREL | 51NREL | 51
$0.0
$0.5
$1.0
$1.5
$2.0
$2.5
$3.0
$3.5
$4.0
$4.5
$5.0
Jul-09 Apr-12 Dec-14 Sep-17 Jun-20 Mar-23
Installed Cost ($/Wac)
Project Completion Year
California
Southwest
Southeast
Midwest
Mid-Atlantic
Sizing
Utility-Owned PV Pricing (>5 MW)
Sources: FERC Form 1 filings from the from the following utilities: Alabama Power, Allete, Arizona Public Service,
Avangrid, DTE, Duke Energy, El Paso Electric, Florida Power and Light, Georgia Power, Indiana Michigan Power,
Kentucky Utilities, Nevada Power, Pacific Gas and Electric, Public Service of New Mexico, Southern California
Edison, Tampa Electric, Tucson Electric, United Illuminating, UNS Electric, and Virginia Electric.
• While geographic considerations (as well as
size) impact cost per watt, system prices have
been relatively in-line across several different
regions but generally lower in the Southeast
.
– The data sample had a capacity-weighted
average price of $1.48/Wac in 2022.
– The capacity-weighted average price in the
Southeast was $1.28/Wac compared to
$1.74/Wac in the Midwest and Mid-Atlantic.
– Utility-owned projects still represent a
minority of all PV systems installed in the
United States, and prices may differ from IPP-
owned projects.
10 MW
100 MW
NREL | 52NREL | 52
U.S. Solar PPA Pricing (LevelTen)
Source: LevelTen, PPA Price Index.
• U.S. Solar PPA prices increased between 2020
and 2023, with the 25
th
percentile offered
price in Q1 2023 on LevelTen’s bidding
platform 82% higher than it was in Q1 2020.
– Offered wind PPA’s increased 113% over the
same period.
• LevelTen attributed the increase in pricing to
rising supply chain costs, capital costs (e.g., rising
interest rates), regulatory uncertainty, and
logistical complexity (e.g., meeting UFLPA, and
managing anti-circumvention case on U.S. import
of Southeast Asian cell and modules).
$0
$10
$20
$30
$40
$50
$60
$70
Q1 Q2 Q3 Q4 Q1 Q2 Q3 Q4 Q1 Q2 Q3 Q4 Q1 Q2 Q3 Q4 Q1
2019 2020 2021 2022 2023
25th Percentile PPA Offer Price ($/MWh)
National average across
markets
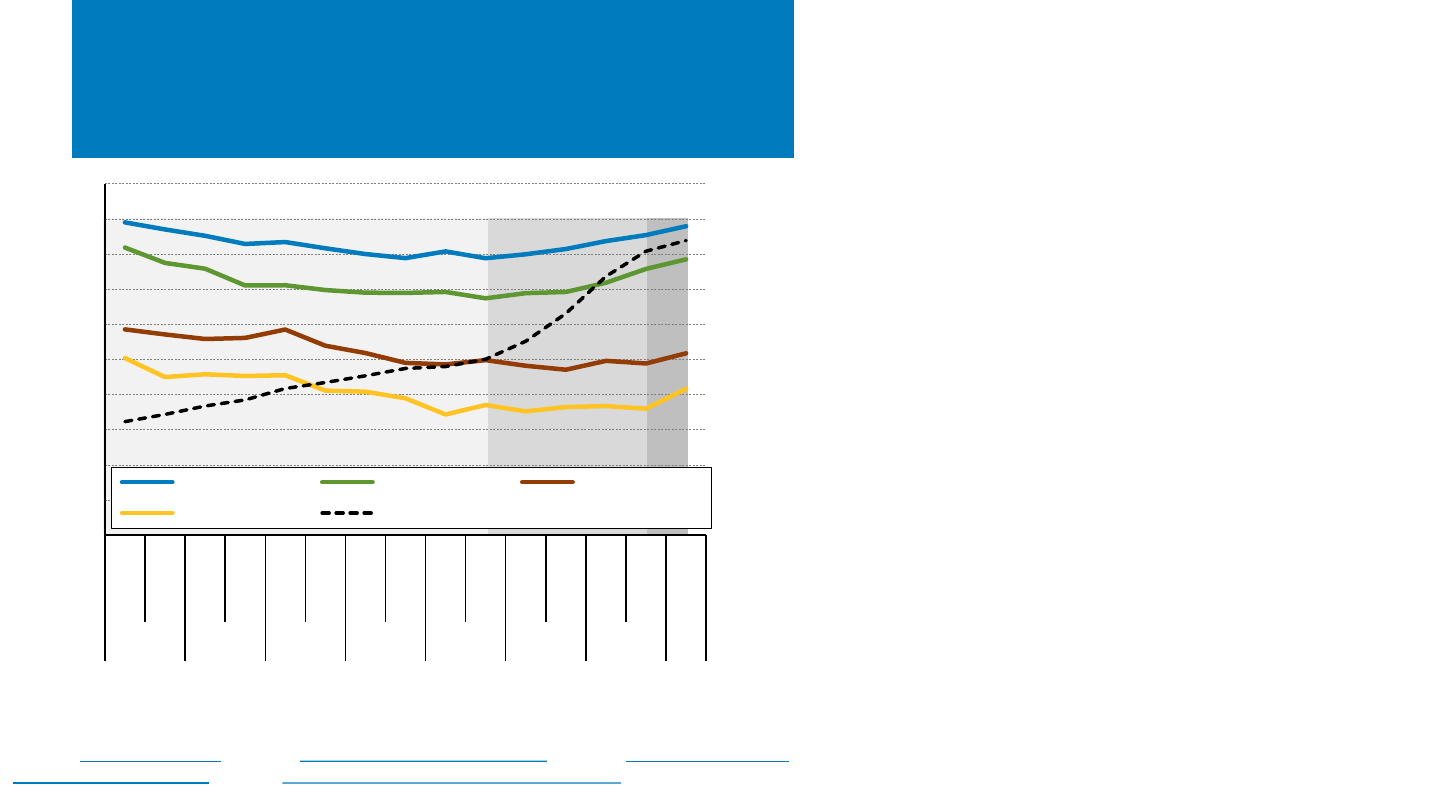
NREL | 53NREL | 53
Distributed PV System Pricing From
Select States
• From H1 2022 to early 2023, the median reported
distributed PV system price across Arizona,
California, Massachusetts, and New York:
– Increased 5% to $4.40/Wdc for systems 2.5 to 10 kW
– Increased 9% to $3.92/Wdc for systems 10 to 100 kW
– Increased 4% to $2.59/Wdc for systems 100 to 500 kW
– Increased 13% to $2.08/Wdc for systems 500 kW to 5 MW.
• From 2016 through 2020, the CPI change averaged
+2% per year, while system price changes averaged
-2% to -6% per year.
• From 2020 through 2022:
– The CPI change averaged +6% per year.
– The price change for systems 2.5–100 kW averaged +3% to
+4% per year.
– The price change for systems 100 kW – 5 MW averaged -1%
to +1% per year.
• From H2 2022 through early 2023:
– The CPI changed +2%.
– The price for systems 2.5–100 kW changed +3% to +4%.
– The price for systems 100 kW – 5 MW changed +6% to
+16%.
2023 MW reported YTD: Arizona (64), California (224), Massachusetts (15), New York (118)
Note: System prices above $10/W and below $0.75/W were removed from the data set. There were not enough
reported prices for systems above 5 MW in the data set to show a trend over time.
Sources: Arizona Goes Solar (4/10/23); California Distributed Generation (2/28/23); Massachusetts Lists of
Qualified Generation Units (4/5/23); Solar Electric Programs Reported by NYSERDA (3/3/23).
200
220
240
260
280
300
320
$0.0
$0.5
$1.0
$1.5
$2.0
$2.5
$3.0
$3.5
$4.0
$4.5
$5.0
H1
H2
H1
H2
H1
H2
H1
H2
H1
H2
H1
H2
H1
H2
H1 (part)
2016 2017 2018 2019 2020 2021 2022 2023
CPI, all urban consumers (unadjusted)
System Price ($/Wdc)
2.5–10 kW 10–100 kW 100–500 kW
500 kW – 5 MW CPI
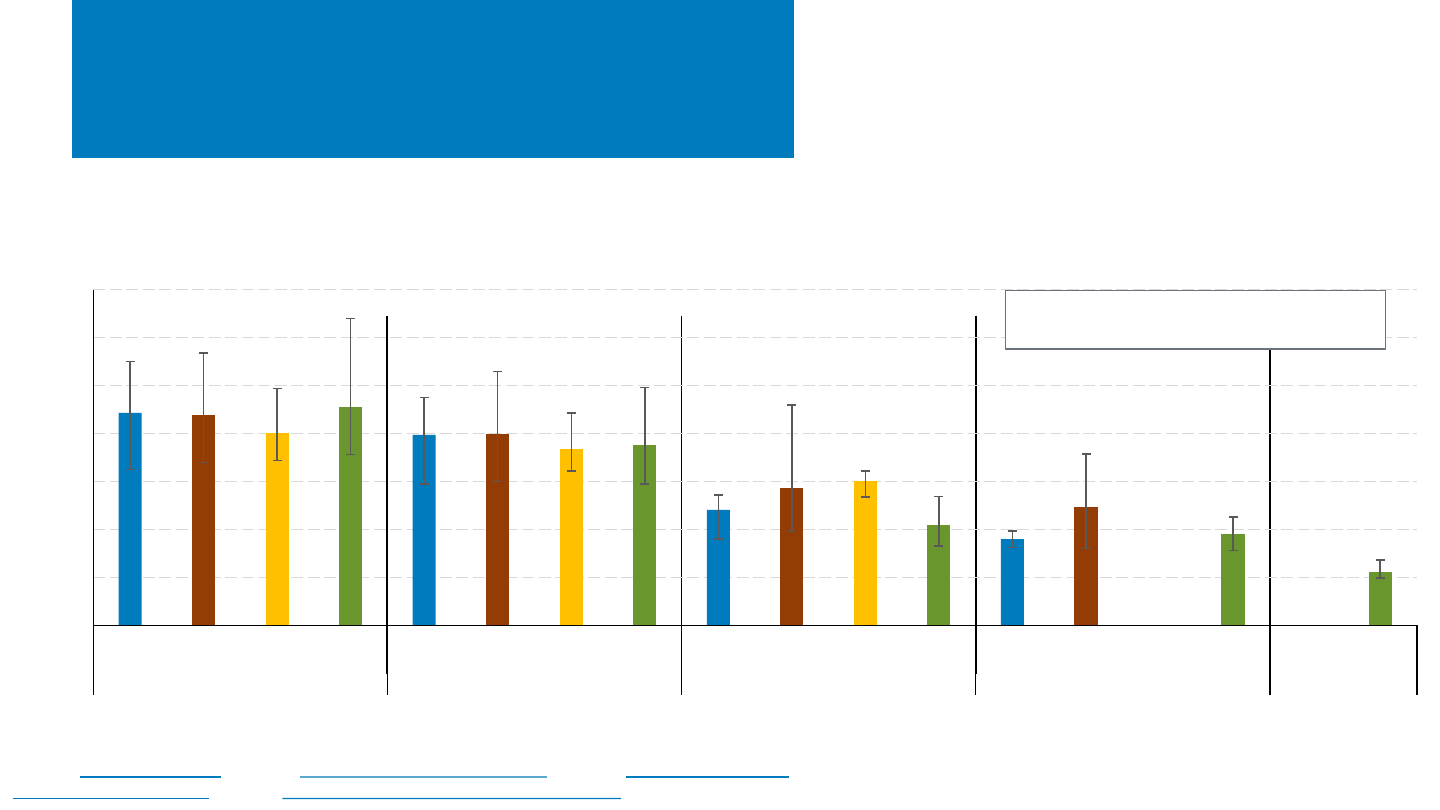
NREL | 54NREL | 54
Distributed System Pricing From
Select States, Early 2023
• For systems of less than 100 kW, price increases varied
between H1 2022 and early 2023:
– 2%–10% in Arizona, 5%–10% in California, 4%–5% in
Massachusetts, 13% in New York.
• California drove the overall trend toward higher large-
system prices from H1 2022 to early 2023, both installing
the most capacity and reporting the largest price
increases (13%–36%) for systems of 100 kW – 5 MW.
• In addition to price differences based on system size, there is variation
between states and within individual markets.
• Dollar-per-watt prices generally decrease as system size increases.
$0
$1
$2
$3
$4
$5
$6
$7
AZ CA MA NY AZ CA MA NY AZ CA MA NY AZ CA MA NY NY
2.5 kW–10 kW 10 kW–100 kW 100 kW–500 kW 500 kW–5 MW 5 MW+
System Price ($/Wdc)
Bars represent the median, with error bars
representing 80
th
and 20
th
percentiles.
2023 MW reported YTD: Arizona (64), California (224), Massachusetts (15), New York (118)
Note: System prices above $10/W and below $0.75/W were removed from the data set.
Sources: Arizona Goes Solar
(4/10/23); California Distributed Generation (2/28/23); Massachusetts Lists of
Qualified Generation Units (4/5/23); Solar Electric Programs Reported by NYSERDA (3/3/23).
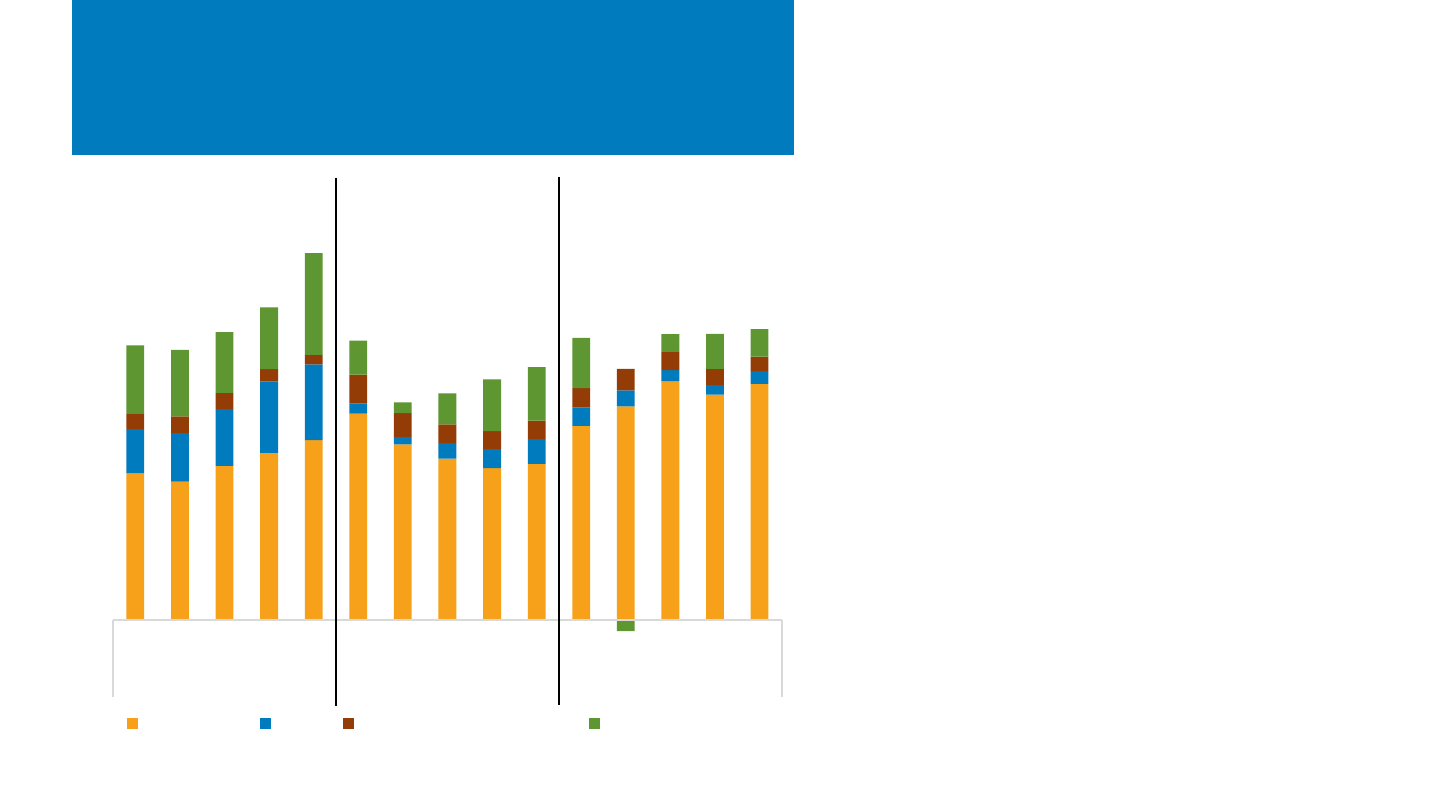
NREL | 55NREL | 55
-$1.0
$0.0
$1.0
$2.0
$3.0
$4.0
$5.0
$6.0
$7.0
2018 2019 2020 2021 2022 2018 2019 2020 2021 2022 2018 2019 2020 2021 2022
Sunrun SunPower Sunnova
Installed Cost ($/Wdc)
Installation Sales General & administrative Net value
Sunrun, SunPower, and Sunnova
Cost and Value, 2018–2022
Sources: Corporate filings.
• After falling in 2019, the prices of residential systems
installed by national integrators rose in each subsequent
year through 2022.
– Some of this rise is due to the inclusion of storage
into sold or leased PV systems.
• Net customer value showed an increasing trend for all
companies between 2019 and 2022.
• Increases in sales and installation costs also contributed
to price increases, with the contribution from each
category varying by company.
• General and administrative costs exhibited a decreasing
trend across companies.
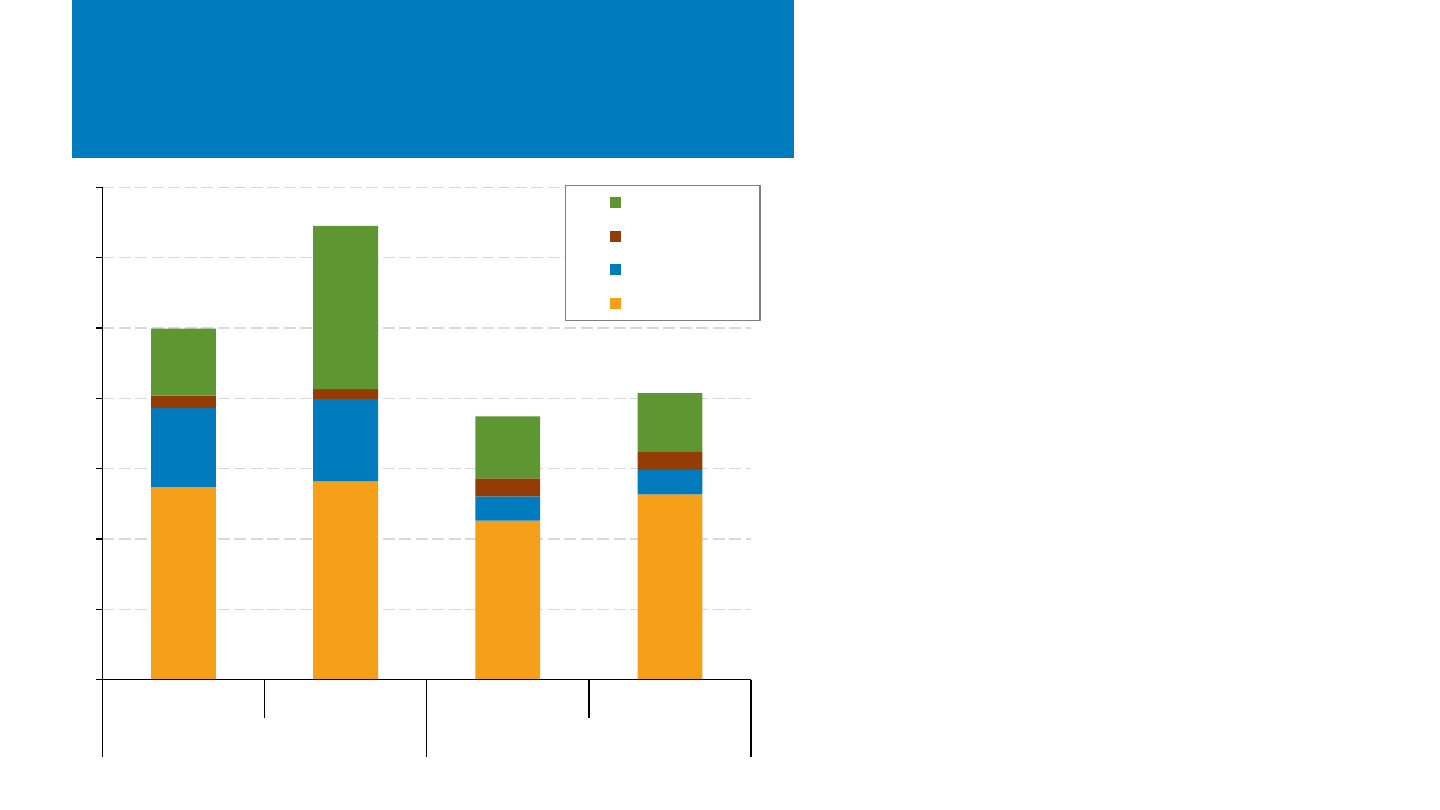
NREL | 56NREL | 56
Sunrun and SunPower
Cost and Value, Q4 2022
Sources: Corporate filings.
$2.74
$2.82
$2.26
$2.64
$1.12
$1.17
$0.34
$0.35
$0.18
$0.14
$0.26
$0.26
$0.95
$2.32
$0.88
$0.83
$0.0
$1.0
$2.0
$3.0
$4.0
$5.0
$6.0
$7.0
Q4 '21 Q4 '22 Q4 '21 Q4 '22
Sunrun SunPower
Installed Cost ($/Wdc)
Net Value
G&A
Sales
Installation
• Large residential installers reported continued strong
demand for PV in Q4 2022 along with rising prices.
– New customer additions increased 25%–81% in
Q4 2022 vs. Q4 2021 for Sunrun, Sunnova, and
SunPower, and large customer backlogs were
reported (e.g., 53,000 customers for SunPower).
– Installers credited the high cost of residential
utility service for boosting PV demand and
accommodating higher PV prices.
– California’s April 2023 net-metering change
drove demand, after which PV plus storage
systems are expected to gain in popularity.
– Other demand drivers include increased electric
vehicle purchases, creation of virtual power
plants, PV on new home construction, and
Inflation Reduction Act incentives.
• Prices include PV systems paired with batteries.
– Battery attachment rates were 17% for
SunPower and 22% for Sunnova in Q4 2022
– Sunrun’s rate was 15% for the entire year.
• Installers reported few equipment supply issues, in
contrast to a focus on these issues in recent quarters.
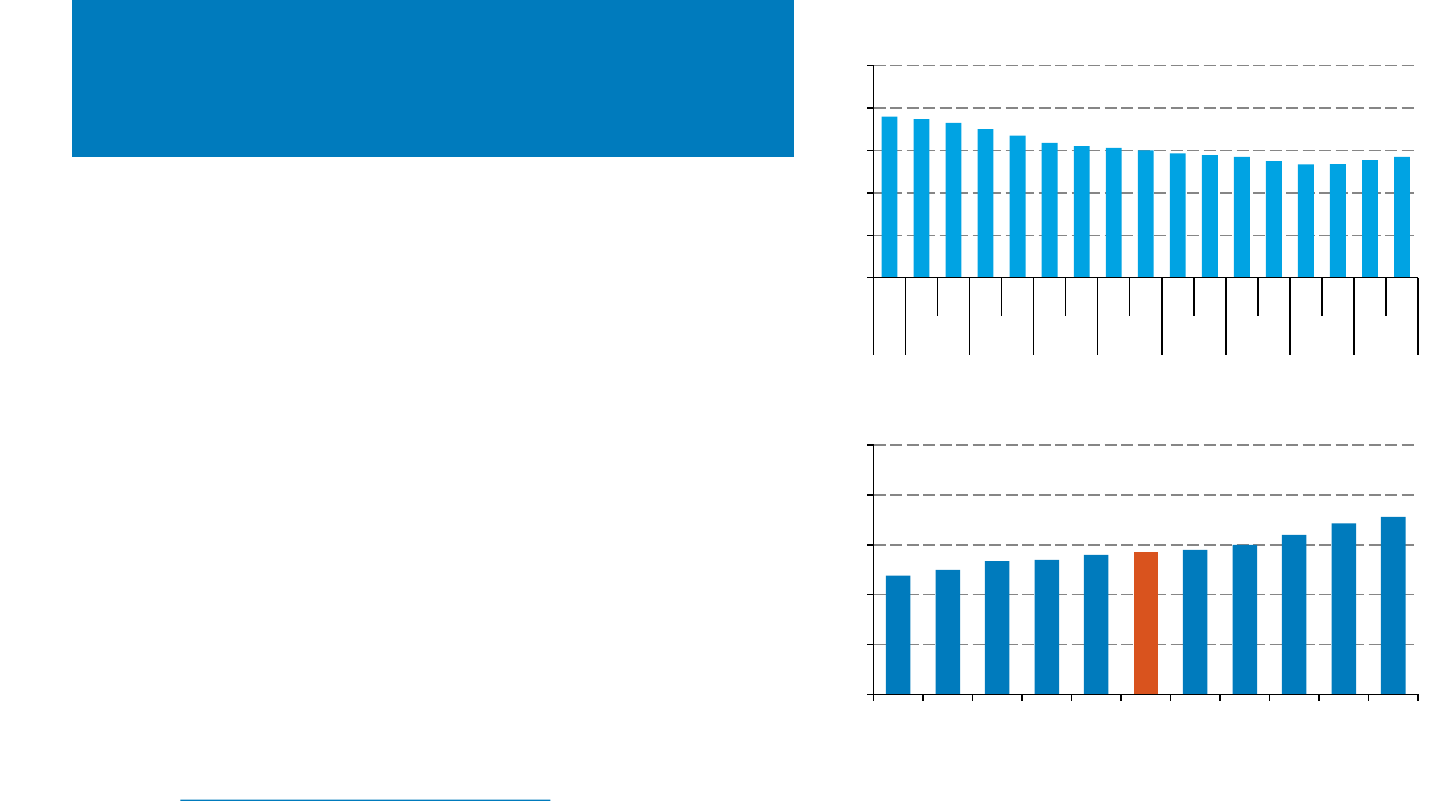
NREL | 57NREL | 57
Residential System Price Reported
by EnergySage
Note: Price based on winning quoted price.
Source: EnergySage, Solar Market place Intel Report H1 2022 – H2 2022.
• The median reported price by EnergySage for
residential PV systems increased 6.3% y/y – the third
straight period of increase, after never having done so
before.
– EnergySage attributed the price increase to supply
chain disruptions.
• Residential system price varied by state. In H2 2022,
the median price of a residential system in
Massachusetts was 50% higher than the median price
of a residential system in Arizona.
– Part of the price disparity between states is due to
differences in average system size, though other factors,
such as cost of living (e.g., Massachusetts), also play a role.
3.80
3.74
3.65
3.50
3.35
3.18
3.10
3.06
3.00
2.93
2.89
2.85
2.75
2.67
2.68
2.77
2.85
$0
$1
$2
$3
$4
$5
H2 H1 H2 H1 H2 H1 H2 H1 H2 H1 H2 H1 H2 H1 H2 H1 H2
2014 2015 2016 2017 2018 2019 2020 2021 2022
Median Gross Costs ($/W)
Cost over time
2.38
2.50
2.67
2.70
2.80
2.85
2.90
3.00
3.20
3.43
3.56
$0
$1
$2
$3
$4
$5
AZ FL TX NV CA US NJ NC GA NY MA
Median Gross Costs ($/W)
Cost by state, H2 2022
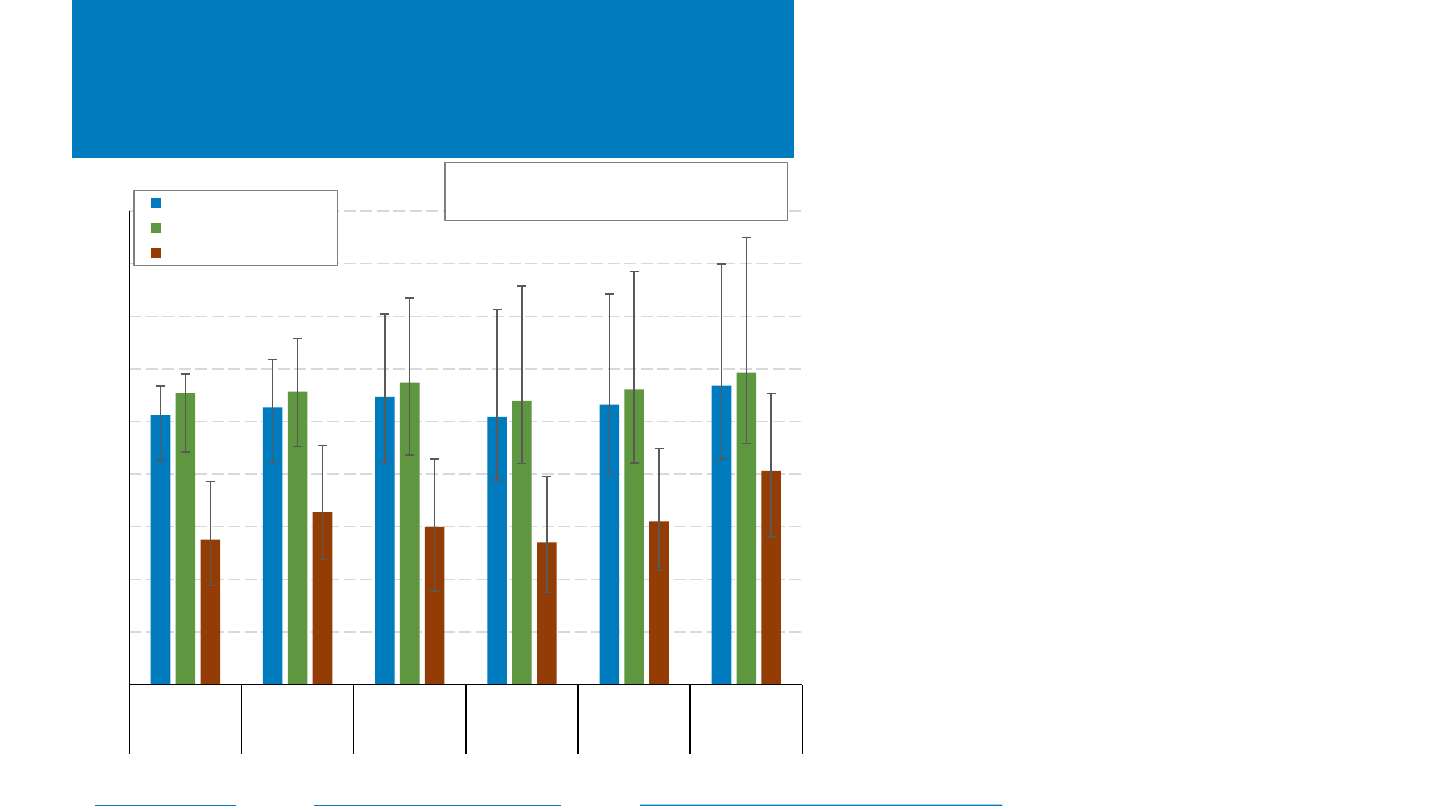
NREL | 58NREL | 58
Residential U.S. PV+Storage Pricing
• In the first few months of 2023, residential
PV+storage systems in Arizona, California, and
Massachusetts had a median system price of
$4,100/kWh, or $5,900/kWac
($5,700/kWdc)—an increase of 6%–31%
compared with full 2022 median values.
– Most of these systems offer 2–3 hours of storage.
– Units represent total system price divided by the
capacity of the battery (kWh) or the capacity of
the PV system (kW).
2023 YTD residential PV+storage sample, after data cleaning (MWdc): Arizona (6), California (17), Massachusetts (1)
Sources: Arizona Goes Solar (4/10/23); California Distributed Generation (2/28/23); Massachusetts Lists of Qualified Generation Units (4/5/23).
$0
$1,000
$2,000
$3,000
$4,000
$5,000
$6,000
$7,000
$8,000
$9,000
2018 2019 2020 2021 2022 2023
n= 3,497 n= 5,154 n= 9,209 n= 15,003 n= 22,369 n= 2,396
System Price
PV+Storage ($/kWdc)
PV+Storage ($/kWac)
PV+Storage ($/kWh)
Bars represent the median, with error bars
representing the 80
th
and 20
th
percentiles.
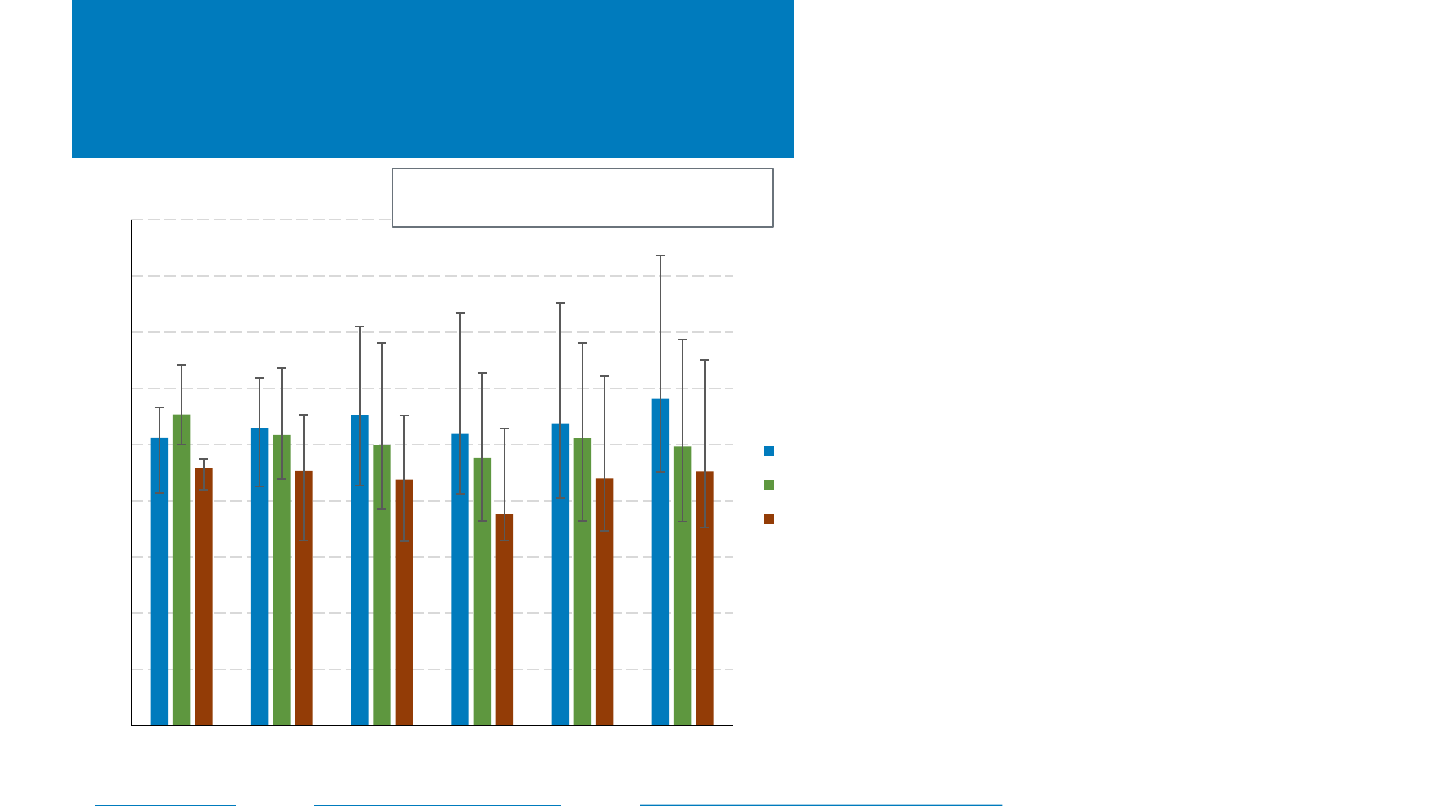
NREL | 59NREL | 59
Residential U.S. PV+Storage Pricing
• In the first few months of 2023, residential
PV+storage system prices in Arizona,
California, and Massachusetts varied between
states and internally.
– Prices may vary due to differences in storage
power and capacity, permitting and
interconnection differences, local competitive
factors, and installer experience.
• Compared with full median 2022 values,
prices (in dollars per kWdc of PV capacity)
increased in the first few months of 2023 in
California (8%), and Massachusetts (3%) while
decreasing in Arizona (3%).
$0
$1,000
$2,000
$3,000
$4,000
$5,000
$6,000
$7,000
$8,000
$9,000
2018 2019 2020 2021 2022 2023
System Price ($/kWdc)
CA
AZ
MA
Bars represent the median, with error bars
representing the 80
th
and 20
th
percentiles.
2023 YTD residential PV+storage sample, after data cleaning (MWdc): Arizona (6), California (17), Massachusetts (1)
Sources: Arizona Goes Solar (4/10/23); California Distributed Generation (2/28/23); Massachusetts Lists of Qualified Generation Units (4/5/23).
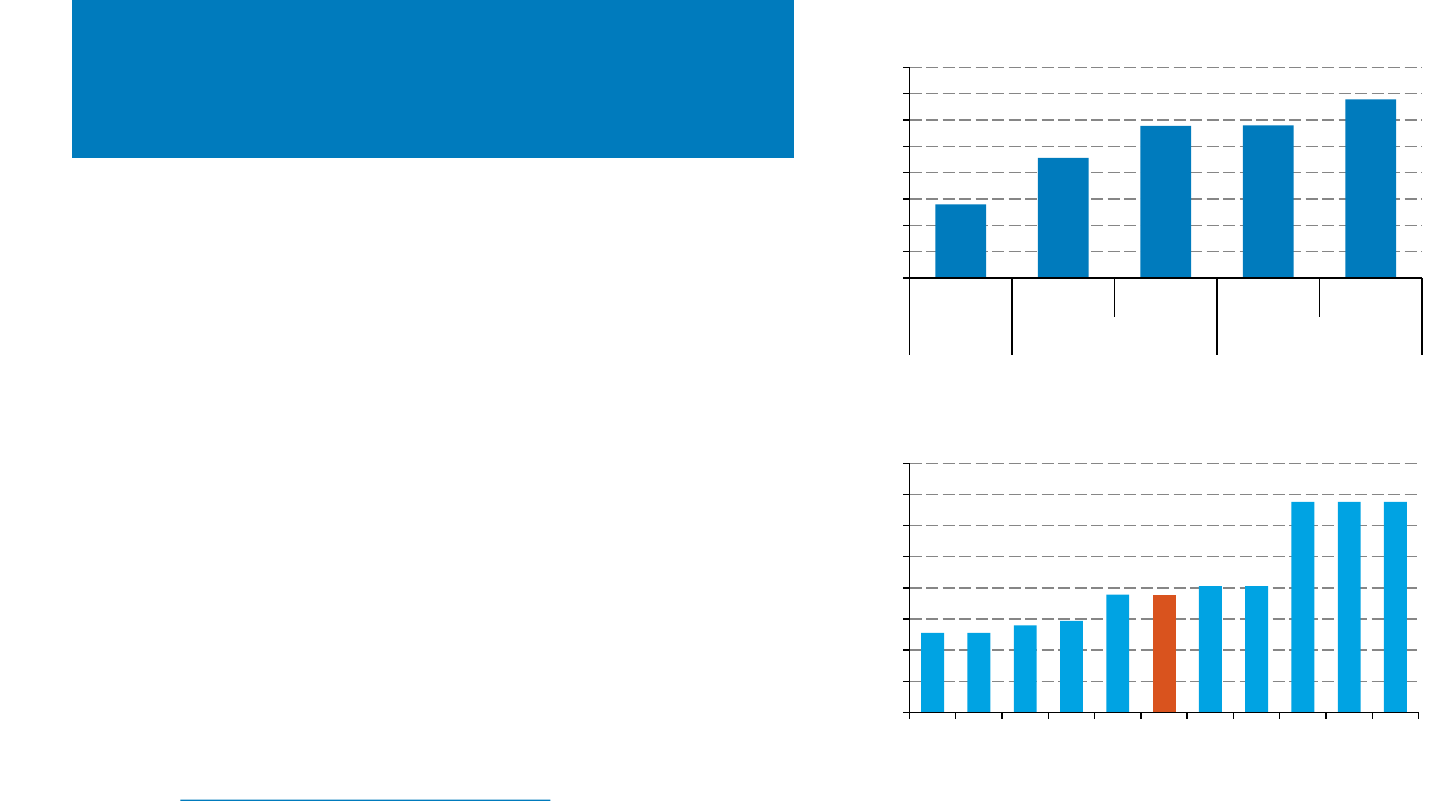
NREL | 60NREL | 60
Residential Storage Price Reported
by EnergySage
• The median reported price by EnergySage for
residential energy storage increased 3.9% y/y.
– EnergySage has shown an increase in energy
storage price since it first started reporting in
2020.
• Residential storage system price varied by state. In
H2 2022, the median price of a residential storage
system in Massachusetts, Pennsylvania, and
Virginia were 16% higher than the median price of
a residential storage system in North Carolina.
– In the EnergySage data set, the median cost of a battery
in the top ten states ranged from $13,000 to $18,000.
Note: Price based on winning quoted price.
Source: EnergySage, Solar Market place Intel Report H1 2022 – H2 2022.
$1,150
$1,200
$1,250
$1,300
$1,350
$1,400
$1,450
$1,500
$1,550
NC CO CA TX FL US AZ GA MA PA VA
Median Gross Costs ($/kWh)
Cost by state, H2 2022
$1,000
$1,050
$1,100
$1,150
$1,200
$1,250
$1,300
$1,350
$1,400
H2 H1 H2 H1 H2
2020 2021 2022
Median Gross Costs ($/kWh)
Cost over time

NREL | 61
Agenda
Global Solar Deployment1
U.S. PV Deployment
2
PV System Pricing
3
Global Manufacturing
4
Component Pricing
5
Market Activity
6
7 U.S. PV Imports
• In 2022, global PV shipments were approximately 283
GW—an increase of 46% from 2021.
• In 2022, 96% of PV shipments were mono c-Si
technology, compared to 35% in 2015.
– N-type mono c-Si grew to 51% - up from 20% in 2021
(and 5% in 2019).
• In 2022, the average module efficiency of modules
installed in the United States was approximately 20.7%
for mono c-Si, 17.5% for multi c-Si, and 18.5% for CdTe.
• In 2022, the United States produced a around 5 GW of
PV modules.
• Since the IRA’s passage, nearly 110 GW of manufacturing
capacity has been announced across the solar supply
chain, including 26 separate new manufacturing plants.
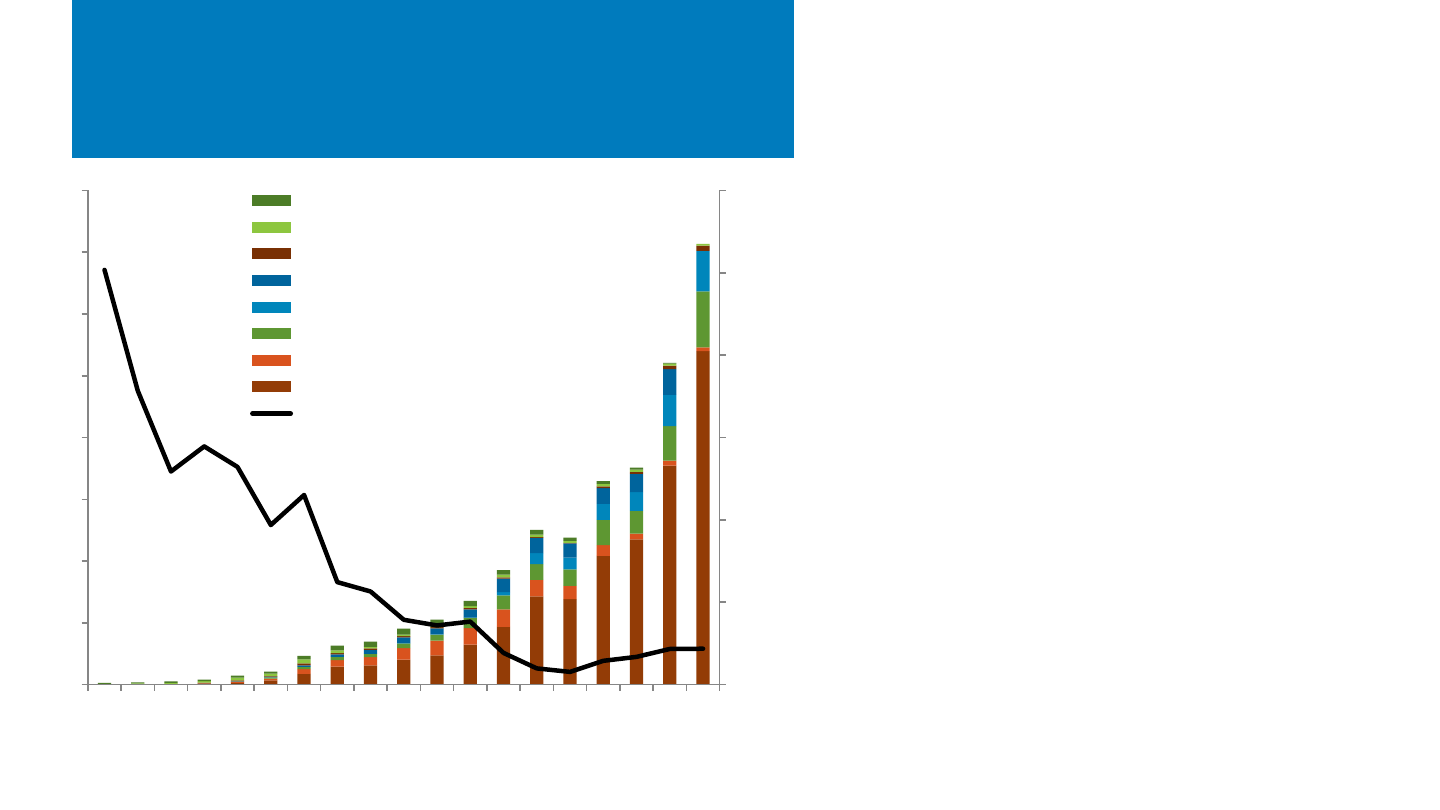
NREL | 62NREL | 62
Global Annual PV Shipments
by Region*
• In 2022, global PV shipments were
approximately 283 GW—an increase of 46%
from 2021.
– ¾ of the increase came from China, with the
remainder mostly coming from Southeast
Asia.
– U.S. production also grew 47%.
• From 2004 to 2022:
– The U.S.-manufactured percentage of global
PV shipments declined from around 13% to
1.2% (though it achieved its highest level
since 2015).
– The Chinese-manufactured share of global
PV shipments grew from 1% to 71%.
– Together the Malaysian-, Vietnamese-, and
South Korean-manufactured percentage of
global PV shipments went from 0% to 23%.
* Note: excludes inventory sales and outsourcing
Source: Paula Mints. "Photovoltaic Manufacturer Capacity, Shipments, Price & Revenues 2022/2023." SPV Market Research. Report SPV-Supply11. April 2023.
0%
2%
4%
6%
8%
10%
12%
14%
16%
2004
2005
2006
2007
2008
2009
2010
2011
2012
2013
2014
2015
2016
2017
2018
2019
2020
2021
2022
0
50
100
150
200
250
300
Percent of Shipments
PV Module Shipments (GW)
Japan
EU
U.S.
Rest of Asia
Vietnam
Malaysia
Taiwan
China
U.S. Share
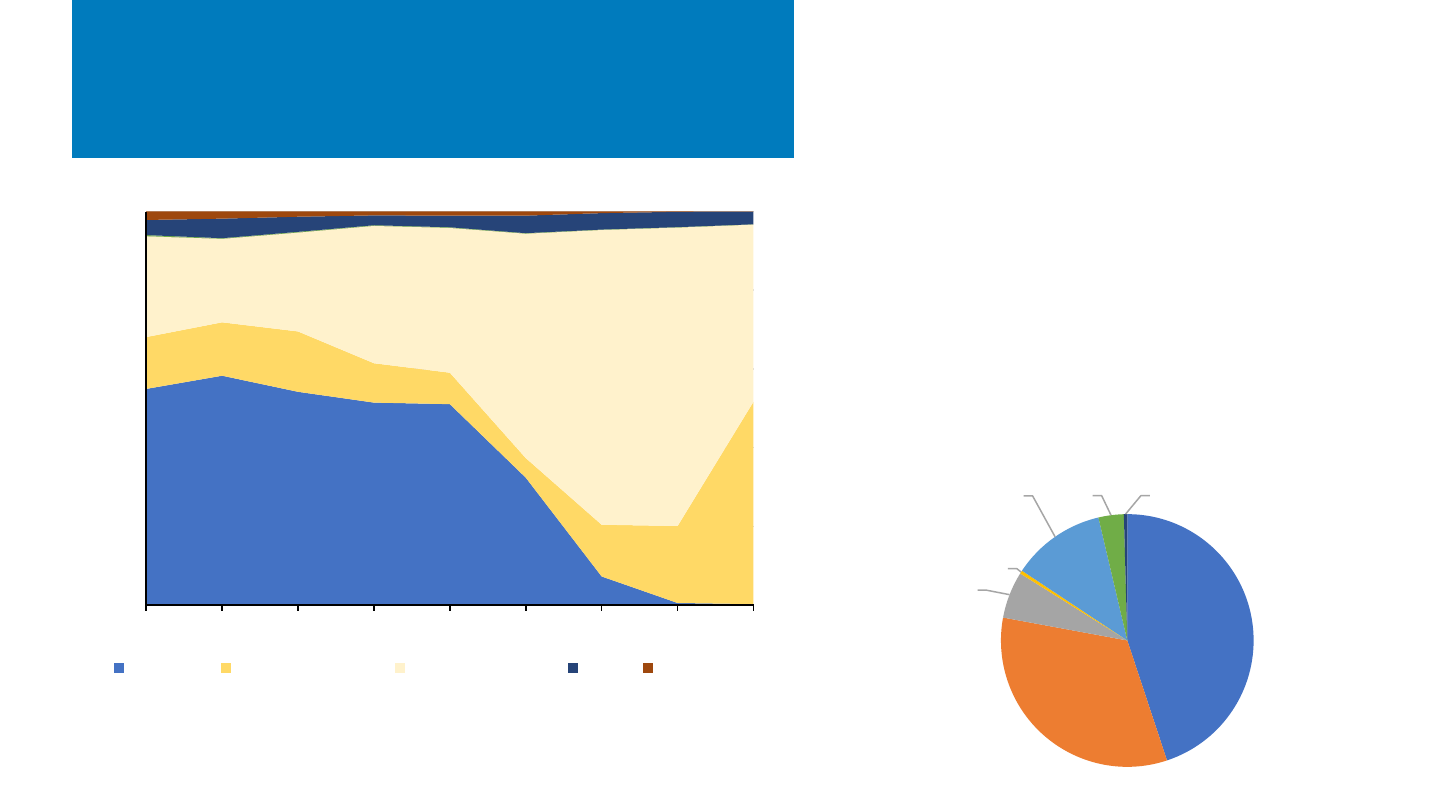
NREL | 63NREL | 63
Global Annual PV Shipments
by Technology*
• In 2022, 96% of PV shipments were mono c-
Si technology, compared to 35% in 2015.
– N-type mono c-Si grew to 51% - up from
20% in 2021 (and 5% in 2019).
• Mono P PERC was the leading cell type in
2022, followed by TOPCon, Mono N PERC,
and HJT.
*Notes: excludes inventory sales and outsourcing
** includes a-Si, CIS/CIGS, TOPCon (P Mono), and Multi PERC.
Source: Paula Mints. "Photovoltaic Manufacturer Capacity, Shipments, Price & Revenues
2022/2023." SPV Market Research. Report SPV-Supply11. April 2023.
0%
20%
40%
60%
80%
100%
2014 2015 2016 2017 2018 2019 2020 2021 2022
% of global PV shipments by technology
Multi c-Si Mono c-Si (n-type) Mono c-Si (p-type) CdTe CIGS/CIS
PERC (P Mono)
45%
TOPCon (N
Mono)
33%
HJT (N
Mono)
6%
IBC (N)
0%
PERC (N Mono)
12%
CdTe
3%
Other**
1%
Global Annual PV Shipments by Technology
2022 Global PV Shipments by Technology
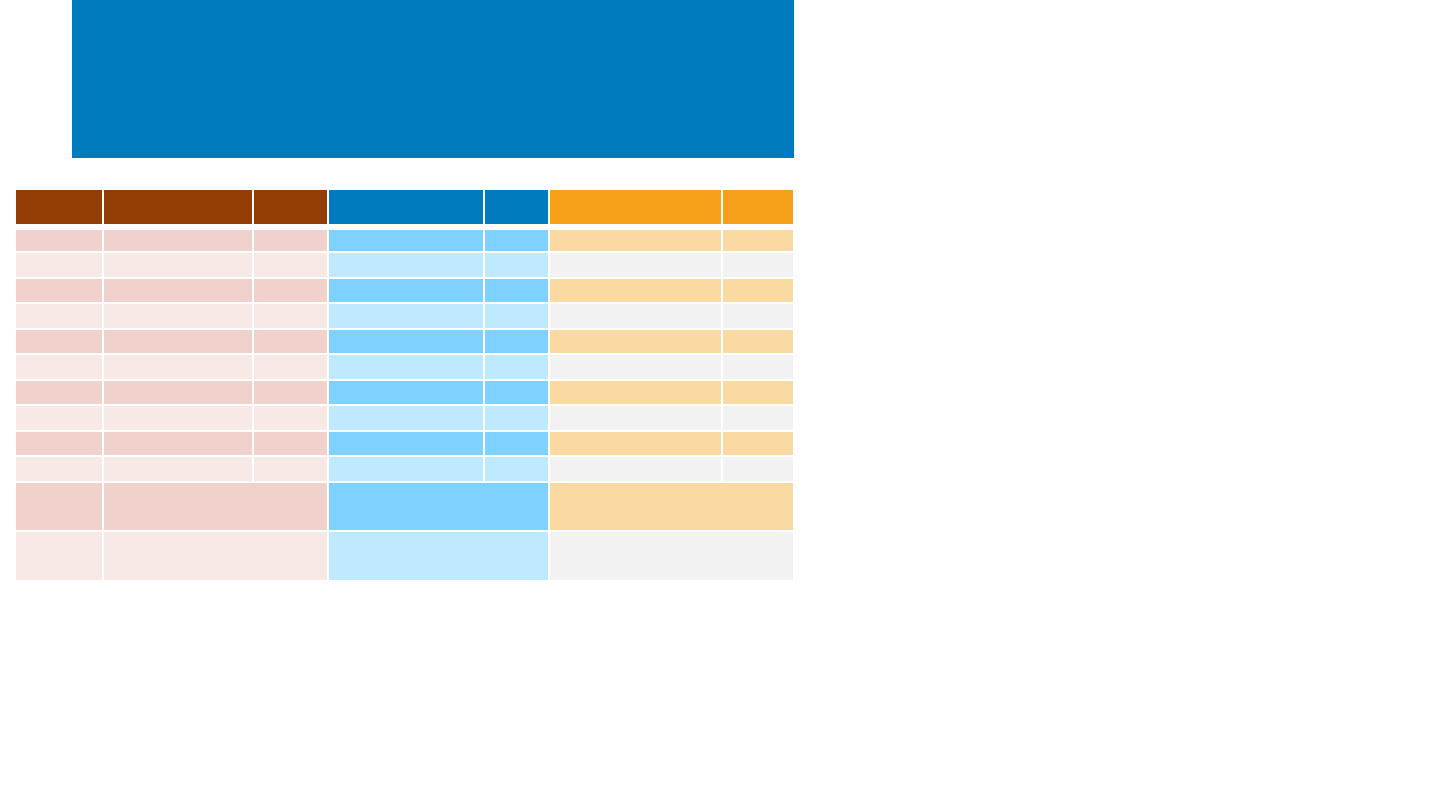
NREL | 64NREL | 64
Global Leading PV Manufacturers
by Shipments
Ranking
2017
GWp
2021 GWp 2022
GWp
1
JA Solar
6.5
Aiko 31.3 Tongwei
38.1
2
Canadian Solar
5.4
Tongwei 27.3 JA Solar
36.2
3
Zhongli Talesun
5.0
LONGi 19.6 Aiko
30.7
4
Jinko Solar
4.9
Jinko Solar 16.8 LONGi
29.2
5
Trina Solar
4.8
Zhongli Talesun 10.7 Jinko Solar
23.9
6
LONGi
4.5
JA Solar 10.7 Canadian Solar
16.8
7
Hanwha Q Cells
4.2
Canadian Solar 8.7 Trina Solar
14.5
8
Tongwei
3.8
Runergy 8.0 SolarSpace
11.6
9
Motech
3.2
Hanwha Q-Cells 7.6 Zhongli Talesun
9.8
10
Aiko
3.1
First Solar 7.6 First Solar
9.1
Total
Above
45.5
148.4
220.0
Total
Shipped
93.9
194.0
283.1
• From 2017 to 2022, shipments from the top 10 PV
manufacturers grew from 46 GW to 200 GW, with
some companies shipping more than 30 GW
annually.
• New companies quickly moved to top spots, in part
through the rapid growth of mono c-Si production.
• The list of leading companies remained relatively
stable between 2021 and 2022, and eight of the
ten leading manufacturers from 2017 remain.
– Only four companies remained in the top ten
between 2012 and 2017.
* Note: excludes inventory sales and outsourcing
Source: Paula Mints. "Photovoltaic Manufacturer Capacity, Shipments, Price & Revenues 2022/2023." SPV Market Research. Report SPV-Supply11. April 2023.
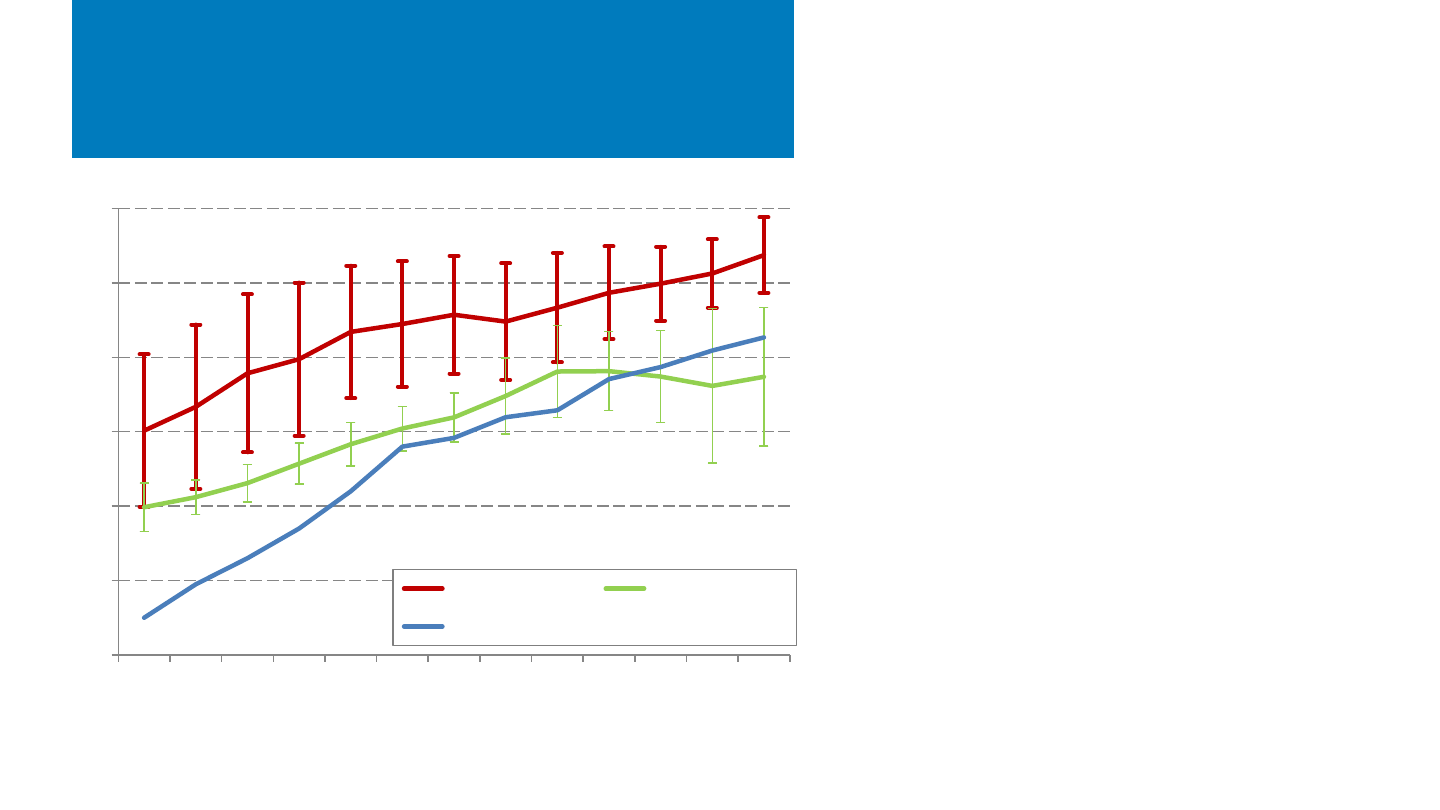
NREL | 65NREL | 65
PV Efficiency Improvements
• From 2010 to 2022, the weighted average
efficiency of installed modules increased:
– 16.0% to 20.7% for mono c-Si (Calif.)
– 14.0% to 17.5% for multi c-Si (Calif.)
– 11.0% to 18.5% for CdTe (U.S.)
• The variability in efficiency across modules
decreased during this period for mono c-Si but
increased for multi c-Si, while mono-Si almost
completely replaced multi-Si in the market.
• The variability of mono c-Si has decreased in
part because mainstream mono c-Si modules
have closed the efficiency gap with the
highest-efficiency technologies.
– For example, the gap between non-
SunPower mono c-Si modules and
SunPower mono c-Si modules was 3.8
percentage points in 2010, decreasing to
1.2 points in 2022.
Sources: CdTe: First Solar Investor Relations, average module efficiency produced. c-Si: California Interconnection
Dataset (2/28/23). Error bars represent +/- 1 weighted standard deviation.
10%
12%
14%
16%
18%
20%
22%
2010 2011 2012 2013 2014 2015 2016 2017 2018 2019 2020 2021 2022
Module Efficiency
Mono wt avg Multi wt avg
CdTe (First Solar)

NREL | 66NREL | 66
-10%
10%
30%
50%
70%
90%
2013
2015
2017
2019
2021
2013
2015
2017
2019
2021
2013
2015
2017
2019
2021
2013
2015
2017
2019
2021
2013
2015
2017
2019
2021
2013
2015
2017
2019
2021
Polysilicon Wafer Cells/Modules Inverters Integrators Yieldco
Median Gross Margin of Surveyed
Companies
Gross Margin
Across Supply Chain
• Polysilicon suppliers achieved historic margins in 2022, aided by an
undersupply within the marketplace.
Sources: Company figures from public filings and finance.yahoo.com. Error bars represent high and low values of surveyed companies. Companies surveyed are Polysilicon – GCL Poly, REC Silicon,
Wacker Chemie, Ferroglobe, Xinte, Daqo;
Wafers - ReneSola, Wafer Works Corp, SAS, Danen Technology Group, Green Energy Technology Inc; Cells/Modules, First Solar, JA Solar, LONGi, Tongwei,
Trina Solar, Canadian Solar, Risen, Aiko, Jinko Solar, DMEGC; Inverters – SolarEdge; Enphase; SMA Solar; Advanced Energy Industries; Integrators - Real Goods Solar, SolarCity, Vivint Solar, Sunrun,
SunPower, Sunworks, Emeren, Isun, SPI, Enlight Renewable Energy, Sunnova; IPP/Yieldco - Brookfield Renewable Partners; Algonquin Power & Utilities Corp; Clearwater Energy, Nextera Energy
Partners, Northland Power, Pattern Energy, Terraform Power, TransAlta Renewables. Data for Q4 2022 was not available for Enlight Renewable Energy, LONGi, and SMA Solar; TTM was used in place
of yearly values.
• Higher material cost (e.g., polysilicon) and continued
supply chain disruptions contributed to lower gross
margins, y/y of other market segments, however most
industries are still achieving relatively high margins
from a historical perspective.
– Many large manufacturers are leading across c-Si
process steps and therefore do not fit just within
one category.
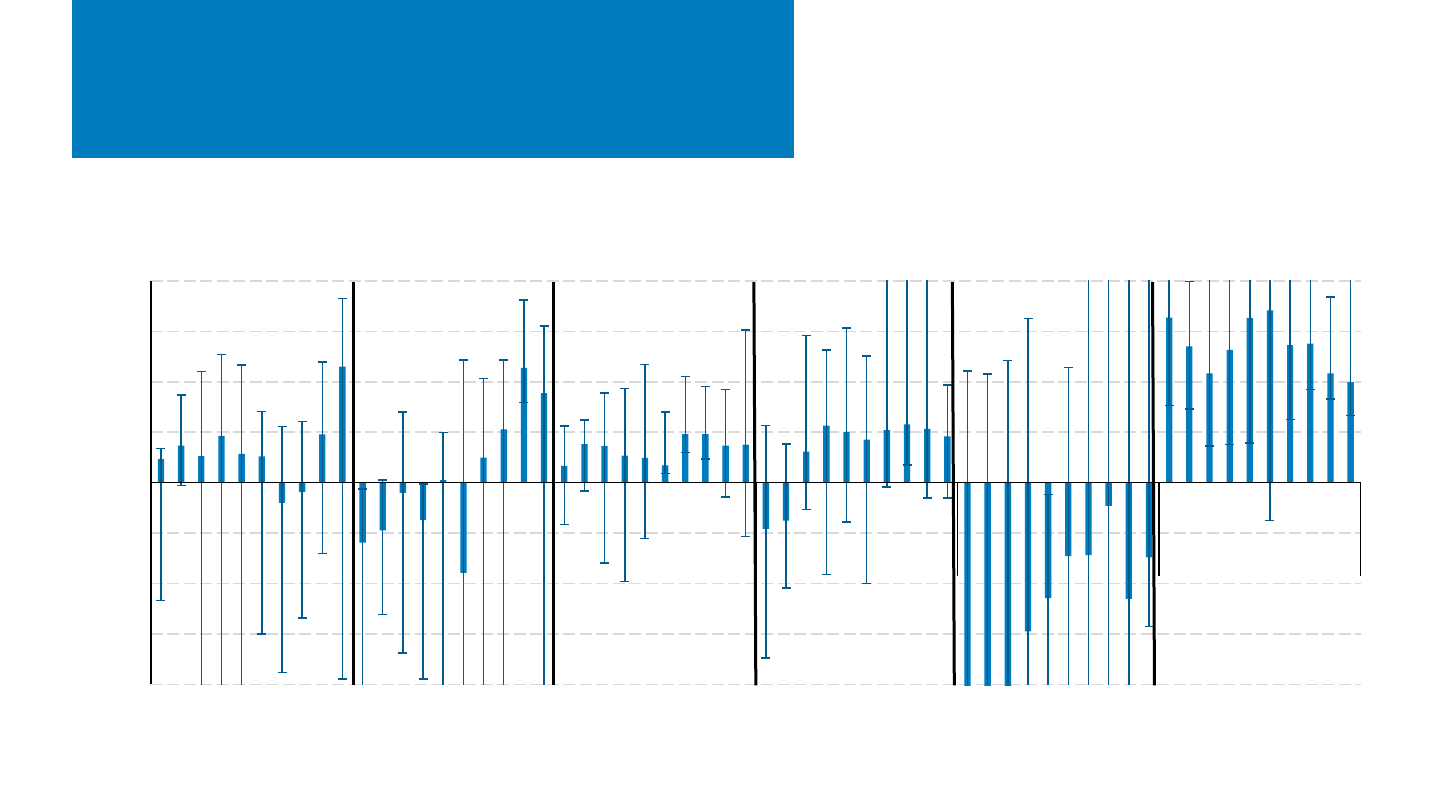
NREL | 67NREL | 67
-40%
-30%
-20%
-10%
0%
10%
20%
30%
40%
2013
2015
2017
2019
2021
2013
2015
2017
2019
2021
2013
2015
2017
2019
2021
2013
2015
2017
2019
2021
2013
2015
2017
2019
2021
2013
2015
2017
2019
2021
Polysilicon Wafer Cells/Modules Inverters Integrators Yieldco
Median Operating Margin of Surveyed
Companies
Operating Margin
Across Supply Chain
• With the exception of PV project integrators, solar companies
generally remained profitable, aided by robust gross margins
(particularly for polysilicon).
• While project integrators report operating losses, many
companies also finance PV projects, trading short-term
losses for long-term cash flow (and profitability).
Sources: Company figures from public filings and finance.yahoo.com. Error bars represent high and low values of surveyed companies. Companies surveyed are Polysilicon – GCL Poly, REC Silicon,
Wacker Chemie, Ferroglobe, Xinte, Daqo;
Wafers - ReneSola, Wafer Works Corp, SAS, Danen Technology Group, Green Energy Technology Inc; Cells/Modules, First Solar, JA Solar, LONGi, Tongwei,
Trina Solar, Canadian Solar, Risen, Aiko, Jinko Solar, DMEGC; Inverters – SolarEdge; Enphase; SMA Solar; Advanced Energy Industries; Integrators - Real Goods Solar, SolarCity, Vivint Solar, Sunrun,
SunPower, Sunworks, Emeren, Isun, SPI, Enlight Renewable Energy, Sunnova; IPP/Yieldco - Brookfield Renewable Partners; Algonquin Power & Utilities Corp; Clearwater Energy, Nextera Energy
Partners, Northland Power, Pattern Energy, Terraform Power, TransAlta Renewables. Data for Q4 2022 was not available for Enlight Renewable Energy, LONGi, and SMA Solar; TTM was used in place
of yearly values.
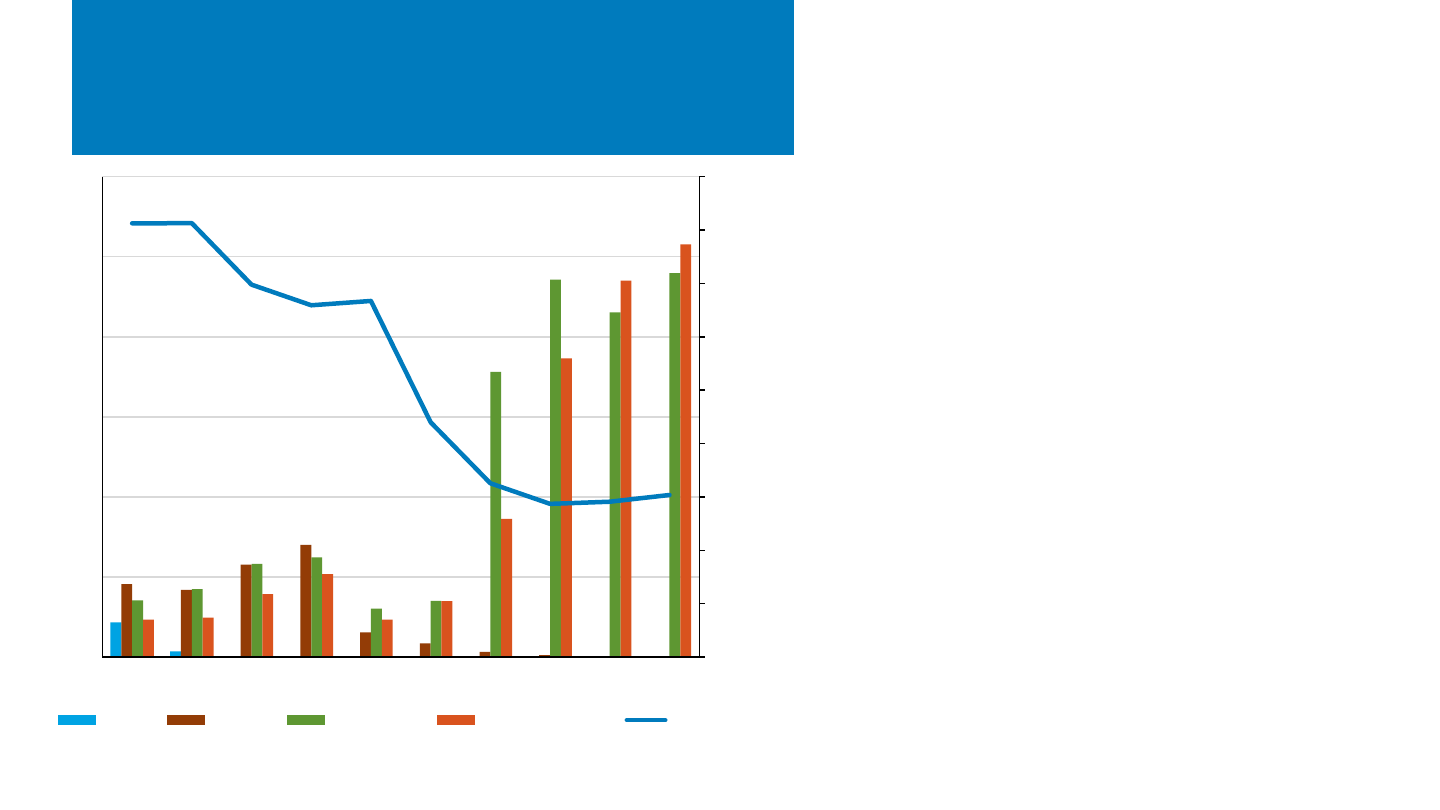
NREL | 68NREL | 68
U.S. PV Manufacturing
From 2013 to 2022, U.S. manufacturers faced varying degrees
of challenges.
• Wafer production in the United States ended in 2014, cell
production ended in 2020, and solar-grade polysilicon
production dropped by 2/3.
• PV-assembled modules stagnated until 2018 but has grown
by 7X since then.
– In 2022, the United States produced approximately 5
GW of PV panels – a 10% increase over 2021.
Source: PVTech Research. PV Manufacturing & Technology Quarterly Report - Release 28 - February 2023.
0
5
10
15
20
25
30
35
40
45
0.0
0.5
1.0
1.5
2.0
2.5
3.0
2013 2014 2015 2016 2017 2018 2019 2020 2021 2022
Annual Production (thousands MT)
Annual Production (GW)
Wafers c-Si Cells c-Si Modules Thin-film Modules Polysilicon
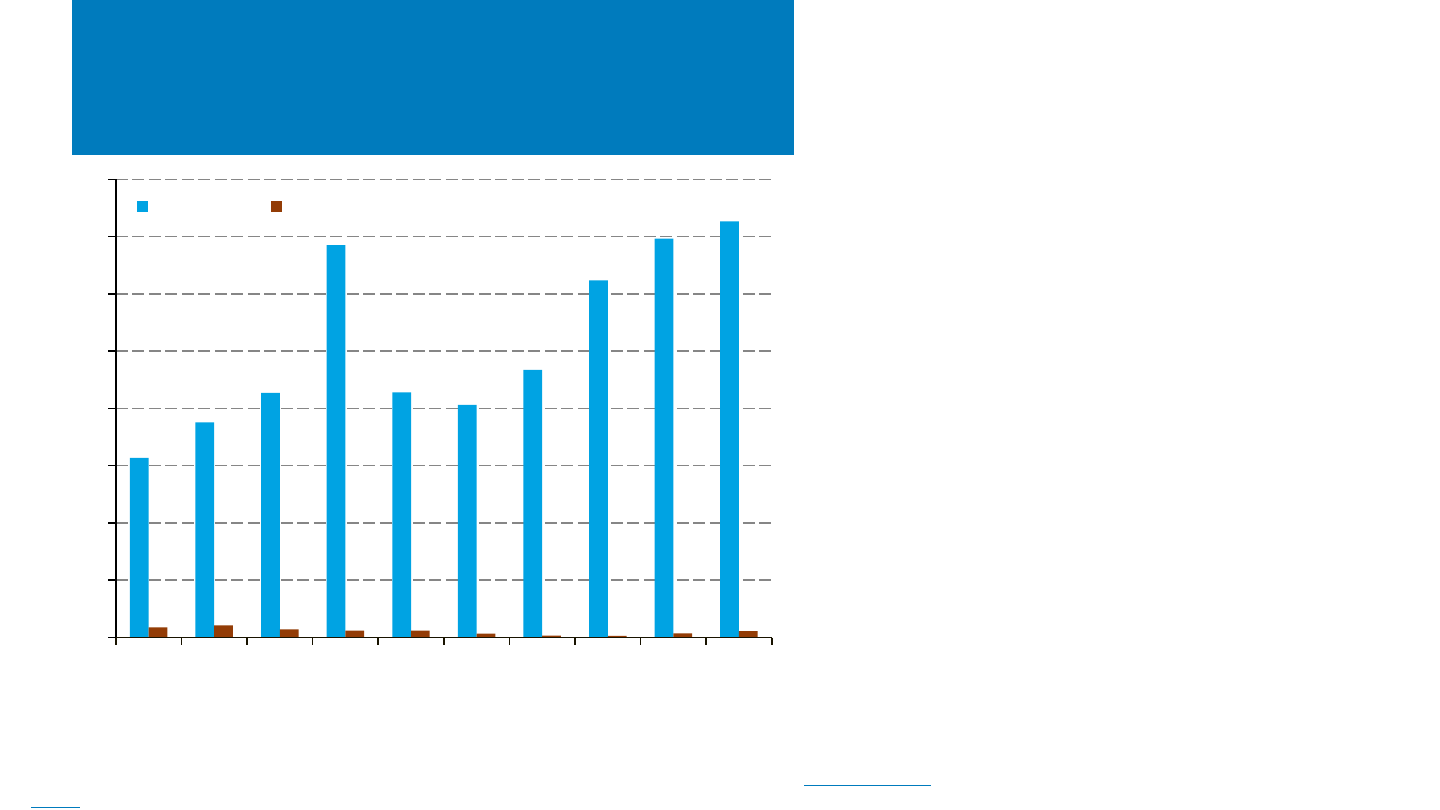
NREL | 69NREL | 69
Revenue of U.S. PV
• In 2022, the U.S. PV market had more than $37B in sales of
projects and manufactured products.
• While revenues from U.S. PV manufacturing (polysilicon, wafer,
cell, module) increased by more than 2X between 2019 and
2022, they still only represented 1.5% of total revenues from
U.S. PV system sales.
– U.S. produced module and components had greater
revenues in 2013 than in 2022 due to greater production
of polysilicon, wafers, and cells, as well as higher sales
prices.
• Similarly, while the U.S. installations decreased in 2022, y/y,
revenues increased to record levels due to increases in PV
system prices.
Note: all numbers are estimates. Manufacturing only includes polysilicon, wafer, cell, and module production. There are
other parts of the U.S. supply chain, including tracking, inverters, and balance of module materials (e.g., glass).
Sources: Manufacturing levels: PVTech Research. PV Manufacturing & Technology Quarterly Report - Release 28 - February
2023. Manufacturing price: BloombergNEF. Deployment: Wood Mackenzie Power & Renewables & SEIA, “U.S. Solar Market
Insight” (2014–2022). System costs: NREL Cost Benchmark. BLS.
0
5
10
15
20
25
30
35
40
2013 2014 2015 2016 2017 2018 2019 2020 2021 2022
Billions (2022 $)
Deployment Manufacturing
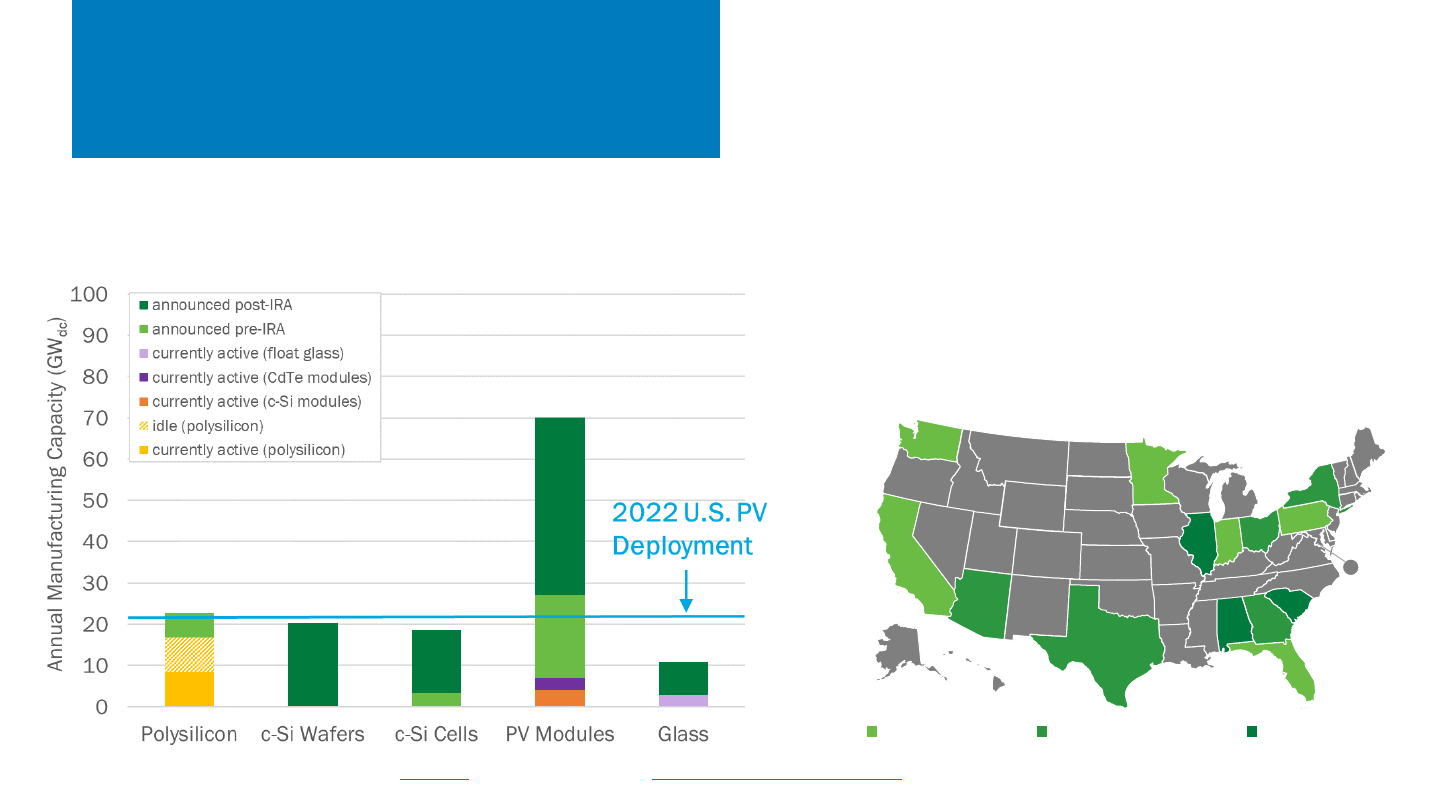
Domestic Manufacturing
Announcements
Sources: the U.S. International Trade Commission DataWeb, Wood Mackenzie/SEIA: U.S. Solar Market Insight: Q2 2022, and compilation of public announcements (see Appendix). *In addition
to new PV module, c-Si cell, and wafer manufacturing, there is also 6 GW of tracker, 8 GW of encapsulant, 1 GW of manufacturing tools, and 8 GW of inverter manufacturing not graphed.
DC
announced pre-IRA mix of pre- and post-IRA announced post-IRA
Since the IRA’s passage, nearly 110 GW* of manufacturing capacity
has been announced across the solar supply chain, including 26
separate new manufacturing plants.
A wide variety of announcements have been made in Q1 2023,
covering wafers, cells, modules, trackers, production tools, and
even PV recycling, although currently only modules have enough
announced capacity to meet 2022 deployment domestically.
– Notable announcements of the last several months include:
– 1-GW vertical cell/module facility from Silfab
– 1-GW module facility from Hounen in SC
– 5-GW module facility from Illuminate USA (LONGi) in OH.
These announcements pre- and post-IRA represent potential
investment in at least 14 states with most slated to begin
operation within the next 2 years.
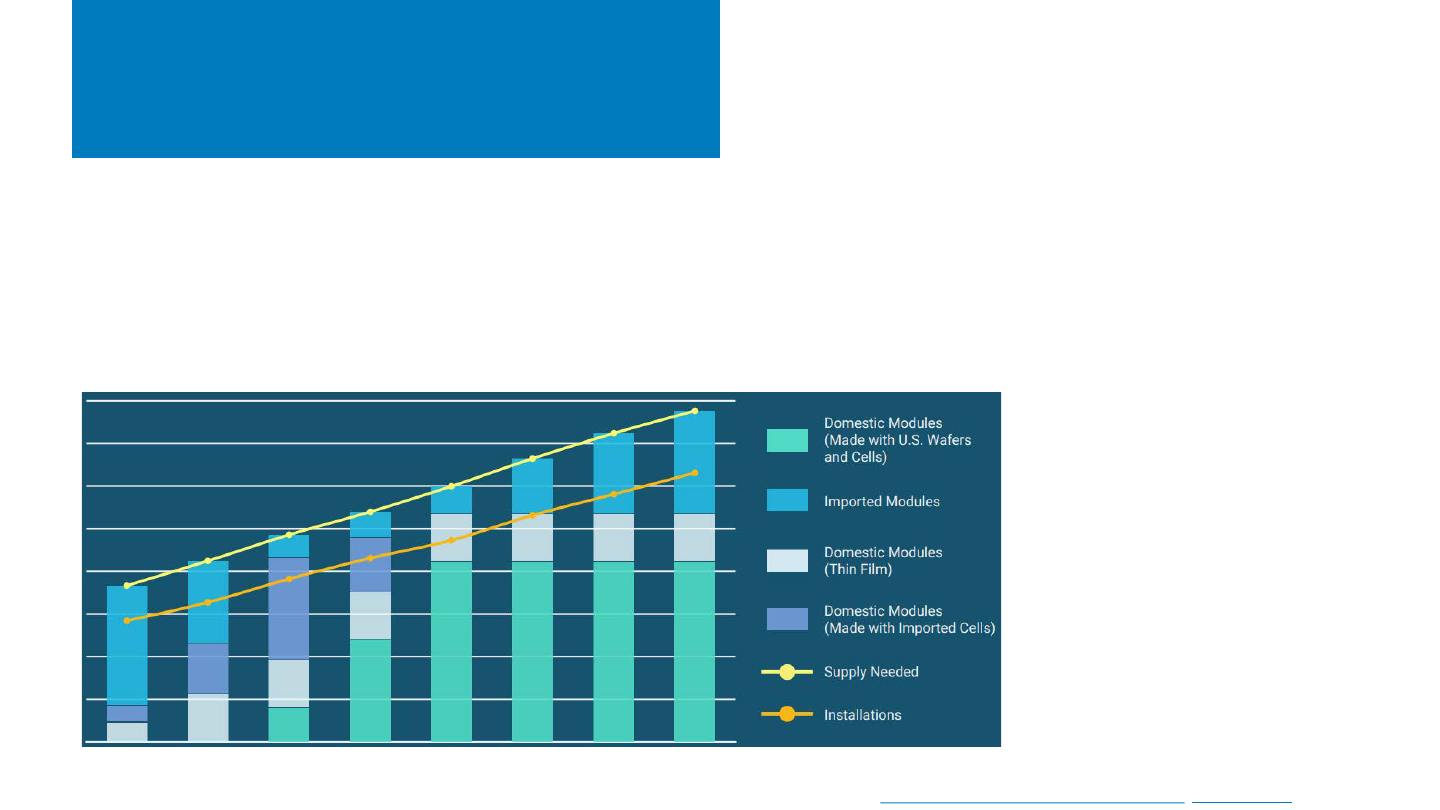
SEIA White Paper on
American Manufacturing
0
10
20
30
40
50
60
70
80
2023 2024 2025 2026 2027 2028 2029 2030
GWdc
Sources: Manufacturing Renaissance Report 2023 (seia.org), SEIA dashboard, internal DOE tracking
The solar trade association SEIA released a white paper forecasting that U.S. domestic module production will exceed 50 GW by 2027,
initially supplied by imported cells while domestic cell capacity is built and begins to come online in 2025.
– From 2030-2027, they predict the continued growth in installations will be supplied by imported modules.
SEIA is tracking 47 GWdc of announced module capacity, 16 GWdc of announced cells, 16 GWdc of announced wafers, nearly 9 GWac of
inverters, and over 100 GWh of battery manufacturing announcements since IRA.
– They highlighted recent announcements, including: Illuminate USA (LONGi/Invenergy partnership) in Ohio making 5 GW modules, Hounen
(Cambodian/Chinese) in South Carolina making 1 GW modules, Silfab (location TBD) manufacturing 1 GW cells and modules.
SEIA cautions that a self-sustaining
industrial base will also require support
for reshoring the manufacturing
equipment and raw materials as well.
SEIA predicts that by 2030, IRA will
have led to the creation of 115,000 jobs
in solar and storage manufacturing,
with more than half a million jobs
across the entire industry.

NREL | 72
Agenda
Global Solar Deployment1
U.S. PV Deployment
2
PV System Pricing
3
Global Manufacturing
4
Market Activity
5
Component Pricing
6
7 U.S. PV Imports
• After plunging to a 1.5-year low of $20/kg in mid-
January, global polysilicon spot prices rebounded to
$30/kg in mid-February and then dropped to $24/kg by
mid-April.
• Global module prices have declined steadily since fall
2022 despite strong demand, reaching lows in April 2023
that have not been seen for 2 years.
• In Q1 2023 (first 2 months), the average U.S. module
price ($0.36/Wdc) was down 11% q/q and down 2% y/y,
with modules trading at a 57% premium over the global
spot price for monofacial monocrystalline silicon
modules.

NREL | 73NREL | 73
PV Value Chain Global Spot Pricing
Source: BloombergNEF, Solar Spot Price Index (4/21/23); BloombergNEF, Bimonthly PV Index (4/17/23).
After plunging to a 1.5-year low of $20/kg in
mid-January, global polysilicon spot prices
rebounded to $30/kg in mid-February and
then dropped to $24/kg by mid-April.
• Analysts were expecting these price reductions as
more polysilicon capacity has come online and the
trend toward oversupply conditions continues.
• Estimated polysilicon production in March 2023
alone would be enough to produce 40 GWdc of
modules, or 1.5 times projected global module
demand on an annualized basis.
After following a similar pattern early in 2023,
global wafer and cell prices remained more
stable in February through April.
Global module prices have declined steadily
since fall 2022 despite strong demand,
reaching lows in April 2023 that have not been
seen for 2 years.
$0
$5
$10
$15
$20
$25
$30
$35
$40
$45
$0.00
$0.05
$0.10
$0.15
$0.20
$0.25
$0.30
Average Polysilicon Spot Price ($/kg)
Average Wafer, Cell, and Module Spot Price ($/Wdc)
Cells, mono ($/Wdc) Monofacial modules, mono ($/Wdc)
Bifacial modules, 210 mm, mono ($/Wdc) Wafers, mono M10 ($/Wdc)
Polysilicon ($/kg)
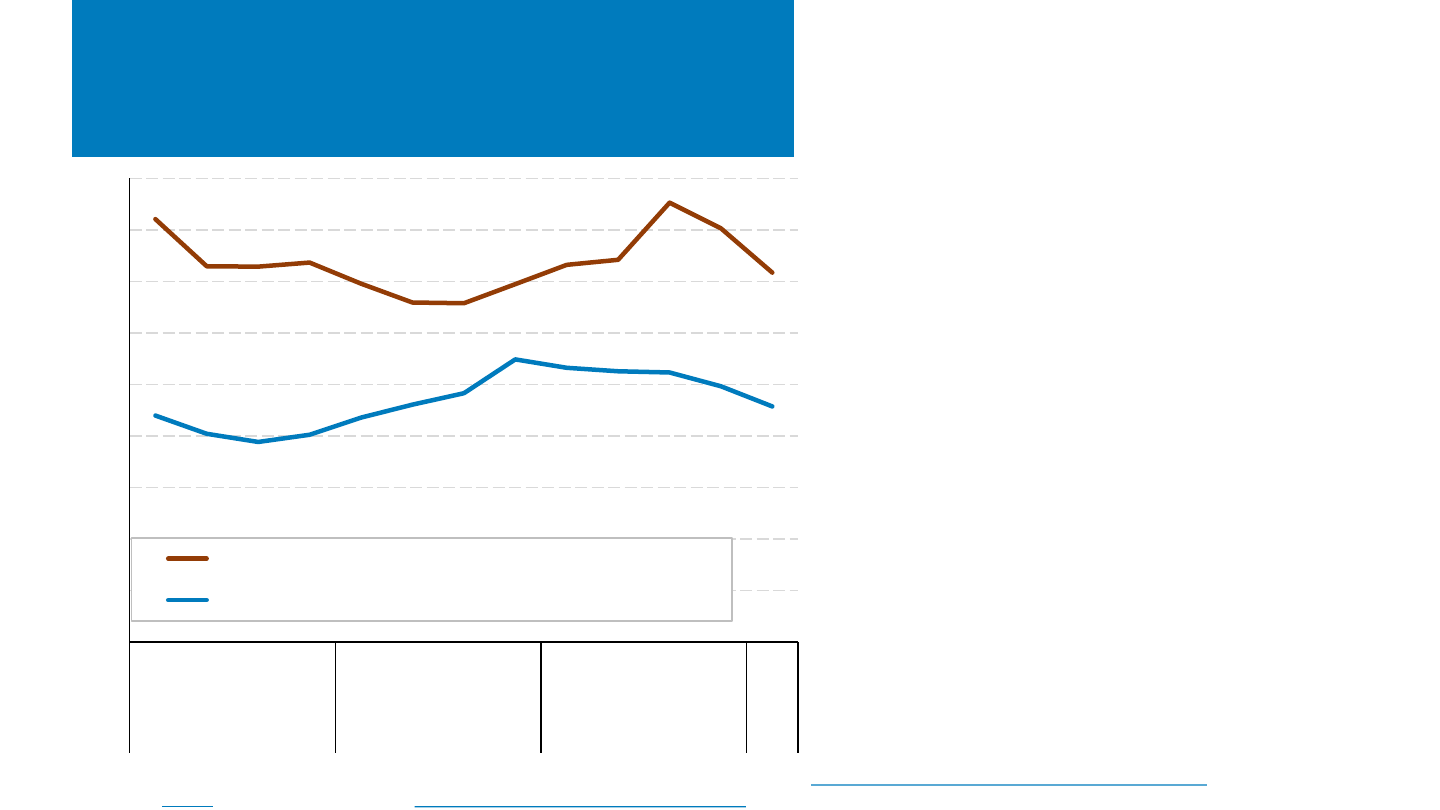
NREL | 74NREL | 74
Module Prices:
Global Versus United States
Source: BloombergNEF, Solar Spot Price Index (4/21/23); BloombergNEF, Bimonthly PV Index (4/17/23); EIA, Monthly Solar Photovoltaic Module Shipments Report
(4/25/23); PV Tech (4/5/23); Wood Mackenzie & SEIA, US Solar Market Insight: 2022 Year in Review (3/23).
• In Q1 2023 (first 2 months), the average U.S. module
price ($0.36/Wdc) was down 11% q/q and down 2%
y/y, with modules trading at a 57% premium over the
global spot price for monofacial monocrystalline
silicon modules.
• The directional trend in U.S. module prices realigned
with the trend in global module prices in Q4 2022 and
Q1 2023.
– The spike in U.S. prices in Q3 2022 was influenced
by implementation of the Uyghur Forced Labor
Prevention Act (UFLPA), beginning June 21, 2022.
– Subsequently, U.S. prices declined at a more rapid
pace than global spot prices.
• Clean Energy Associates projects that Chinese and
Southeast Asian module prices will decline by around
15% over the next 3 years, but market prices in the
U.S. will be the world’s highest because of supply
shortages related to the UFLPA.
$0.00
$0.05
$0.10
$0.15
$0.20
$0.25
$0.30
$0.35
$0.40
$0.45
Q1 Q2 Q3 Q4 Q1 Q2 Q3 Q4 Q1 Q2 Q3 Q4 Q1 (2
mo)
2020 2021 2022 2023
PV Module Price ($/Wdc)
U.S. average module value
Global spot price, monofacial monocrystalline modules
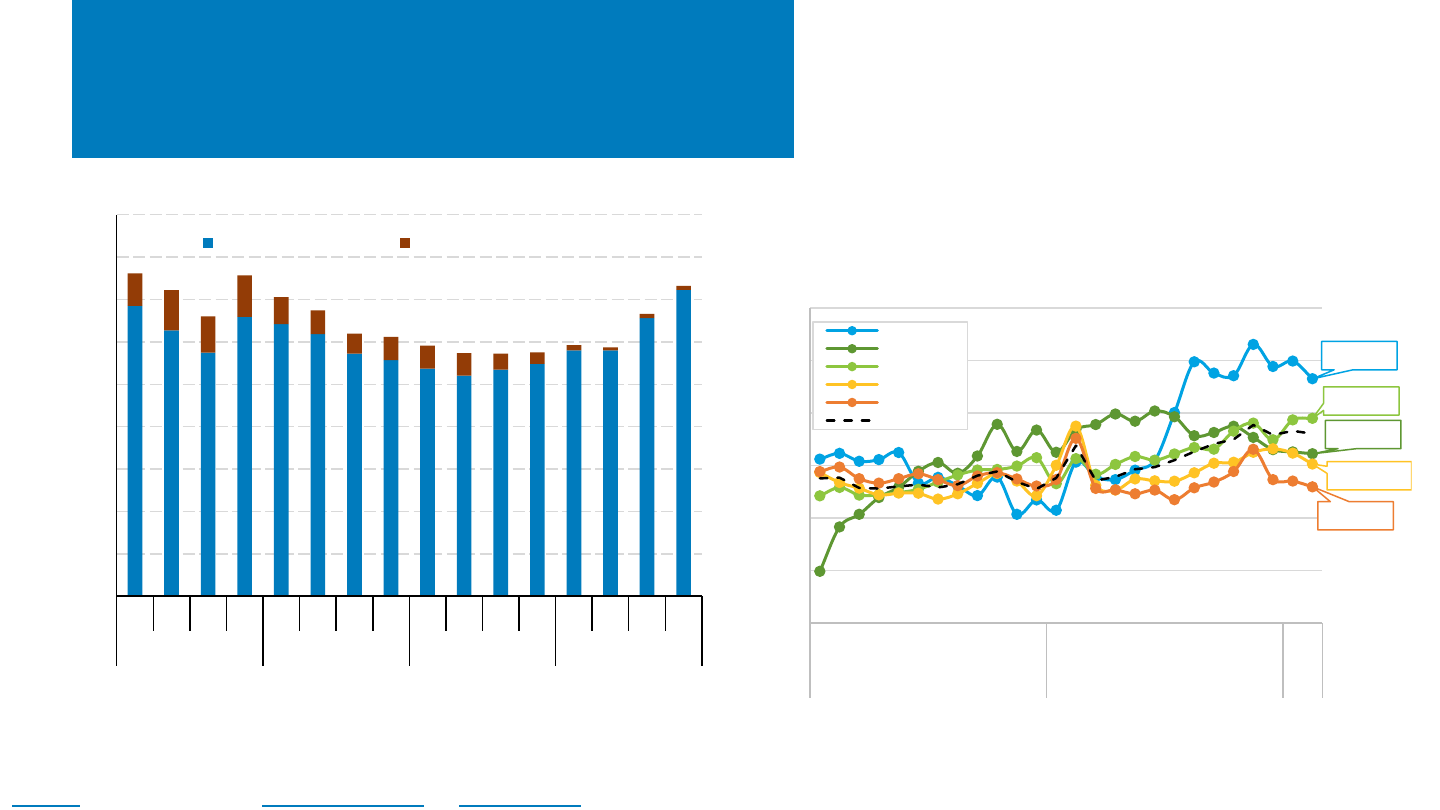
NREL | 75NREL | 75
Calculated U.S. Module Pricing
Based on the reported value and capacity of imported
PV modules, the average price of a PV module in the
United States has continued to rise in Q4 2022 to
$0.36/W before tariffs.
– After climbing steadily during 2022, prices appear to be
leveling off, although prices in South Korea remain elevated.
Note: The tariff rate was adjusted by the capacity subject to the tariffs. Manual corrections were made to three values due to suspected data entry errors for HTS code 8541430010: Cambodia
(February 2022), Malaysia (June 2020), and Vietnam (July 2019).
Sources: Imports by HTS code: 8541460015(2018-2021)/8541430010(2022-), Customs Value and Second Quantity (watts) from the U.S. International Trade Commission
DataWeb, the U.S. Census Bureau USA Trade Online tool and corrections page as of 4/11/23.
370 MW
490 MW
830 MW
1100 MW
740 MW
0.00
0.10
0.20
0.30
0.40
0.50
0.60
JAN
FEB
MAR
APR
MAY
JUN
JUL
AUG
SEP
OCT
NOV
DEC
JAN
FEB
MAR
APR
MAY
JUN
JUL
AUG
SEP
OCT
NOV
DEC
JAN
FEB
2021 2022 2023
Imported Module Price ($/W)
South Korea
Cambodia
Thailand
Vietnam
Malaysia
Global Total
$0.00
$0.05
$0.10
$0.15
$0.20
$0.25
$0.30
$0.35
$0.40
$0.45
Q1 Q2 Q3 Q4 Q1 Q2 Q3 Q4 Q1 Q2 Q3 Q4 Q1 Q2 Q3 Q4
2019 2020 2021 2022
Calculated U.S. Module Price
Imported value/Watt "Effective" 201 Tarrif Rate
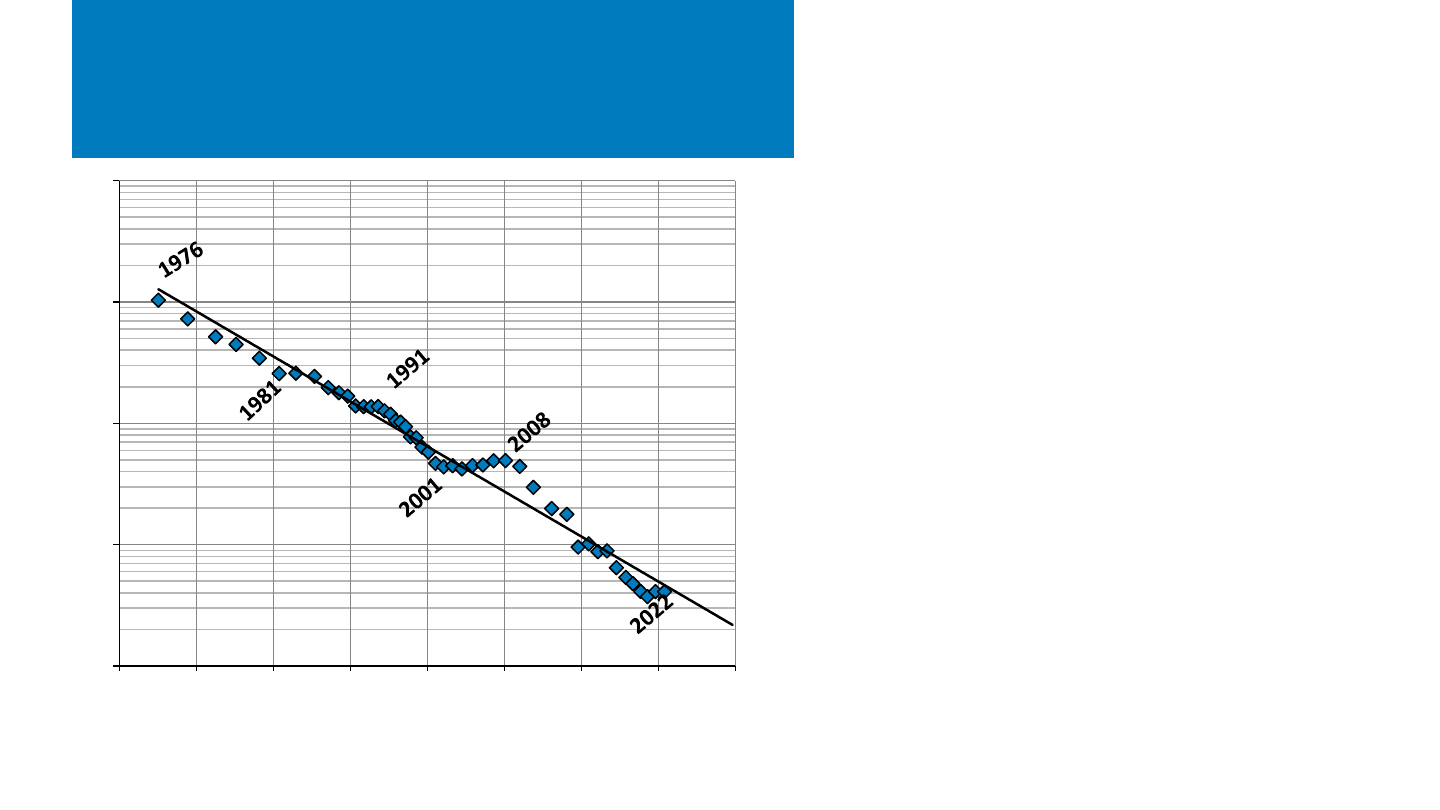
NREL | 76NREL | 76
PV Experience Curve
• This solar PV experience curve, known as
Swanson’s Law, displays the relationship, in
logarithmic form, between the average selling
price of a PV module and the cumulative global
shipments of PV modules.
• For every doubling of cumulative PV shipments
from 1976 to 2022, there has been on average
a ~22% reduction in PV module price.
• From 2008-2020, the PV industry experienced
accelerated improvements, putting module
ASPs below the historical experience curve
since 2012 – since then, it has largely returned
to the historical average
.
Source: SPV Market Research. Report SPV-Supply10. April 2023.
0.1
1
10
100
1,000
0 1 10 100 1,000 10,000 100,000 1,000,000 10,000,000
Module ASP (2022 $/W)
Cumulative Global Shipments (MW)

NREL | 77
Agenda
Global Solar Deployment1
U.S. PV Deployment
2
PV System Pricing
3
Global Manufacturing
4
Component Pricing
5
Market Activity
6
7 U.S. PV Imports
• Solar stocks represented by the Invesco Solar ETF rose
6.4% in Q1 2023, largely mirroring the S&P 500, which
rose 6.7%. Factors boosting solar stocks included large
investments in U.S. solar manufacturing and strong
demand for solar in Europe and the United States.
Headwinds included concerns about inflation and
interest rate increases as well as continuing uncertainty
about constraints on module imports. In general, shares
in manufacturers fared better than shares in installers
and project developers.
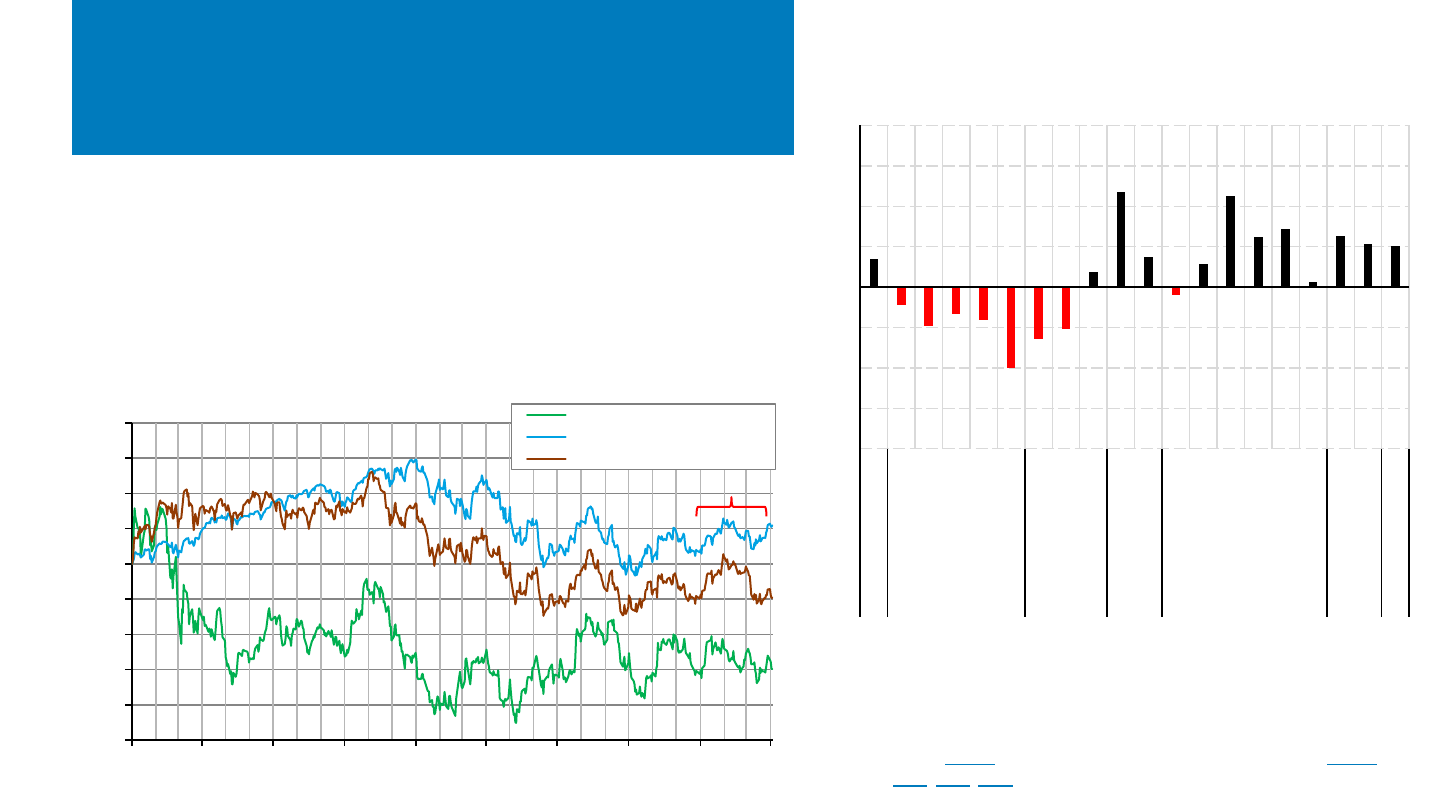
NREL | 78NREL | 78
-50%
-40%
-30%
-20%
-10%
0%
10%
20%
30%
40%
Jan-21 Apr-21 Jul-21 Oct-21 Jan-22 Apr-22 Jul-22 Oct-22 Jan-23
Apr-2
% Change (Index: 01/04/21
Adjusted Close)
Invesco Solar ETF (TAN)
S&P 500 Index
Russell 2000
Stock Market Activity
Solar stocks represented by the Invesco Solar ETF rose 6.4% in Q1 2023,
largely mirroring the S&P 500, which rose 6.7%. Factors boosting solar stocks
included large investments in U.S. solar manufacturing and strong demand
for solar in Europe and the United States. Headwinds included concerns
about inflation and interest rate increases as well as continuing uncertainty
about constraints on module imports. In general, shares in manufacturers
fared better than shares in installers and project developers.
Note: The TAN index is weighted toward particular countries and sectors. As of
4/6/23, 46% of its funds were in U.S. companies and 21% were in Chinese
companies. Its top 10 holdings, representing 55% of its value, were First Solar,
Enphase, SolarEdge, Xinyi, GCL, Sunrun, Shoals, Array Technologies, Meyer
Burger, and Daqo.
Sources: Invesco (4/6/23); Mercom, Solar Market Intelligence Report (4/3/23); PV
Magazine (2/23
, 3/23, 4/23).
Q1 2023
-80%
-60%
-40%
-20%
0%
20%
40%
60%
80%
Atlantica Yield
Sunworks
SunPower
Sunnova
Sunrun
Azure Power
Ginlong
Enphase Energy
SolarEdge
Soltec Power
Array Tech.
Solargiga Energy
Tainergy Tech
First Solar
Jinko Solar
Canadian Solar
Shunfeng
Wacker Chemie
Daqo
Meyer Burger
Yieldcos Installers Inverters Trackers PV Manufacturers Poly Equip.
Individual Stock Performance (Q1 2023)

NREL | 79
Agenda
Global Solar Deployment1
U.S. PV Deployment
2
PV System Pricing
3
Global Manufacturing
4
Component Pricing
5
Market Activity
6
7 U.S. PV Imports
• According to U.S. Census data, 28.7 GWdc of modules and 2.5 GWdc of
cells were imported in 2022, an increase of 21% y/y (+5 GW) and 7%
y/y (178 MW), respectively.
– Collectively, Malaysia, Vietnam, Thailand, and Cambodia
represented 73% of c-Si module imports (75% including c-Si cells).
– Imports from India and South Korea grew significantly in 2022.
• According to U.S. Census data, 2.5 GWdc of cells were imported in
2022. Quarterly cell imports grew for the second quarter in a row in
Q4 2022 (+60 MWdc, +9% q/q).
• In 2022, only 10% (2.7 GWdc) of modules reported a tariff, compared
to 56% (13.2 GWdc) in 2021.

NREL | 80NREL | 80
Annual c-Si Cell + Module Imports
Sources: Imports by HTS code: 8541460015(2018-2021)/8541430010(2022-) and 8541460035(2018-2021)/8541430080(2022-), Second Quantity (watts) from the
U.S. International Trade Commission DataWeb as well as the U.S. Census Bureau USA Trade Online tool and corrections page as of 4/11/23.
According to U.S. Census data, 28.7 GW
dc
of modules were
imported in 2022, an increase of 21% y/y (+5 GW).
– In 2022, 16% of modules were imported from Malaysia, 37% from
Vietnam, 17% from Thailand, 7% from Cambodia for a total of
78% of all module imports (or 73% of c-Si modules) coming from
the four countries under investigation for circumventing AD/CVD
duties. Including cell imports, it’s 75% of c-Si imports.
– An additional 11% of module imports from 2022 were from South
Korea, and 4% were from either Canada or Mexico.
According to U.S. Census data, 2.5 GW
dc
of cells were imported in 2022,
a decrease of 7% y/y (178 MW).
– In 2022, Malaysia represented 62% of cell imports, up from only 27% in 2021. In
contrast, South Korea fell to only 3% of annual imports in 2022 from 44% in 2021.
– Modules imports from South Korea grew by 1.3 GW between 2021 and 2022,
which matches well with the 1.1 GW decrease of cell imports.
0.0
0.5
1.0
1.5
2.0
2.5
3.0
2018 2019 2020 2021 2022
Imported c
-Si Cells (GW
dc
)
U.S. c-Si Cell Imports by Region
ROW
Indonesia
Philippines
India
Japan
Cambodia
Taiwan
Thailand
Vietnam
Malaysia
China
South Korea
0
5
10
15
20
25
30
2018 2019 2020 2021 2022
Imported Modules (GW
dc
)
U.S. Module (c-Si + CdTe) Imports by Region
ROW
Rest of Asia
N. America
China
South Korea
Cambodia
Thailand
Vietnam
Malaysia
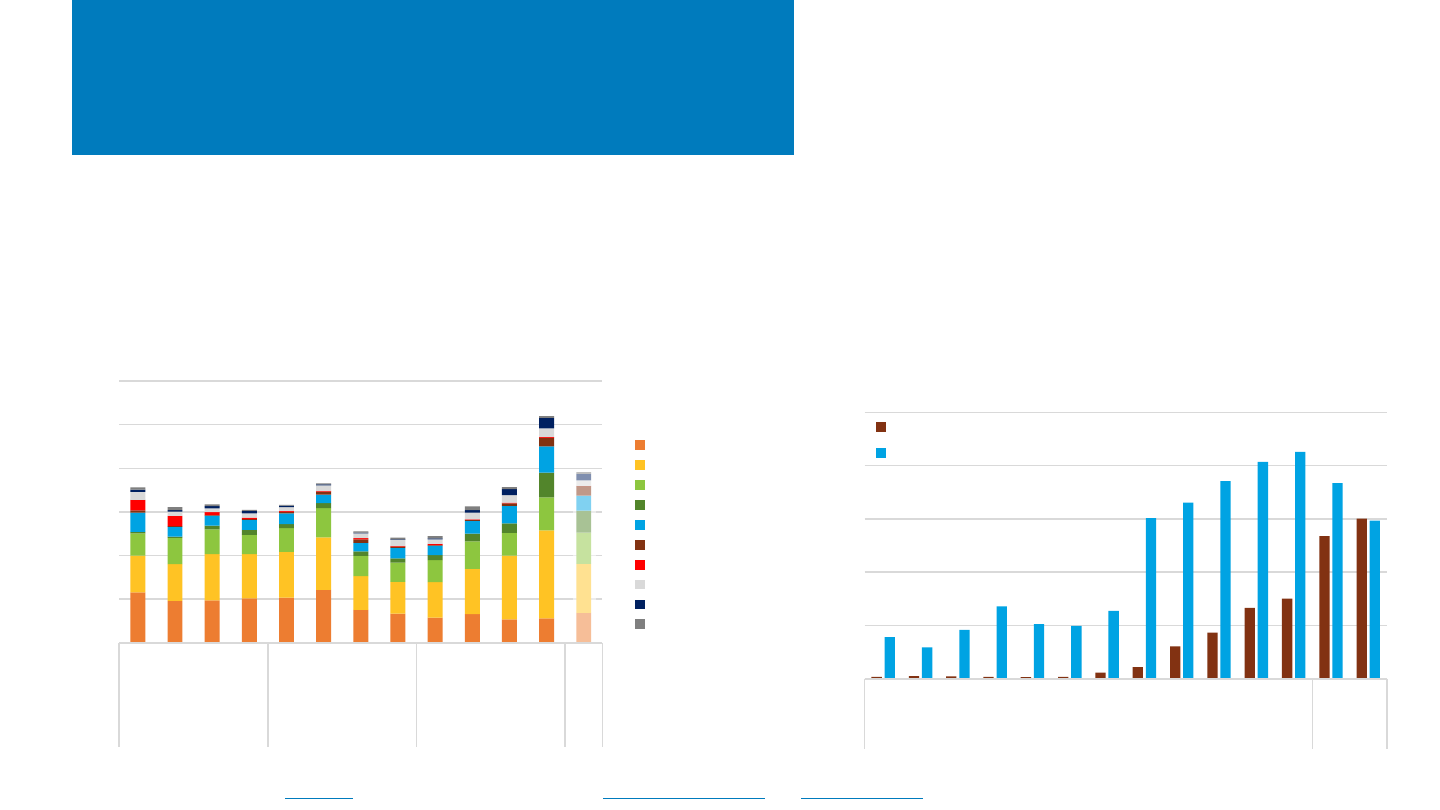
NREL | 81NREL | 81
U.S. Module Imports by Region
Sources: Imports by HTS code: 8541460015(2018-2021)/8541430010(2022-) and 8541460035(2018-2021)/8541430080(2022-), Second Quantity (watts) from the
U.S. International Trade Commission DataWeb as well as the U.S. Census Bureau USA Trade Online tool and corrections page as of 4/11/23.
Though Q1 2023 is not yet complete, it has already surpassed Q3
2022 imports.
– This has been mainly the result of imports from Vietnam, which
totaled nearly 2.2 GW (1.6 GW c-Si + 0.6 GW thin film) over January
and February.
Imports from India and South Korea grew significantly in 2022.
– India imported ~$500M worth of modules over last 8 months, a 25-
fold increase since July 2022. South Korean module imports nearly
tripled over the same period.
– Canada and Mexico also experienced an increase in imports starting
in mid-2022, accounting for nearly 5% of imports by value in Q4 2022.
0
2
4
6
8
10
12
Q1
Q2
Q3
Q4
Q1
Q2
Q3
Q4
Q1
Q2
Q3
Q4
Jan-Feb
2020 2021 2022 2023
Modules Imported (GW
dc
)
U.S. Module (c-Si + CdTe) Imports by Region
Malaysia
Vietnam
Thailand
Cambodia
South Korea
India
China
Rest of Asia
N. America
ROW
According to U.S. Census data, in Q4 2022, U.S. module imports continued
their upward trend (+46%, 3.25 GW
dc
q/q), totaling 28.7 GW
dc
in 2022 (+22%
y/y, +5 GW
dc
).
– As in Q2 and Q3, the Q4 increase was predominantly the result of increased
imports from Vietnam (+38% q/q, +1.1 GW).
0
50
100
150
200
250
JAN FEB MAR APR MAY JUN JUL AUG SEP OCT NOV DEC JAN FEB
2022 2023
Modules Imported (Millions USD)
India
South Korea
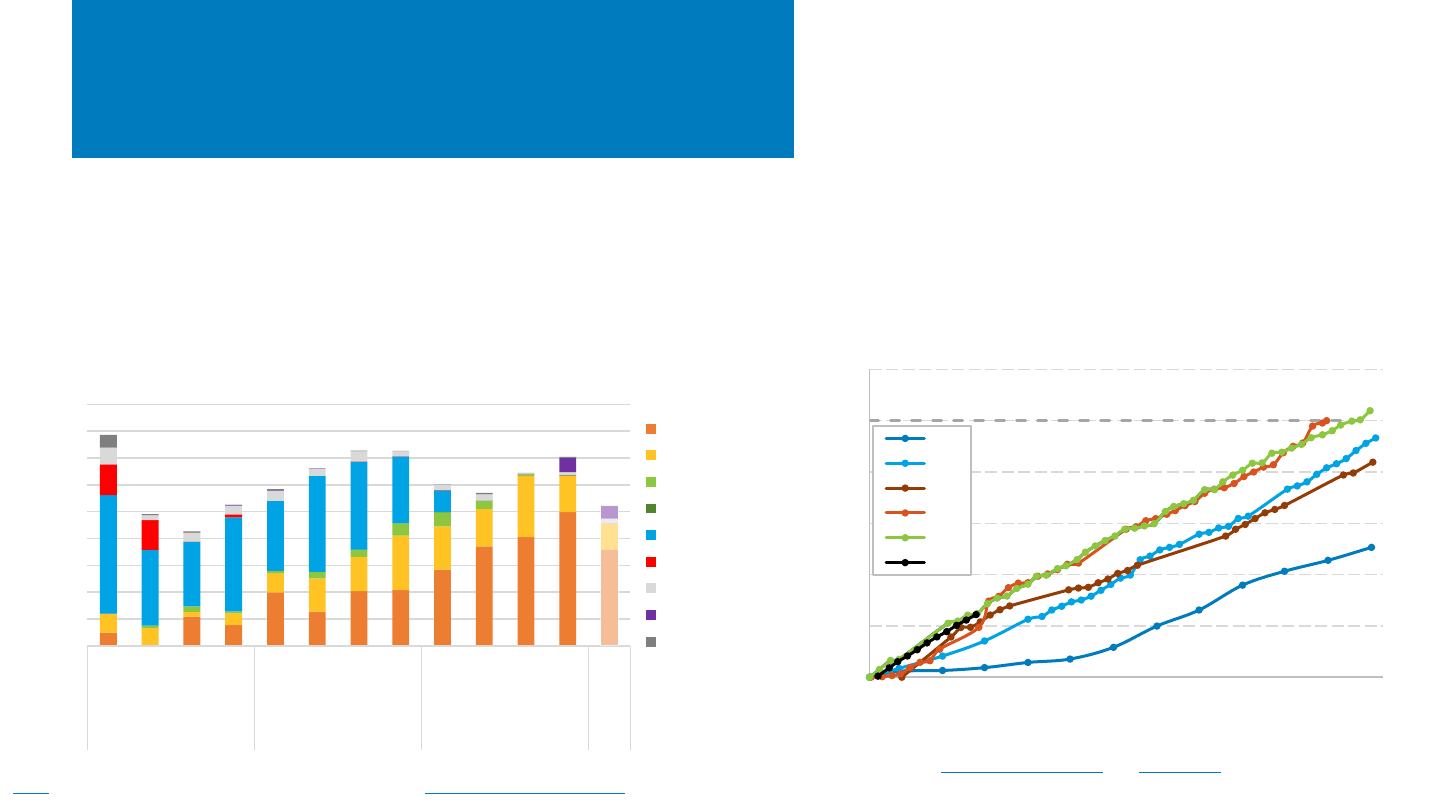
NREL | 82NREL | 82
0.00
0.50
1.00
1.50
2.00
2.50
3.00
7-Feb
9-Mar
8-Apr
9-May
8-Jun
9-Jul
8-Aug
8-Sep
8-Oct
8-Nov
8-Dec
7-Jan
7-Feb
PV Cells Imported Into U.S. (GW
dc
)
U.S. Cell Imports by Tariff Year
2018
2019
2020
2021
2022
2023
(previous) 2.5 GW
dc
PV Cell Import Quota Exemption
0.0
0.1
0.2
0.3
0.4
0.5
0.6
0.7
0.8
0.9
Q1
Q2
Q3
Q4
Q1
Q2
Q3
Q4
Q1
Q2
Q3
Q4
Jan-Feb
2020 2021 2022 2023
Imported c-Si Cells (GW
dc
)
U.S. Cell Imports by Region
Malaysia
Vietnam
Thailand
Cambodia
South Korea
China
Taiwan
Indonesia
ROW
c-Si Cell Import Data Q1-Q4 2022
According to U.S. Census data, 2.5 GW
dc
of cells were imported in 2022.
Quarterly cell imports grew for the second quarter in a row in Q4 2022 (+60
MW
dc
, +9% q/q).
– This growth was almost entirely the result of increased imports from Malaysia
(500 MW in Q4 alone), which have been ramping up since Q2 2021.
– Indonesia was also responsible for 7% of imports in Q4 2022 (52 MW).
Though only January and February data are available, imports in
Q1 2023 are on track to continue this growth.
Indeed, according to CBP Commodity Status Reports, cell imports
since February (the date the annual tariff rate quota for Section
201 Tariffs is counted from) are in-line with imports for the past
two years. This is seemingly despite the new c-Si module capacity
becoming operational in 2023.
Sources: Imports by HTS code: 8541460025(2018-2021)/8541420010(2022-), Second Quantity (watts) from U.S. Census Bureau USA Trade Online tool and corrections
page
as of 4/11/23; U.S. Customs and Border Protection Commodity Status Reports February 2019–April 2023.

NREL | 83NREL | 83
0.0
5.0
10.0
15.0
20.0
25.0
30.0
35.0
2019 2020 2021 2022
U.S. PV Module Imports (GW)
Thin-film Modules, Not subject to Section 201 c-Si Exempt from Section 201
Section 201 Dutiable, but No Duty Reported Section 201 Duty Reported
2022 U.S. Module
Imports by Tariff
In 2022, only 10% (2.7 GW
dc
) of modules reported a tariff,
compared to 56% (13.2 GW
dc
) in 2021.
• Most of the modules that did not were c-Si technology panels
exempt from Section 201 tariffs (18.8 GW
dc
, 65%) or thin-film and
not subject to tariffs (6.3 GW
dc
, 23%).
Over the course of 2022, c-Si modules went from reporting a
tariff 25% of the time in Q1 to 11% in Q4.
• The c-Si imports were likely bifacial panels, which the Biden
administration exempted from Section 201 duties in February 2022.
Thin-film modules accounted for 22% of module imports in
2022, up nearly 1.4 GW (+28% y/y) from 2021.
• CdTe panels are not subject to the various duties to which c-Si
modules are subject, and they do not have a supply chain in
locations currently scrutinized over the use of forced labor.
Notes: We assumed all modules not subject to Section 201 tariffs are reported under “Free under HS Chapters 1-98” or “Entered into U.S. Virgin Islands,” with exemptions coming from HTS code
85414030080. We assumed all panels subject to Section 201 duties are reported under “Dutiable- HS chapter 99.” Manual corrections were made to the following value due to suspected data
entry errors: HTS code 8541430010 Cambodia February 2022, HTS code 8541430080/8541430010 India July-December 2022.
Sources: Imports by HTS code: 8541460015(2018-2021)/8541430010(2022-) and 8541460035(2018-2021)/8541430080(2022-), Second Quantity (watts), and Rate Provision Code
from the U.S. International Trade Commission DataWeb
as well as the U.S. Census Bureau USA Trade Online tool and corrections page as of 4/11/23.

www.nrel.govwww.nrel.gov
Thank You
NREL/PR-7A40-86215
Special thanks to Nate Blair, Adam Warren, Liz Breazele and Samantha Wagstrom.
This work was authored [in part] by the National Renewable Energy Laboratory, operated by Alliance for
Sustainable Energy, LLC, for the U.S. Department of Energy (DOE) under Contract No. DE-AC36-08GO28308.
Funding provided by the U.S. Department of Energy Office of Energy Efficiency and Renewable Energy Solar
Energy Technologies Office. The views expressed in the article do not necessarily represent the views of the DOE
or the U.S. Government. The U.S. Government retains and the publisher, by accepting the article for publication,
acknowledges that the U.S. Government retains a nonexclusive, paid-up, irrevocable, worldwide license to publish
or reproduce the published form of this work, or allow others to do so, for U.S. Government purposes.

NREL | 85NREL | 85
List of Acronyms and Abbreviations
AD: antidumping
ac: alternating current
ASP: average selling price
BGS: B
oston Government Services, LLC
BIPV: building-integrated photovoltaics
c-Si: crystalline silicon
C&I: commercial and industrial
CC: combined cycle
CBP: U.S. Customs and Border Protection
CdTe: cadmium telluride
CIGS/CSI: copper indium gallium selenide
CPI: consumer price index
CPUC: California Public Utility Commission
CRA: Congressional Review Act
CSP: concentrating solar power
CT: combustion turbine
CVD: countervailing
dc: direct current
DPV: distributed photovoltaics
DOE: U.S. Department of Energy
EIA: U.S. Energy Information Administration
ETF: exchange traded fund
EU: European Union
GW: gigawatt
GWh: gigawatt-hour
H1: first half of year
H2: second half of year
HJT: heterojunction technology
HTS: harmonized tariff schedule
IEA: International Energy Agency
IOU: investor-owned utility
IRA: Inflation Reduction Act of 2022
IRS: Internal Revenue Service
IBC: interdigitated back contact
ITC: investment tax credit
kW: kilowatt
kWh: kilowatt-hour
LBNL: Lawrence Berkeley National Laboratory
MPTC: manufacturing production tax credit
MW: megawatt
MWh: megawatt-hour
NEM: net energy metering
NREL: National Renewable Energy Laboratory
PERC: passivated emitter and rear contact
PPA: power purchase agreement
PTC: production tax credit
PV: photovoltaics
Q: quarter
q/q: quarter over quarter
SEIA: Solar Energy Industries Association
SETO: Solar Energy Technology Office
TAN: Invesco Solar ETF
TOPCon: tunnel oxide passivated contact
TW: terawatt
TWh: terawatt-hour
UAE: United Arab Emirites
UFLPA: Uyghur Forced Labor Prevention Act
UPV: utility-scale photovoltaics
USD: U.S. dollars
VPP: virtual power plant
W: watt
Wt avg: weighted average
y/y: year over year
YTD: year to date
NREL | 86NREL | 86
List of Manufacturing Announcements (page 1)
Nextracker & Atkore Commission Manufacturing Line In Arizona | TaiyangNews
Steel Fab Reopens In US For Nextracker | TaiyangNews
CHERP Builds First Nonprofit Solar Panel Factory | The Claremont COURIER (claremont
-courier.com)
Convalt sets ambitious production goals at Watertown site | Business (nny360.com)
Convalt Energy Receives Bridge Gap Loan from JCIDA for Hounsfield Project | Business (nny360.com)
US Solar Backsheet Maker Expanding Capacity | TaiyangNews
Enphase Energy To Open Manufacturing Lines In US | TaiyangNews
First Solar To Invest Up to $1.2 Billion in Expanding U.S. Solar Manufacturing by 4.4 GW | pv magazine USA (pv
-magazine-usa.com)
Expanding Before Opening 2nd First Solar Plant in Lake Twp. Gets OK to be Bigger | News | sent
-trib.com
Fuyao Glass To Expand Production Capacity In The US | TaiyangNews
GAF Energy Breaks Ground on Texas Solar Roofing Plant | pv magazine USA (pv
-magazine-usa.com)
USA: 6 GW Solar Tracker Manufacturing Fab Planned | TaiyangNews
Hanwha To Produce Module Encapsulants in US | TaiyangNews
Hanwha Q Cells to Build US Solar Module Factory, Expand Cell Capacity in South Korea | pv magazine International (pv
-magazine.com)
https://www.pv
-tech.org/heliene-president-opens-up-on-us-manufacturing-plans-post-ira/
Canada's Heliene opening Its Second U.S. Solar Panel Factory | Reuters
Heliene Boosts U.S. Solar Supply Chain with Expansion of Minnesota Facility (renewableenergyworld.com)
Ice Industries Invests in New Ohio Facility to Serve America’s Largest Solar Manufacturer | Ice Industries
New JM Steel manufacturing plant will have a Nextracker tracker production line
– pv magazine USA (pv-magazine-usa.com)
https://www.solarpowerworldonline.com/2022/03/maxeon
-still-has-sights-set-on-u-s-solar-manufacturing-hub/
OCI To Invest $40 Million to Expand US Solar Module Production Facilities | KED Global
Mitrex to Build N.Y. Solar Product Manufacturing Facility | SBIZ • Sustainable Biz Canada
Gov. Kemp: Solar Tech Company NanoPV to Open Manufacturing, Distribution Operations in Sumter County, Create Over 500 Jobs |
Governor Brian P. Kemp Office of the Governor (georgia.gov)
NREL | 87NREL | 87
List of Manufacturing Announcements (page 2)
Philadelphia Solar Announces 1 GW PV Panel Manufacturing Facility Investment Plan in U.S. (enfsolar.com)
PV Hardware Plans 6GW Solar Tracker Manufacturing Factory in Texas: PV Tech (pv
-tech.org)
REC Silicon Signs Second Supply Agreement for U.S. Metal
-Grade Silicon (solarpowerworldonline.com)
Reliance Industries Acquires REC Group, Plans 1 GW U.S. Module Facility | pv magazine USA (pv
-magazine-usa.com)
New N
-Type TOPCon Solar Module Fab in Texas, US | TaiyangNews
Silfab Plans to Start Solar Cell Manufacturing in the United States, but Commerce investigation Has Halted Progress
(solarpowerworldonline.com)
Silfab Solar Doubles US Solar Panel Manufacturing Capacity | Press, SILFAB SOLAR
SPI Energy Will Start 1.5
-GW Silicon Wafer Manufacturing Site Stateside by 2023 (solarpowerworldonline.com)
SPI Energy Accelerates Growth of Solar Module Manufacturing Capacity to Meet Strong Demand (yahoo.com)
Sun Pacific to Develop a U.S. Solar Panel Manufacturing Facility | ROI
-NJ
Toledo Solar To Expand US Manufacturing Capacity | TaiyangNews
Governor Hochul Announces Plans for Ubiquity Solar to Establish U.S. Manufacturing Operations at Former IBM Huron Campus in
Broome County | Governor Kathy Hochul (ny.gov)
Biden’s Climate Push Lures Indian Firm to Make Panels in US (bloombergtax.com)
Enel Intends to Build Solar Panel Manufacturing Facility in the US (enelnorthamerica.com)
Canadian Solar Inc. (CSIQ) Q3 2022 Earnings Call Transcript | Seeking Alpha
New Solar Panel Manufacturer To Set Up in Georgia with 500-MW Facility (solarpowerworldonline.com)
CubicPV Announces Plans To Build Silicon Wafer Facility in the United States | CubicPV
Korean Solar Company Plans To Build $2.5 Billion Plant in Georgia | The New York Times (nytimes.com)
JA Solar plans To Build 2 GW Solar Module Factory in US | pv magazine International (pv-magazine.com)

NREL | 88NREL | 88
List of Manufacturing Announcements (page 3)
FTC Solar, Taihua set up US-based JV to produce steel components (pv-tech.org)
This US solar company is about to ramp up flexible thin-film solar (electrek.co)
Ascent Solar - Ascent Solar Technologies, Inc. Announces First Step of Strategic Plan; Executes Term Sheet for Acquisition of As
sets
From Leading European Thin-Film Solar Manufacturer
Hounen Solar establishing first U.S. manufacturing operations in Orangeburg County | S.C. Governor Henry McMaster (sc.gov)
Another Chinese Company To Start PV Module Production in US | TaiyangNews
The factory comes as Ohio ramps up solar farm construction (dispatch.com)
Linton Crystal Technologies to produce solar ingot, wafer equipment in United States | Solar Builder (solarbuildermag.com)
India’s Rayzon Solar to make TOPCon modules in US – PV magazine International (pv-magazine.com)
Silfab Solar to Execute First Phase of USA Cell Manufacturing
Solarcycle bags US$30 million to expand capacity (pv-tech.org)
Vitro Enters Agreement with First Solar to Manufacture Glass for Solar Panels - USGlass Magazine & USGNN Headline News
