
U.S. DEPARTMENT OF ENERGY
Revolution…Now
The Future Arrives for Five Clean Energy
Technologies – 2015 Update
November 2015
ii
Contributors
Luke Bassett, DOE Office of Energy Policy & Systems Analysis and Office of
Energy Efficiency & Renewable Energy
James Brodrick, DOE Building Technologies Office
Steve Capanna, DOE Office of Energy Efficiency & Renewable Energy
Jonathan Castellano, DOE Vehicle Technologies Office
Christy Cooper, DOE Vehicle Technologies Office
Paul Donohoo-Vallett, DOE Office of Energy Efficiency & Renewable Energy
David Feldman, National Renewable Energy Laboratory
Roland Gravel, DOE Vehicle Technologies Office
Jason Hartke, DOE Building Technologies Office
David Howell, DOE Vehicle Technologies Office
Amy Jiron, DOE Building Technologies Office
Tarak Shah, DOE Office of the Under Secretary for Science and Energy
Gurpreet Singh, DOE Vehicle Technologies Office
Carol Schutte, DOE Vehicle Technologies Office
Rich Tusing, DOE Wind Technology Office
Jacob Ward, DOE Vehicle Technologies Office
Disclaimer: any mention of a specific company is not meant to imply an endorsement on the part of the U.S.
Department of Energy or U.S. Government.
iii
Contents
Expanding Scope ........................................................................................................................................ 1
Land-Based Wind Power ............................................................................................................................ 3
Big Fans of Wind Power ........................................................................................................................ 3
Wind in the Sales .................................................................................................................................... 4
Growing Up ............................................................................................................................................ 4
Solar PV: Utility-Scale ................................................................................................................................. 6
Stepping Out of the Shade ...................................................................................................................... 6
59% Cheaper .......................................................................................................................................... 6
How Low Can You Go? ......................................................................................................................... 7
A Solar Flare of Activity ........................................................................................................................ 8
Solar PV: Distributed Generation .............................................................................................................. 9
Raise the Roof(top) ................................................................................................................................ 9
Soft Costs ............................................................................................................................................... 9
A Capital Idea ....................................................................................................................................... 10
Forecast: Sunny .................................................................................................................................... 10
LED Lighting .............................................................................................................................................. 11
Turning Up the Lights .......................................................................................................................... 11
Beyond the Bulb ................................................................................................................................... 12
A Bright Future .................................................................................................................................... 12
Electric Vehicles ........................................................................................................................................ 14
Putting it into High Gear ...................................................................................................................... 14
Charging Ahead with Batteries ............................................................................................................ 15
Road to the Future................................................................................................................................. 15
Revolution Next ......................................................................................................................................... 17
Sweet Suite of Smart Building Technologies ................................
....................................................... 18
Freight Trucks That Can Keep on Trucking ......................................................................................... 19
Vehicle Lightweighting: Lighten the Load and Hit the Road .............................................................. 20
Conclusion ................................................................................................................................................. 21
1

2
Expanding Scope
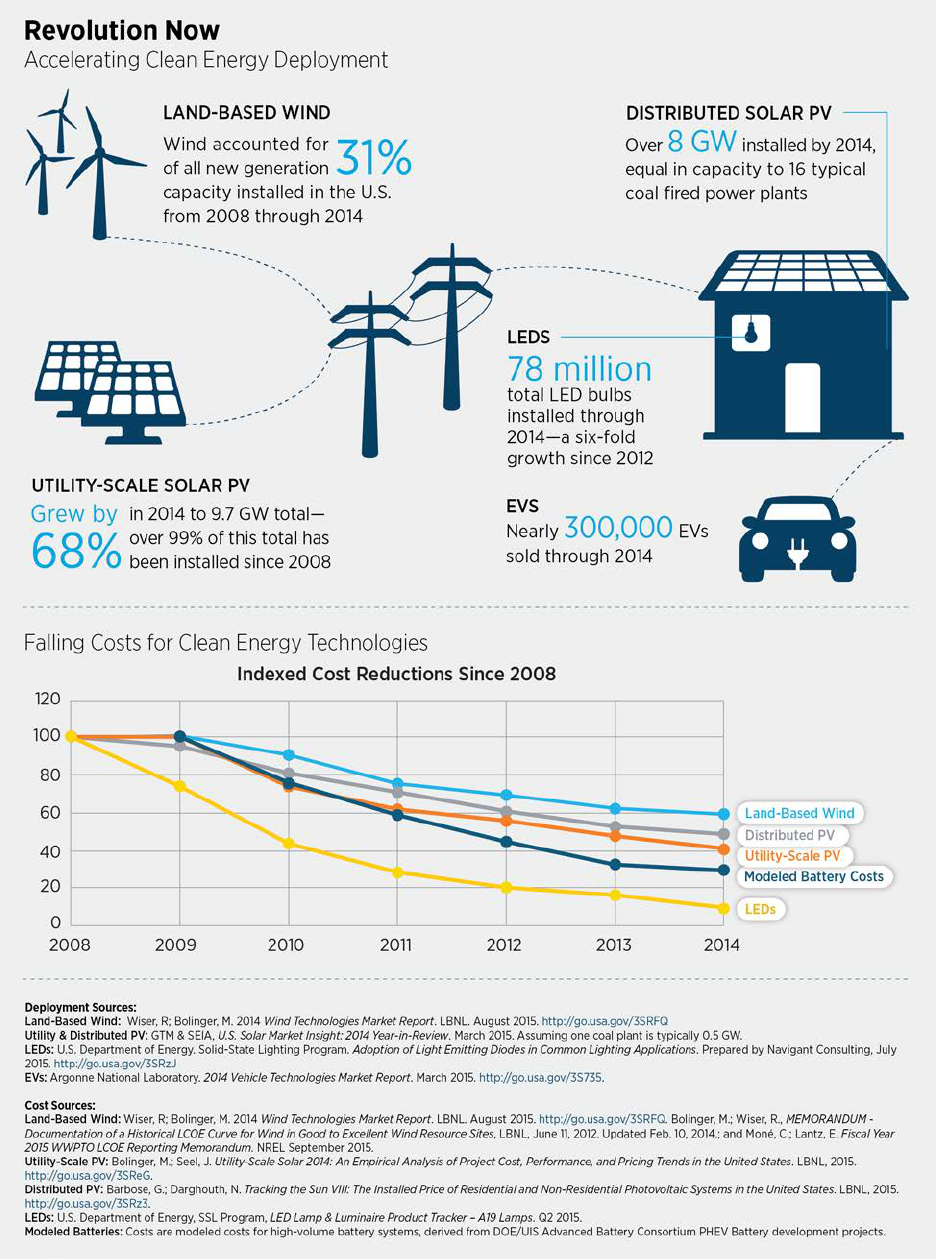
For decades, America has anticipated the transformational impact of clean energy technologies.
As the federal government and industry made long-term investments to support those
technologies, some critics became impatient, claiming a clean energy future would “always be
five years away.”
Today, the clean energy future has arrived.
In 2013, the U.S. Department of Energy (DOE) released the Revolution Now report, highlighting
four transformational technologies: land-based wind power, silicon photovoltaic (PV) solar
modules, light-emitting diodes (LEDs), and electric vehicles (EVs). That study and its 2014
update showed how dramatic reductions in cost are driving a surge in consumer, industrial, and
commercial adoption for these clean energy technologies—as well as yearly progress.
In addition to presenting the continued progress made over the last year in these areas, this year’s
update goes further. Two separate sections now cover large, central, utility-scale PV plants and
smaller, rooftop, distributed PV systems to highlight how both have achieved significant
deployment nationwide, and have done so through different innovations, such as easier access to
capital for utility-scale PV and reductions of non-hardware costs and third-party ownership for
distributed PV.
Along with these core technologies, this update briefly introduces three additional technologies
on the cusp of wider deployment and cost reduction in the coming years: smart building systems,
fuel-efficient freight trucks, and vehicle lightweighting.
Today, clean energy technologies are providing real-world solutions—not only do they reduce
the carbon pollution that causes climate change, but they also drive a domestic energy economy
with technologies that are increasingly cost-competitive with existing conventional technologies,
even without accounting for the climate benefits. Clean energy manufacturing and installations
have also become major opportunities for American workers in the 21
st
century.
Even though we are seeing the results of the enormous progress these technologies have
achieved, there is still more that can be accomplished. DOE’s recent Quadrennial Technology
Review identified hundreds of clean energy research and innovation opportunities in our homes,
businesses, cars and trucks, and in the power sector, that with sustained investment will provide
real-world solutions to our energy challenges.
1
With the continued progress of the core technologies in this report, and more innovations on the
horizon, the clean energy revolution is clearly transforming the way we produce and use energy.
1
Found at http://energy.gov/qtr.
3
Land-Based Wind Power
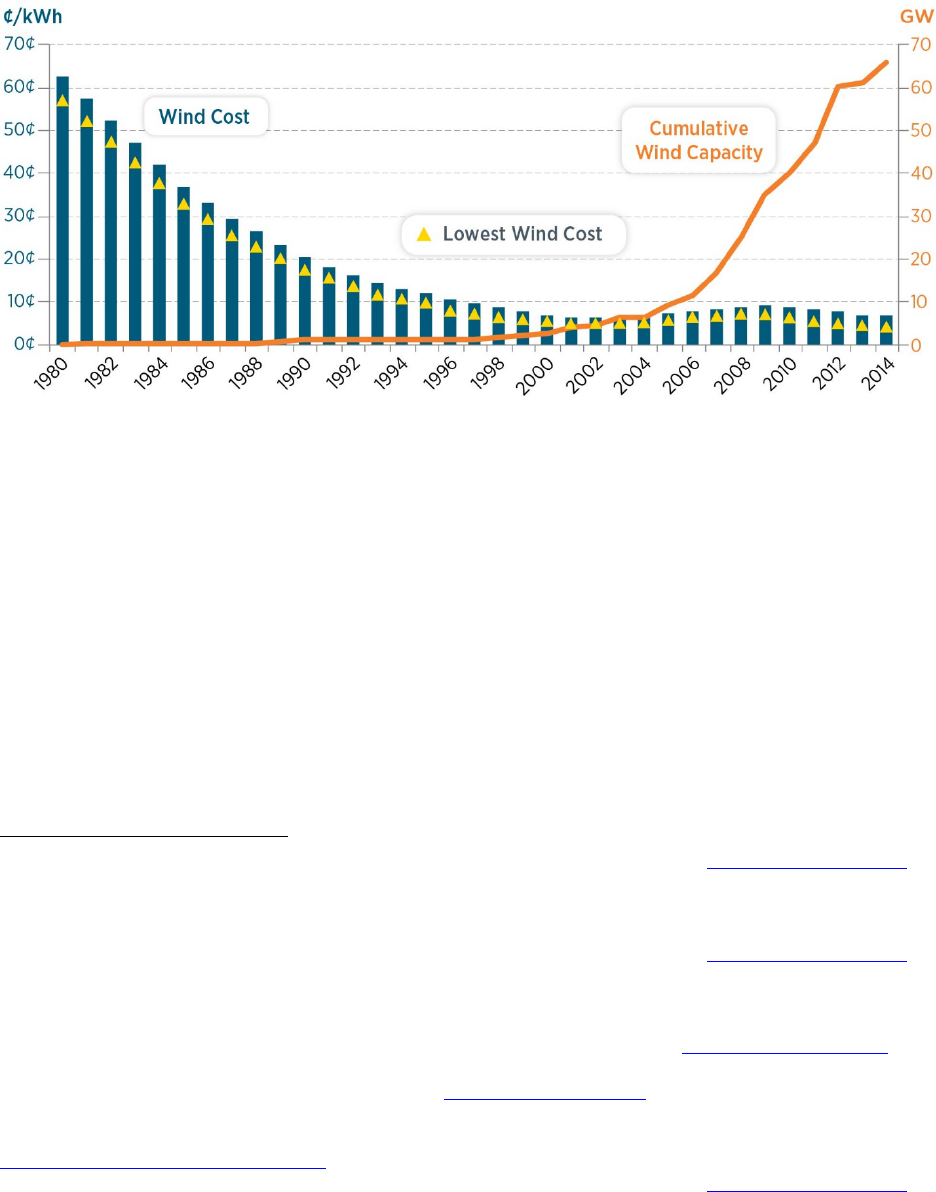
Notes: 1 gigawatt (GW) = 1,000 megawatts (MW). All costs shown are inflation adjusted to dollar year 2014 and
exclude the production tax credit (PTC). Wind capacity as reported by market reports.
2
“Wind Cost” represents
estimated levelized cost of energy from a representative wind site, and “Lowest Wind Cost” represents costs derived
from power purchase agreements from good to excellent wind resource sites in the interior of the country.
3
Big Fans of Wind Power
Wind power is firmly entrenched as a mainstream power source: between 2008 and 2014, wind
power accounted for 31% of all new generation capacity added in the United States.
4
As of 2014,
there were more than 65,000 megawatts (MW) of utility-scale wind power deployed across 39
states
5
—enough to generate electricity for more than 16 million households
6
—with another
13,600 MW under construction as of the first quarter of 2015.
7
Wind now provides 4.4% of total
U.S. electricity generation, 23 states have at least 500 MW of wind installed, and in nine states,
wind exceeds 10% of total in-state electricity generation.
8,9
This ramp up in generation has
yielded enormous benefits: wind power in the United States in 2013 reduced annual carbon
dioxide emissions by more than 115 million metric tons and reduced water consumption by more
2
Wiser, R; Bolinger, M. 2014 Wind Technologies Market Report. LBNL. August 2015. http://go.usa.gov/3SRFQ.
3
Ibid; Bolinger, M.; Wiser, R., MEMORANDUM - Documentation of a Historical LCOE Curve for Wind in Good to
Excellent Wind Resource Sites, LBNL, June 11, 2012. Updated Feb. 10, 2014.; and Moné, C.; Lantz, E. Fiscal Year
2015 WWPTO LCOE Reporting Memorandum. NREL September 2015.
4
Wiser, R; Bolinger, M. 2014 Wind Technologies Market Report. LBNL. August 2015. http://go.usa.gov/3SRFQ.
Note that this report has an error and incorrectly states this number as 33%.
5
Ibid.
6
Wind generated 181,791 GWh in 2014 (Energy Information Administration, Electric Power Monthly, “Table
1.1.A. Net Generation from Renewable Sources: Total (All Sectors).” October 2015. http://go.usa.gov/cYAZm
). The
average American household consumed 10,932 kWh in 2014 (Energy Information Administration. How much
electricity does an American home use? October 2015.
http://go.usa.gov/cYAKh).
7
American Wind Energy Association. AWEA U.S. Wind Industry First Quarter 2015 Market Report. April 2015.
8
Energy Information Administration. Electric Power Monthly – Detailed State Data.
http://www.eia.gov/electricity/data/state/
. Accessed October 2015.
9
Wiser, R; Bolinger, M. 2014 Wind Technologies Market Report. LBNL, August 2015. http://go.usa.gov/3SRFQ.

4
than 36 billion gallons, all while supporting more than 50,000 U.S. manufacturing, construction,
and wind operations jobs.
10
Wind in the Sales
This success has been enabled in part due to recent reductions in the cost of wind power as U.S.
wind power prices have reached an all-time low. Power purchase agreements for wind have
fallen from rates up to 7 cents/kilowatt-hour (kWh) in 2009 to an average of 2.4 cents/kWh in
2014.
11
This low-cost wind power arises from projects installed in excellent resource locations in
the central part of the country and is reflective in part of the federal production tax credit (PTC).
This significant reduction in cost in only five years is a result of multiple factors. First, DOE’s
sustained investment in improving wind technology, with $2.4 billion dollars invested in wind
research and development between 1976 and 2014, has honed the technology and enabled many
key improvements such as the taller turbines and longer blades highlighted below.
12
Additionally, new transmission projects, such as those in the recently completed Texas
Competitive Renewable Energy Zone transmission build-out, have enabled wind development in
more areas of the country. Recent expanded coordination among grid operators has increased the
ability of the grid to accept higher levels of wind generation while reducing curtailment.
13
State
renewable portfolio standards and federal PTC policies have assisted deployment of continued
investment in U.S. wind manufacturing.
Together, these investments, infrastructure projects, and policies have made wind a low-cost,
zero-carbon alternative that contributes to the transformation of the U.S. electricity generation
portfolio.
Growing Up
Continued innovation in next generation wind technologies could soon enable cost-competitive
wind potential nationwide. One of the biggest changes in recent years is that wind turbines
themselves are getting bigger: a wind turbine installed today on average has 108% longer blades
and is 48% taller than one installed in 1999.
14
Taller turbines and longer blades allow access to
the stronger and more consistent wind speeds that occur at higher altitudes, produce more
electricity per tower thus minimizing the land area needed, and enable more cost-effective wind
power. DOE estimates that the continued development of taller wind towers coupled with larger
rotors and advanced turbine designs would grow wind’s potential electrical output by 67% above
10
U.S. Department of Energy. “Chapter 2 – Wind Power in the United States.” Wind Vision. March 2015.
http://go.usa.gov/crxhR
.
11
Wiser, R; Bolinger, M. 2014 Wind Technologies Market Report. LBNL. August 2015. http://go.usa.gov/3SRFQ.
Note that these prices include the effect of the federal PTC and as such are lower than what is displayed in the chart
above.
12
Inflation adjusted to 2014 dollars using U.S. Bureau of Economic Analysis GDP budget deflator. 1978-2008:
Pelsoci, T.; Retrospective Benefit-Cost Evaluation of U.S. DOE Wind Energy R&D Program. June 2010.
http://go.usa.gov/3SRFY
. 2009-2014: DOE Office of Energy Efficiency and Renewable Energy budget justification
documents at http://go.usa.gov/3SRMx.
13
Wiser, R; Bolinger, M. 2014 Wind Technologies Market Report. LBNL. August 2015. http://go.usa.gov/3SRFQ.
14
Ibid.

5
the wind technologies currently deployed, opening up an additional 700,000 square miles—or
about one-fifth of the United States—for wind development.
15
This expansion of potential wind
generation also occurs in much of the Southeastern portion of the country, an area that has
historically not seen significant wind development.
In addition to these technological innovations, investments in supercomputing power are further
optimizing whole wind plants and unlocking future cost reductions and efficiency improvements.
Advanced computational modeling of the complex wind interactions across turbines coupled
with improved sensing, advanced controls, and wind forecasting will increase efficiency and
reliability to create the next generation of wind power technologies.
In many parts of the country, wind power is already becoming a cost-effective low carbon
solution that supports U.S. jobs in manufacturing and construction—but wind still has large
additional untapped potential, as shown in a recent DOE report which outlined how wind could
generate 20% of the nation’s electricity by 2030.
16
With ongoing technological innovation,
transmission expansion, and continued federal and state support, wind can continue to grow and
unlock its wide array of benefits in all 50 states.
15
U.S. Department of Energy. Enabling Wind Power Nationwide. May 2015. http://go.usa.gov/3SRMj.
16
U.S. Department of Energy. Wind Vision. March 2015. http://energy.gov/eere/wind/wind-vision.
6
Solar PV: Utility-Scale
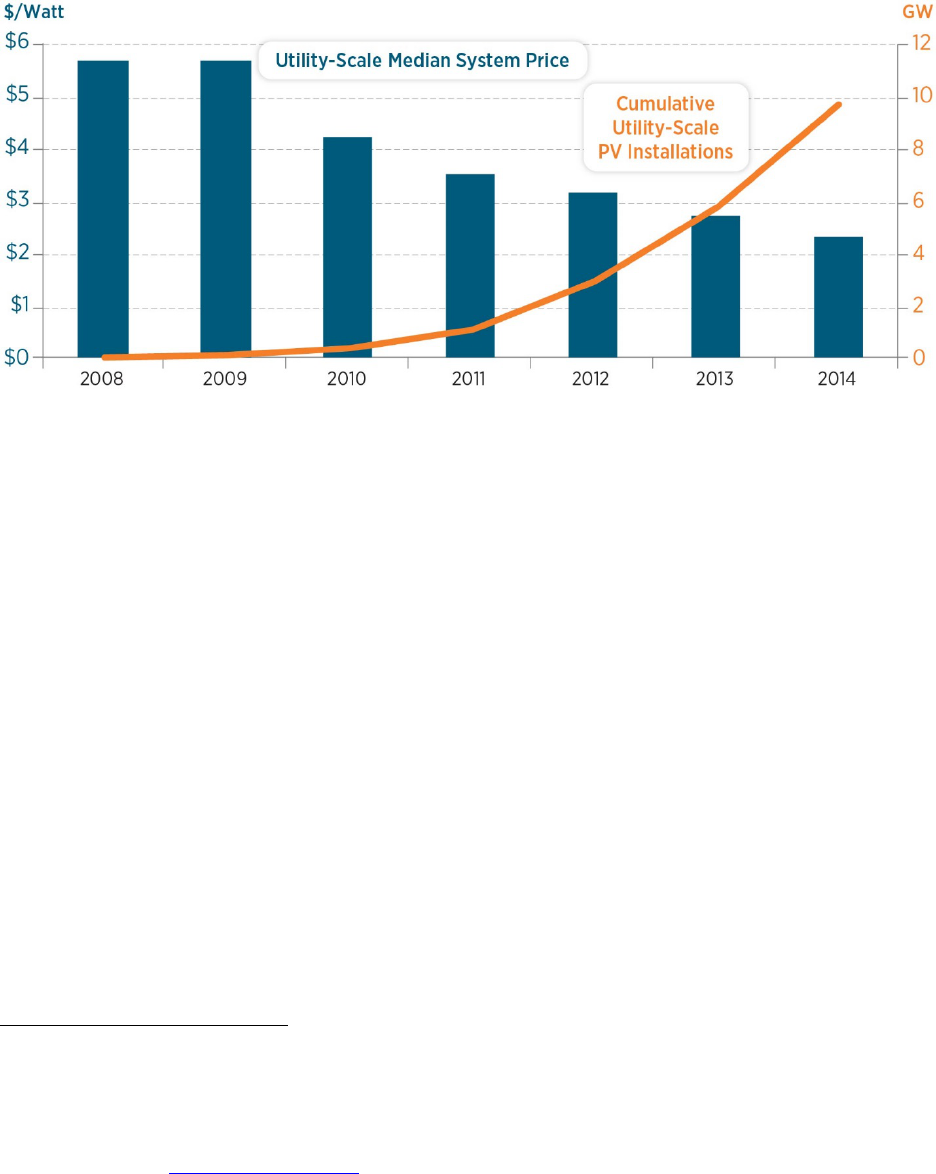
Notes: All prices are in $/W
DC
and inflation adjusted to dollar year 2014. 1 gigawatt (GW) = 1,000 megawatts (MW).
Prices as reported in market report.
17
“Utility-scale” cumulative installations as reported in source in GW
DC
.
18
Stepping Out of the Shade
Although the energy potential of the sun is limitless for practical purposes, the cost of converting
that energy into usable electricity has long kept solar PV out of reach for all but a few niche
applications. However, over the last several years, thanks to cost declines and technological
advances, solar PV went from a novelty to a large-scale generation source purchased by electric
utilities to meet demand.
Utility-scale PV has rapidly emerged as a mainstream technology over the last few years. By
2014, the total capacity of large utility-scale solar PV reached 9.7 GW with over 99% of these
installations occurring after 2008.
19
This trend has continued with 15% of all electric generating
capacity brought online from January to September 2015 arising from utility-scale PV
.
20
59% Cheaper
This large deployment is a result of the dramatic decline in the price of PV systems. Between
2008 and 2014, the cost for a PV module declined from $3.57/watt (W) to about $0.71/W.
21
Total cost declines mirrored this hardware cost reduction due to improvements in installation and
business practices: the total cost of utility-scale PV systems fell from $5.70/W in 2008 to
17
Bolinger, M.; Seel, J. Utility
‐
Scale Solar 2014: An Empirical Analysis of Project Cost, Performance, and Pricing
Trends in the United States. LBNL, September 2015. http://go.usa.gov/cYAp4.
18
GTM & SEIA, U.S. Solar Market Insight: 2014 Year-in-Review. March 2015.
19
Ibid.
20
Federal Energy Regulatory Commission, Office of Energy Projects, Energy Infrastructure Update for September
2015. October 2015. http://go.usa.gov/craZB
.
21
Mints, P., Photovoltaic Manufacturer Shipments: Capacity, Price & Revenues 2014/2015. SPV Market Research.
April 2015.

7
$2.34/W in 2014—a decrease of 59%.
22
This means solar is increasingly reaching cost parity
with traditional electrical generation from natural gas and coal in parts of the United States.
A combination of DOE, federal, state, and industry actions helped achieve this drastic cost
reduction in a short period of time. DOE’s $4.1 billion investment in PV technology research and
development (R&D) from 1975 through 2008 accelerated the cost reduction progress by an
estimated 12 years, while providing a net economic benefit of $16.5 billion.
23
The federal
Investment Tax Credit (ITC) along with state renewable portfolio standards and other state and
local incentives for PV in the United States—as well as the European Union members, Japan,
China, and other countries—have also effected solar deployment, further reducing manufacturing
costs.
How Low Can You Go?
In 2014 and 2015, several PV system installers won power purchase contracts over traditional
sources of generation and signed power purchase agreements with utilities to provide electricity
at a cost between 4 to 5 cents/kWh. These are not just simple one-off projects with unusually
good economics; utilities have on multiple occasions received proposed projects in this price
range with aggregate capacity of more than 10 times the capacity requested.
24
Even though those
prices are enabled by the federal tax credit, they represent a price offering that would have
seemed shockingly low just a few years ago.
The utility-scale PV industry was, in part, kick-started by DOE’s Loan Programs Office (LPO).
Through funding provided by the Recovery and Reinvestment Act of 2009, the LPO financed the
first five utility-scale solar PV projects over 100 MW in the United States with more than 1,500
MW of total capacity. Today, utility-scale solar is being financed by the private sector at
increasing scale. As of summer 2015, there were 21 privately financed utility-scale solar PV
projects over 100 MW either built or under construction.
25,26
These low prices are also a result of new types of financial instruments specifically for clean
energy projects like utility-scale solar PV, which provide a low cost source of capital. For
example, as of mid-2015, six specially structured publicly traded companies had financed
approximately 4,500 MW of solar, offering dividend yields between 3% and 7%.
27
As a
testament to solar’s technological progress, enormous potential, and overall maturity of the
industry, large financial institutions now view utility-scale solar PV as an attractive investment.
22
Bolinger, M.; Seel, J. Utility
‐
Scale Solar 2014: An Empirical Analysis of Project Cost, Performance, and Pricing
Trends in the United States. LBNL, September 2015. http://go.usa.gov/cYAp4.
23
“Retrospective Benefit-Cost Evaluation of DOE Investment in Photovoltaic Energy Systems.” DOE, August
2010. http://go.usa.gov/3SRMh
. Inflation adjusted to 2014 dollars using U.S. Bureau of Economic Analysis GDP
budget deflator.
24
Bolinger, M.; Seel, J. Utility
‐
Scale Solar 2014: An Empirical Analysis of Project Cost, Performance, and Pricing
Trends in the United States. LBNL, September 2015. http://go.usa.gov/cYAp4.
25
U.S. Department of Energy, Loan Programs Office. Powering New Markets: Utility-Scale Photovoltaic Solar.
February 2015. http://go.usa.gov/3SRez
.
26
SEIA. “Major Solar Projects in the United States: Operating, Under Construction, or Under Development.”
Updated Aug. 20, 2015.
27
Based on internal NREL analysis of the market and yieldco investor presentations from the first half of 2015.

8
A Solar Flare of Activity
As of mid-2015, there were more than 27,000 MW of utility-scale solar projects under
development, with 3,600 MW already under construction.
28
Even if only a portion of these
projects are built, it will easily double existing capacity over the next few years. This large
pipeline of planned projects is partially due to the pending expiration of the ITC at the end of
2016, which has allowed the industry to flourish by providing clear, long-term policy certainty.
29
So, as with wind, sustained federal and state support can help continue this rapid pace of utility-
scale solar deployment beyond the next few years.
In the longer term, the potential for solar to eventually provide a much larger share of our
electricity portfolio is dramatic: enough solar resource and land area is available for utility-scale
PV to generate over 69 times the electricity needs of the nation.
30
With the help of additional
investments and innovations in inverters, electricity storage, advanced materials, and new
electricity market structures, more of this potential of clean energy could be unlocked.
31
The
recent burst of activity in this sector has exceeded expectations, but for the future of utility-scale
PV the sky really is the limit.
28
SEIA. Major Solar Projects in the United States: Operating, Under Construction, or Under Development.
Updated Aug. 20, 2015.
29
Deutsche Bank Group, Paying for Renewable Energy: TLC at the Right Price. DB Climate Change Advisors.
December 2009.
30
Utility PV technical potential 282,800 TWh (Lopez, A; Roberts, B.; Heimiller, D.; Blair, N.; and Porro, G; U.S.
Renewable Energy Technical Potentials: A GIS-Based Analysis. NREL. July 2012. http://go.usa.gov/3SRtC
). Total
2014 U.S. electricity generation 4,093 TWh (Energy Information Administration, Electric Power Monthly, “Table
1.1. Net Generation by Energy Source: Total (All Sectors),” October 2015.
http://go.usa.gov/cYF5P).
31
U.S. Department of Energy. Quadrennial Technology Review. Chapter 4, “Advancing Clean Electric Power
Technologies,” September 2015. http://energy.gov/qtr
.
9
Solar PV: Distributed Generation
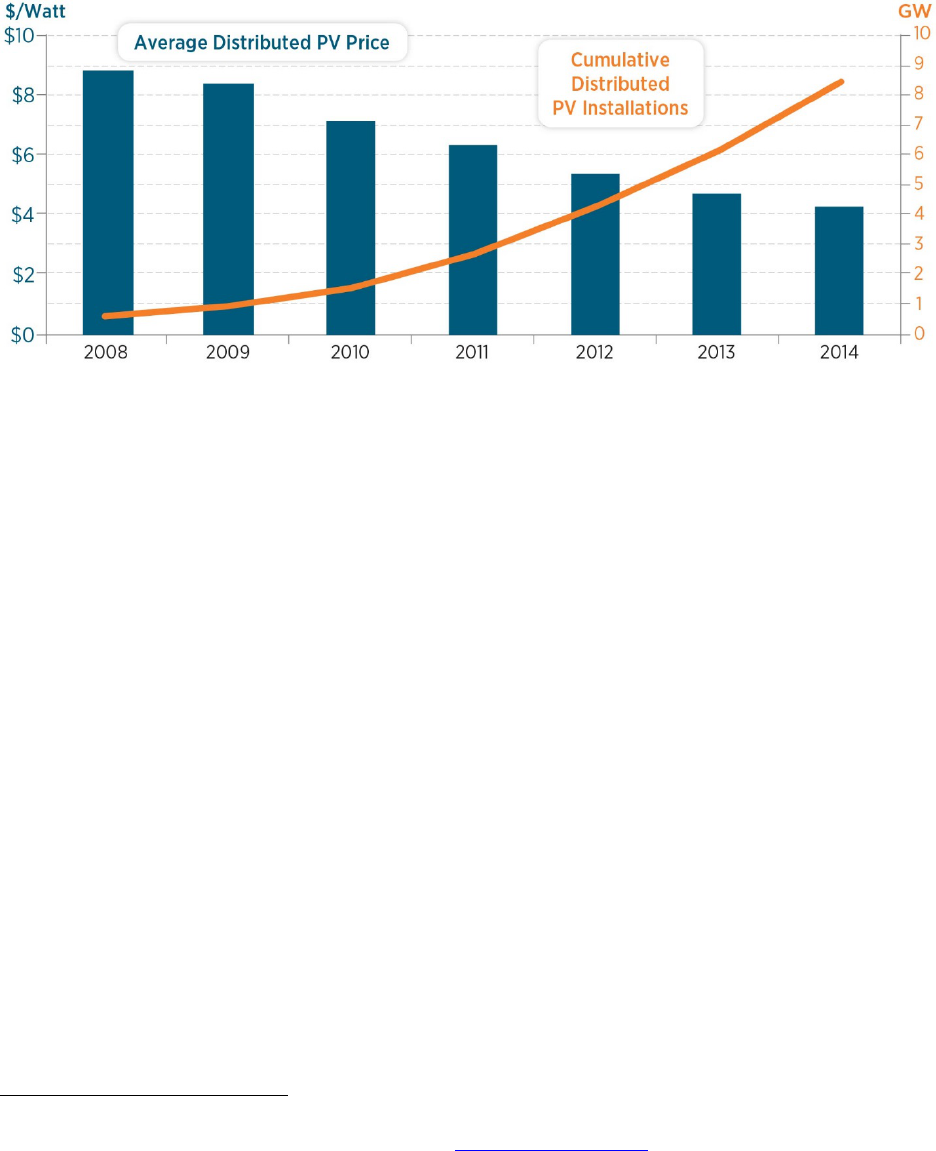
Notes: All prices are in $/W
DC
and inflation adjusted to dollar year 2014. 1 gigawatt (GW) = 1,000 megawatts (MW).
Capacity weighted average as reported by market report for residential systems only.
32
Non-residential systems are
typically larger and have lower reported prices. Capacity is cumulative distributed residential and non-residential
capacity, in GW
DC
.
33
Raise the Roof(top)
Distributed PV systems use the same basic PV technology as larger utility-scale projects, but
they differ in one key aspect: they are located where the electricity is used. These systems are
often on individual consumers’ rooftops and are frequently not owned by a power company. This
is unlike the vast majority of electricity generation facilities, where a power company generates
electricity at a central plant and then sends it to consumers via the electric grid.
Although distributed PV technology has been available for years, falling prices over the last
decade have unlocked its potential not only for the average homeowner but also for larger
consumers like businesses and schools. Many installations are small enough to fit on a roof, but
there is nothing tiny about distributed PV’s growth. As of the summer of 2015, there have been
nearly 800,000 cumulative distributed PV installations. This represents almost 10,000 MW in
capacity, which is nearly equal to the capacity of utility-scale installations.
34
Soft Costs
The cost of solar energy system hardware (i.e., panels, inverters, etc.) has dropped significantly,
but the non-hardware “soft” costs of solar—such as permitting, installation, interconnection, and
maintenance fees—remain a major barrier to greater deployment nationwide and can account for
up to 68% of total system costs.
35
To address this problem, DOE launched the Rooftop Solar
Challenge in 2011 to slash red tape and make installing rooftop solar PV easier, faster, and more
affordable, and the on going Race to 7-Day Solar prize competition continues to drive innovation
32
Barbose, G.; Darghouth, N. Tracking the Sun VIII: The Installed Price of Residential and Non-Residential
Photovoltaic Systems in the United States. LBNL, 2015. http://go.usa.gov/3SRz3
.
33
GTM & SEIA, U.S. Solar Market Insight: 2014 Year-in-Review. March 2015.
34
GTM & SEIA. U.S. Solar Market Insight Report: Q2 2015. September 2015.
35
GTM & SEIA. U.S. Solar Market Insight Report: Q3 2014. November 2014.

10
in this area. Efforts such as these appear to be turning the tide; even though module costs have
been relatively constant since 2012, distributed PV prices have continued to drop, indicating that
soft costs have been the major source of price reductions for the last two years.
36
Although these recent declines in soft costs have been impressive, this area continues to hold the
greatest potential for future cost reductions. For example, specific cities with the most favorable
PV permitting processes were found to have prices up to 12% lower than the median state-wide
price.
37
Similarly in 2014, despite comparable hardware costs, residential system pricing in
Germany was reported to be $2.13/W compared to $4.17/W in the United States.
38
These
examples indicate the huge potential to make further soft cost reductions.
A Capital Idea
Years ago, consumers had only one option if they wanted to install PV on their homes: pay for
the whole system upfront and wait for savings to accrue over time. This created a major barrier,
as most consumers could not afford the upfront costs, even if they would actually end up saving
money over the life of the system. However, consumers today have many new options available
to them. Third-party-ownership of PV systems has revolutionized the distributed PV market.
Similar to leasing a car, third-party ownership allows consumers to benefit from lower electricity
payments without purchasing the whole PV system directly. The success of this model has been
clear—third-party financing accounted for more than 72% of U.S. residential PV systems
installed in 2014.
39
In addition, other business and financing innovations such as zero-down solar loans, shared
community solar, and property assessed clean energy financing (also called PACE) are making it
much easier and more affordable for consumers to install rooftop PV.
Forecast: Sunny
The cost reduction and deployment growth of distributed PV is expected to continue, as experts
project the installed prices of residential PV systems to fall an additional 16-33% by 2020.
40
An
August 2015 DOE LPO announcement provided guidance on how distributed energy projects
may be eligible for DOE loan guarantees; those loan guarantees, along with other policy support,
could enable innovative technology solutions to overcome remaining market barriers and deliver
clean, cost-competitive distributed solar energy right to consumers’ doorsteps in virtually every
state in the nation.
41
36
Barbose, G.; Darghouth, N. Tracking the Sun VIII: The Installed Price of Residential and Non-Residential
Photovoltaic Systems in the United States. LBNL, 2015. http://go.usa.gov/3SRz3
.
37
Wiser, R.; Dong, C. The Impact of City-level Permitting Processes on Residential Photovoltaic Installation Prices
and Development Times. LBNL, 2013. http://go.usa.gov/3SRtF
.
38
Barbose, G.; Darghouth, N. Tracking the Sun VIII: The Installed Price of Residential and Non-Residential
Photovoltaic Systems in the United States. LBNL, 2015. http://go.usa.gov/3SRz3
.
39
GTM Research (2015). U.S. Residential Solar Financing 2015-2020.
40
Feldman, et. al. Photovoltaic System Pricing Trends: Historical, Recent, and Near
‐
Term Projections - 2015
Edition. LBNL and NREL. August 2015. http://go.usa.gov/3SRMH
.
41
U.S. Department of Energy, Loan Programs Office. Distributed Energy Projects. Accessed September 2015.
http://go.usa.gov/3SRz9
.
11
LED Lighting
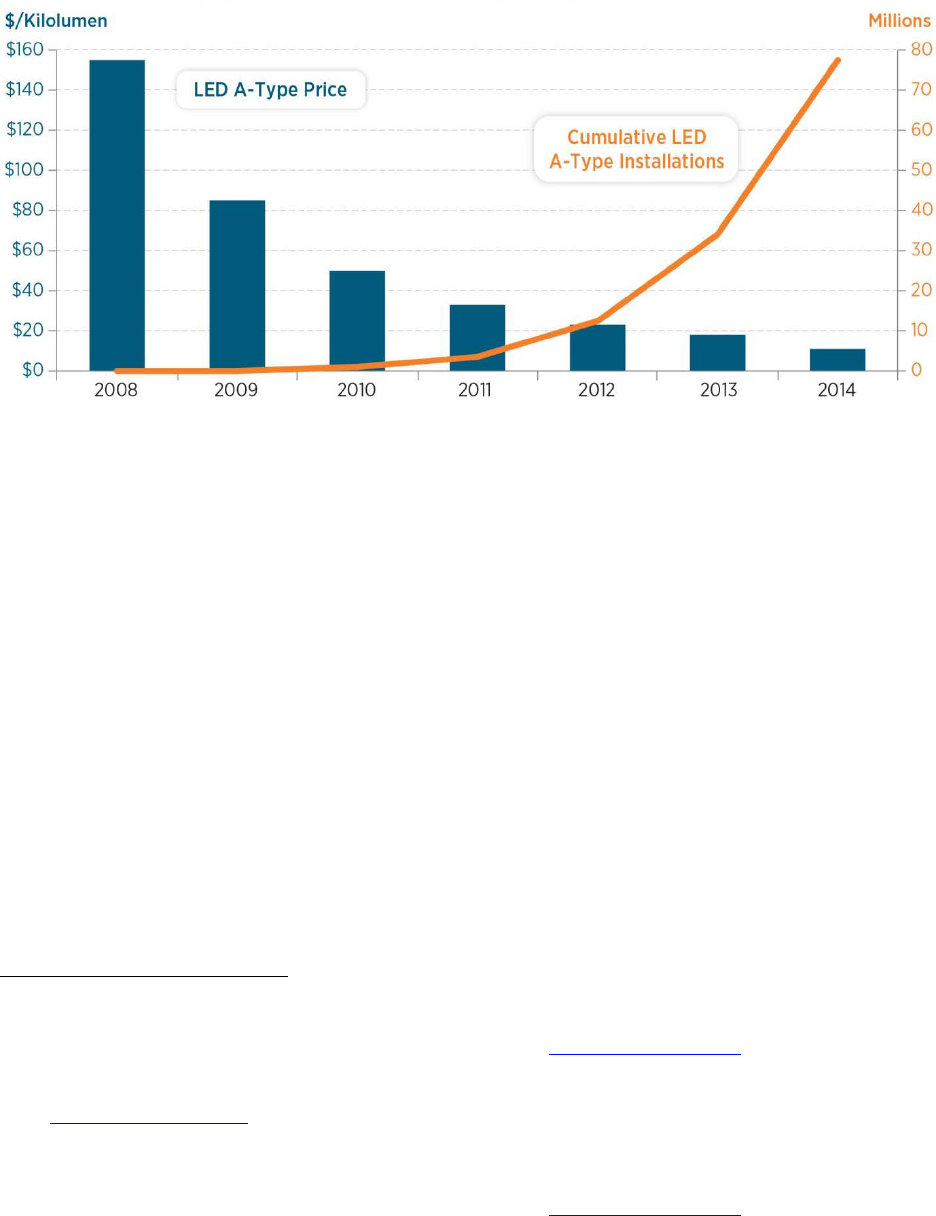
Notes: Kilolumen is a measure of visible light output by a source. Price data is in nominal dollars as reported in
internal tracking report.
42
Cumulative LED A-type bulb installations as reported in market report.
43
Turning Up the Lights
Stand underneath a traditional incandescent bulb and a LED bulb
44
and you will soon feel the
difference between the two— heat. While both produce the same amount of light, the
incandescent bulb is too hot to touch, a clear sign that much of the energy it uses is being wasted.
LED technologies have cut this wasted energy out of lighting: the best performing 60 W
equivalent LED bulbs available now consume 85% less energy than incandescent bulbs.
45
LEDs
are spurring a dramatic change in lighting due to their vast energy savings potential, lower costs,
improved performance, and added benefits like long lifetime and maintenance savings.
These benefits are moving LEDs into the mainstream. From 2012 to 2014, total installations of
common home LED bulbs increased six-fold from 13 million to 78 million—particularly rapid
growth considering there were fewer than 400,000 installations as recently as 2009. LED bulbs
now account for 2.4% of all currently installed lighting of this type – growth enabled by the
nearly 90% reduction in cost since 2008.
46
This success is a direct result of government-industry R&D investments to bring down costs,
improve efficiency and performance, and foster domestic manufacturing of LED lighting
42
U.S. Department of Energy, SSL Program, LED Lamp & Luminaire Product Tracker – A19 Lamps. Q2 2015.
43
U.S. Department of Energy. Solid-State Lighting Program. Adoption of Light Emitting Diodes in Common
Lighting Applications. Prepared by Navigant Consulting, July 2015. http://go.usa.gov/3SRzJ
.
44
In this report, “LED bulbs” refers to A-Type bulbs that are common in household applications.
45
Calculated from U.S. Department of Energy. LED Lighting Facts – CALiPER Snapshot “Light Bulbs”, October
2013. http://go.usa.gov/3SRzA
. See page 3, note 6. The best performing LED bulb approaches 90 lumens/W
efficacy. To produce 800 lumens this LED draws 8.89 W of power, a 85% reduction compared to the 60 W of power
drawn by the equivalent incandescent bulb.
46
U.S. Department of Energy. Solid-State Lighting Program. Adoption of Light Emitting Diodes in Common
Lighting Applications. Prepared by Navigant Consulting, July 2015. http://go.usa.gov/3SRzJ
.

12
components and products. In the past decade, modest yet highly strategic investments by DOE
have helped to make the United States the hub of LED lighting innovation. Today, America is
beginning to reap the rewards of these years of investment. Looking at the bigger picture across
all LED product types, LED installations prevented 7.1 million metric tons of CO
2
emissions and
saved $1.4 billion in energy costs in 2014 alone.
47
Beyond the Bulb
DOE and many in the lighting industry are looking toward the potential energy savings in the
commercial and industrial sectors offered by replacing fluorescent overhead lighting common in
most offices and manufacturing facilities. Energy impacts in these applications are
disproportionally high relative to market share because of the large number of installations and
extended operating hours. In contrast to lighting in homes, which average less than two hours of
operation per day, commercial and industrial lighting fixtures average about 12 hours of
operation per day.
Achieving the greatest possible market adoption and energy savings from LED products will
require ongoing technology R&D improvements. Unlike conventional lighting sources, LED
technology has significant headroom for additional technology advancements and DOE is
working with industry to continue to reduce costs through improved materials and optics,
optimized product design and assembly, boosting lumen outputs, and integrating LEDs with
lighting control systems, which will enable even greater energy savings. DOE analysis has
shown that with aggressive research and development, LED product efficiency can still be
almost doubled, from the current 125-135 lumens per watt to 230 lumens per watt.
48
A Bright Future
Fully capitalizing on the promise of LED technology will catapult our nation forward in creating
a clean energy future. Energy-efficient technologies like LED lighting not only reduce the
consumption of fossil fuels, they go hand-in-hand with making renewable energy more
competitive. For example, further cost reductions in LED lighting will make it far more
affordable and practical to construct zero-energy buildings—buildings so energy efficient that
renewable energy systems can offset all or most of their annual energy consumption. Likewise,
the conversion to LED street lighting will enable cities and towns across the country to
dramatically reduce their energy and maintenance costs.
LEDs are projected to reach over 80% of all lighting sales by 2030 driven by performance
increases and cost savings relative to conventional lighting.
49
This would save Americans $26
47
U.S. Department of Energy. Solid-State Lighting Program. Adoption of Light Emitting Diodes in Common
Lighting Applications. Prepared by Navigant Consulting, July 2015. http://go.usa.gov/3SRzJ
. Emission savings
calculated by converting the reported 143 trillion BTU of source energy savings to site energy using a 3.05 site-to-
source ratio, converting to electricity savings using 3412 BTU/kWh, and multiplying by the national CO
2
emission
intensity of 1,136 lbs CO
2
/MWh as reported by eGRID 2012 (http://go.usa.gov/crX6e).
48
Efficiency (luminaire efficacy) is projected to reach 196 lumens/W in 2020. U.S. Department of Energy. Solid-
State Lighting Program. Solid State Lighting R&D Plan. May 2015. http://go.usa.gov/cr4Sh
.
49
U.S. Department of Energy. Solid State Lighting Program. Energy Savings Forecast of Solid-State Lighting in
General Illumination Applications. Prepared by Navigant Consulting, August 2014. http://go.usa.gov/3SRuB
.

13
billion per year in electricity costs,
50
while cutting America’s lighting electricity use by nearly
half.
51
Developing this technology domestically also allows American manufacturing to benefit
from exporting LEDs to rapidly electrifying developing nations while enabling those countries to
save money and cut emissions by leapfrogging over less efficient lighting technologies.
50
Calculated from: 261 TWh projected electricity savings from LEDs in 2030 (Ibid). Average retail electricity price
for 2014 of 10.1 cents/kWh for residential, commercial, and industrial sectors (U.S. Department of Energy, Energy
Information Administration. Electric Power Monthly. “Table 5.3. Average Price of Electricity to Ultimate
Customers” Accessed October 2015. http://go.usa.gov/cYMpk
).
51
U.S. Department of Energy. Solid State Lighting Program. Energy Savings Forecast of Solid-State Lighting in
General Illumination Applications. Prepared by Navigant Consulting, August 2014. http://go.usa.gov/3SRuB
.
14
Electric Vehicles
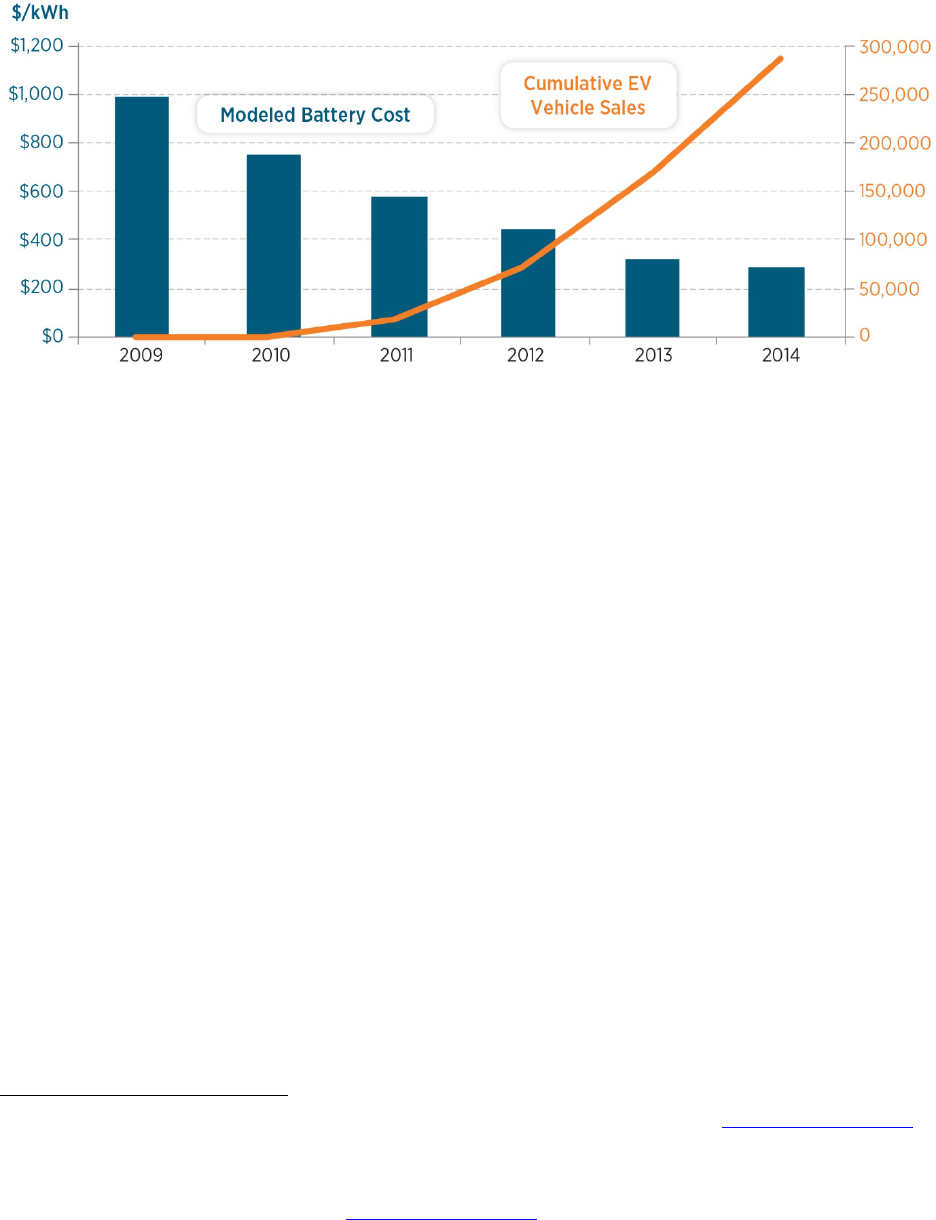
Notes: Costs are modeled costs for high-volume battery systems, derived from DOE/UIS Advanced Battery
Consortium PHEV Battery development projects and are representative of nominal dollars. Sales as reported by
market tracker, here “EVs” include all plug-in hybrid and battery plug-in vehicles.
52
Putting it into High Gear
Americans bought nearly 120,000 electric vehicles (EVs)
in 2014, more than double the number
purchased in 2012. This brings the total number of EVs on U.S. roads to nearly 300,000 by the
end of 2014.
53
Today, EVs are supporting America’s energy and climate goals and helping
domestic manufacturing remain globally competitive in the 21
st
century.
This is good news for our climate, our health, and our economy. With zero tailpipe emissions,
EVs reduce local air pollution and help us breathe a little easier. They also enhance our energy
security by reducing our oil use, while substantially cutting carbon emissions. For example a
representative EV reduces greenhouse gas emissions by 48%, compared to a gasoline fueled
car.
54
EVs also will become cleaner over time as the nation’s electricity supply continues to move to
lower-emitting energy sources.
This continued growth is the direct result of combined federal, state, and industry efforts to
bring down the cost of EVs through research and development of better batteries, promoting
consumer adoption through tax and other incentives, and supporting public and private
investments in domestic EV manufacturing capacity. DOE’s utility partnership agreement with
Edison Electric Institute is intended to pick up this pace by collaborating with 70 utilities to
accelerate EV and charging infrastructure deployment. Continued collaboration and investment
in public education and outreach initiatives along with industry, state and federal support build
on these successes to ensure the continued increase in EV adoption.
52
Argonne National Laboratory. 2014 Vehicle Technologies Market Report. March 2015. http://go.usa.gov/3S735.
53
Ibid.
54
EV emissions are highly sensitive to geographic location; this number is based on the national electricity
generation fuel mix: U.S. Department of Energy, Alternative Fuels Data Center. Emissions from Hybrid and Plug-In
Electric Vehicles. Accessed October 2015. http://go.usa.gov/3Snq9
.

15
Charging Ahead with Batteries
The increase in EV sales in recent years has been enabled by the development of lower-cost
lithium-ion batteries supported by DOE research, which will continue to be a critical area going
forward. DOE models for EV battery fabrication costs have indicated that the expected cost of
EV batteries at high-volume has fallen by an astounding 70% since 2008.
55
The cost and performance of batteries are a key factor in continuing to lower the costs of EV
ownership. In addition to universities and industry, DOE has been a leader in battery R&D
investment: between 1992 and 2012, DOE invested $1 billion dollars in battery R&D, which
advanced the state-of-the-art by six years and created $3.5 billion worth of economic value.
56
This investment continues to pay off as rapidly falling costs mean that near-future battery costs
may be as low as $200/kWh by 2020.
57
Looking ahead, DOE is working with industry,
academia, and its national laboratories toward achieving an even more aggressive goal of
$125/kWh modeled production costs by 2022.
58
We can now see firsthand the results of advanced research in EV batteries making their way into
the market. For example, the energy storage capacity of the second-generation Chevrolet Volt
battery increased by 15% compared to the previous generation.
59
In general, optimization of cell
chemistry, design, and performance decrease the mass of battery packs, allowing EVs to travel
farther with full performance.
Road to the Future
Automakers are taking advantage of these innovations to design lower-priced EVs that are
poised to be strong competitors. For example, multiple automakers plan on delivering 200-mile-
range EVs for less than $40,000 around 2017.
60
As EVs accounted for 1.6% of all passenger cars
sold in 2014,
61
the potential for the next generation of EVs to impact transportation is large.
Improved charging infrastructure will also maintain momentum for EVs. There are now more
than 30,000 public and private EV charging outlets in the United States,
62
and as of August 2015,
55
Modeled costs are validated through applied research, and represent calculated high-volume commercial
production costs, rather than market price.
56
Inflation adjusted to 2014 dollars using U.S. Bureau of Economic Analysis GDP budget deflator. U.S. Department
of Energy. Benefit-Cost Evaluation of U.S. DOE Investment in Energy Storage Technologies for Hybrid and Electric
Cars and Trucks. Prepared by STI International. December 2013. http://go.usa.gov/3SnqJ
.
57
Nilson, M.; Nykvist, B.; Rapidly Falling Costs of Battery Packs for Electric Vehicles. Nature Climate Change,
April 2015. http://dx.doi.org/10.1038/nclimate2564
.
58
U.S. Department of Energy. EV Everywhere Grand Challenge. January 2014. http://go.usa.gov/3Sn3B.
59
“Chevrolet Introduces All-New 2016 Volt,” General Motors, January 12, 2015. Accessed Aug. 25, 2015:
http://media.gm.com/media/us/en/gm/news.detail.html/content/Pages/news/us/en/2015/Jan/naias/chevrolet/volt/0112
-volt-2016-intro.html.
60
Davies, A. “Chevy Could Beat Tesla to Building the First Mainstream Electric Car,” Wired. Accessed Aug. 21,
2015: http://www.wired.com/2015/01/chevrolet-bolt-ev
.
61
118,882 EVs sold in 2014 (Argonne National Laboratory. 2014 Vehicle Technologies Market Report. March
2015. http://go.usa.gov/3S735
) compared to 7,687,619 total passenger cars sold in 2014 (Ward’s Auto U.S. Car and
Truck Sales, 1931-2014. January 2015. http://wardsauto.com/keydata/historical/UsaSa01summary).
62
U.S. Department of Energy, Alternative Fuels Data Center. “Alternative Fueling Station Counts by State,”
Accessed October 2015. http://go.usa.gov/3S7rh
. Residential EVSE locations or “wall outlets” are not included.

16
the DOE Workplace Charging Challenge had partnered with more than 230 organizations that
have committed to providing EV charging for employees, increasing range confidence for
potential EV owners.
63
This expanded charging network, along with EV-supportive municipal
codes for public and private parking facilities and workplace charging, is helping to drive
continued success. In addition, Tesla Motors has developed coast-to-coast fast charging for their
customers in the United States comprised of about 500 stations and nearly 3,000 chargers across
America and several in Canada, allowing cars to charge in minutes instead of hours.
64
The future
of EV charging research and development now lies in wireless power transfer—charging a car
without a power cord—which could open even more doors for future EVs in America.
As EVs have become mainstream, automakers are competing aggressively to design and deploy
the electric car of the future. With over 360,000 EVs deployed as of September 2015,
65
America
has one of the largest EV markets in the world and more and more Americans are abandoning the
gas pump and powering their cars with affordable, clean, and secure American energy.
63
Workplace Charging Challenge Newsletter: July 2015.
64
“Tesla Supercharger.” Accessed Aug. 21, 2015: http://www.teslamotors.com/supercharger.
65
Argonne National Laboratory, Light Duty Electric Drive Vehicles Monthly Sales Update, Accessed October 2015.
http://go.usa.gov/c3PeV
.
17
Revolution… Next
Our mission is innovation that continues to reduce the costs of a low carbon future from the near
term to the end of the century. The technologies highlighted in this report are already making a
big impact and are easily visible: wind towers dot the landscape, solar panels sprout on rooftops,
LEDs are on every hardware shelf, and the latest EV models can be seen on many neighborhood
streets.
Other emerging technologies that are not quite as visible will lead the next phase of the clean
energy revolution. In each case, deployment has begun to accelerate, costs have started falling,
and large-scale deployment could transform portions of the energy sector. The technologies
discussed here are among those to keep an eye on over the next five to 10 years.

18
Sweet Suite of Smart Building Technologies
A suite of new technologies will transform the way buildings use energy and interact with human
occupants. These “smart building” technologies may be easy to overlook, because they are
housed in familiar heating, ventilation, and air conditioning (HVAC) units and smart electricity
meters. However, their potential to increase the comfort of building occupants while saving
energy is immense. These devices can self-configure; communicate and self-diagnose
maintenance issues; learn building functions, floor plans, and layouts; and track occupancy
information to avoid complicated, expensive installation and maintenance scenarios and improve
user comfort. This feedback automates energy efficiency improvements and will help avoid the
need to crack a window when the office becomes too hot in the winter or bundle up when the air
conditioning is blasting in the summer.
Companies with large commercial facilities are starting to recognize the benefits of these
technologies and are working to retrofit existing heating and cooling units. These controls make
smart business sense with an average energy savings of 55% per unit, resulting in a one- to three-
year return on investment.
66
The potential for wider energy savings is also huge. Commercial
HVAC represents 250 billion kilowatt-hours of electricity use
67
and the addition of smart
controls to a subset of very large HVAC units less than 10 years old could lead to a savings of 37
billion kWh/year—more than the total amount of electricity generated in Nevada.
68
Smart meters on homes and businesses can enable energy savings and increase the flexibility of
the electricity grid. Advanced metering devices enable two-way communication between the
meter and the electricity provider and interface with smart thermostats and appliances (including
those large connected building HVAC units). Both allow utilities to better manage peak power
demand and assist the consumer in managing their own building energy use.
69
With 51.9 million
smart meters installed as of 2013, households and businesses are starting to take advantage of
this infrastructure and savings opportunities.
70
Key challenges to wider adoption of these technologies include the ability to install the product
directly out of the box, more easily install upgrades and perform maintenance, and enhancing
security. Smarter buildings will mean smarter energy use, which will lead to greenhouse gas
reductions, energy bill savings, and more comfortable homes and offices. It doesn’t take years of
schooling to see the time has come for this smart idea.
66
Wang, W.; et. al. Advanced Rooftop Control (ARC) Retrofit: Field-Test Results. Pacific Northwest National
Laboratory (PNNL), July 2013. http://go.usa.gov/3Sn3w
.
67
60% of cooling and ventilation load from: U.S Department of Energy, Buildings Energy Data Book, Table 3.1.4.
Accessed October 2015. http://buildingsdatabook.eren.doe.gov/
.
68
Internal U.S. Department of Energy Building Technologies Office calculations and
http://www.eia.gov/electricity/state/nevada/
.
69
Pratt, R.G., et. al. The Smart Grid: An Estimation of the Energy and CO2 Benefits. PNNL. January 2010.
http://go.usa.gov/3Snc5
.
70
U.S. Department of Energy, Energy Information Administration. Electric Power Annual 2013. “Table 10.10.
Advanced Metering County by Technology Type.” Accessed October 2015. http://go.usa.gov/3Snx4
.

19
Freight Trucks That Can Keep on Trucking
Tractor trailers, big rigs, semi-trucks, 18-wheelers—whatever you call them, these heavy trucks
are critical to economic activity, serving as the backbone of our domestic freight transport,
hauling nearly 73% of freight tonnage. Although freight trucks comprise only 4% of on-road
vehicles, they are responsible for almost 26% of U.S. on-road fuel consumption, representing a
huge potential for reducing the U.S. transportation sector’s energy and climate change impacts.
71
DOE’s Vehicle Technologies Office initiated the SuperTruck program in 2010 with the goal of
increasing the freight efficiency of long-haul trucks by 50% in 2015 compared to 2009. Four
teams were competitively selected for this five-year effort, and were led by Cummins/Peterbilt,
Daimler Trucks North America (DTNA), Navistar, and Volvo Trucks North America. These
manufacturers represent more than 90% of the U.S. market share for trucks. This program has
been a success with the top performing truck so far greatly exceeding the original goal, achieving
a 115% improvement in freight efficiency.
72
The technologies that enable these significant fuel efficiency improvements are actually a suite
of innovations that, in aggregate, result in big impacts. Modifications to the trailer that improve
aerodynamics and low rolling resistant tires can be easily paired with existing trucks to achieve
up to 27% fuel savings. One incredibly simple but effective example is the “skirts” that are now
often observed below the side and between the wheels of the trailer to reduce drag. Soon to be
released engines are expected to be at least 15% more efficient and will include advanced
powertrain electronics that will deliver gains in fuel economy through optimization and precise
control of combustion, fuel injection, air handling, and reductions in friction and other energy
losses.
With a combined DOE and industry investment of $270 million in developing SuperTruck
innovations, the technologies are already seeing commercial deployment or will be commercially
available in the near future. Overcoming the challenges that still remain in bringing some of the
more advanced solutions to market is a core goal of the Department’s follow on SuperTruck II
effort. Taken as a whole, SuperTruck technologies could achieve significant market penetration
in the near term and could result in a cumulative savings of nearly 290 million barrels of oil by
2020.
73
71
Federal Highway Administration, Highway Statistics 2013. “Table VM-1: Annual Vehicle Distance Traveled in
Miles and Related Data.” Accessed October 2015. http://go.usa.gov/3SnxP
.
72
U.S. Department of Energy, Vehicle Technologies Office. SuperTruck Team Achieves 115% Freight Efficiency
Improvement in Class 8 Long-Haul Truck. April 2015. http://go.usa.gov/3SnxG
.
73
U.S. Department of Energy. DOE SuperTruck Program Benefits Analysis. Prepared by TA Engineering.
December 2012. http://go.usa.gov/3SnC3
.

20
Vehicle Lightweighting: Lighten the Load and Hit the Road
Vehicle lightweighting is a key tool in developing the next generation of cars that achieve
significantly greater fuel economy and reductions in greenhouse gas emissions. This is an
effective method of saving both energy and fuel because a lighter vehicle requires less power to
accelerate. This allows the engine—a large source of mass in the car—to be downsized while
maintaining vehicle performance. For example, a 10% weight reduction can increase vehicle fuel
economy by 6% to 8% and for EVs lightweighting can increase how far the vehicle can travel on
battery power.
74
Lightweighting requires new materials to be developed to replace the conventional steel and
other heavy car components without compromising strength, performance, or safety. Some of
these new materials, such as high-strength steel and aluminum, are already in use, and advanced
material innovations such as composites made from polymer matrices, carbon fiber, and glass
fiber are working their way to market. New manufacturing processes have also been developed
to process these materials at scale. Many of these materials and manufacturing innovations were
proven through a recent lightweighting project supported by DOE, which culminated with the
demonstration of a 23.5% lighter 2013 Ford Fusion.
75
This demonstration used today’s materials
with unique manufacturing processes that previously had not been implemented at high volumes.
As a result, these innovations are ready for market entry.
Investment in this area is also growing: Ford announced that its 2016 line of F-150 trucks will
include aluminum parts that shed nearly 700 pounds compared to previous models. In addition,
vehicle components manufacturer Magna, as a result of a DOE-funded program, has built two
plants in the United States to produce special types of lightweight aluminum parts that are
otherwise impossible to manufacture domestically. Earlier this year DOE’s LPO announced a
conditional commitment for a $259 million loan to Alcoa, Inc. to support the expansion of an
existing manufacturing facility to produce advanced high-strength aluminum for automakers
such as Ford.
76
Other innovations like carbon fiber wheels, fiberglass coil springs, and
lightweight body panels are just beginning to be introduced into the luxury car segment. For
example BMW’s I3 EV has carbon fiber body and other manufacturers like Tesla, Mercedes
Benz, and Land Rover have aluminum body vehicles currently available in the market.
With industry, academia, and national labs, DOE continues to invest in reducing technical gaps
in lightweight structural materials (aluminum, magnesium, future generations of advanced high-
strength steel, and carbon fiber composites) and processes to accelerate their use to improve
efficiency in high volume vehicles. Continued investment will enable a huge potential savings in
this area. Projected innovations in lightweighting and advanced high efficiency engines deployed
in one quarter of the U.S. fleet could result in a savings of five billion gallons per year by 2030.
77
74
U.S. Department of Energy, Quadrennial Technology Review. 2011. p.39. http://go.usa.gov/3SnC9.
75
U.S. Department of Energy. Road to Fuel Savings: Ford, Magna Partnership Help Vehicles Shed the Pounds.
August 2014. http://go.usa.gov/3SnCA
.
76
U.S Department of Energy. Energy Department Offers Conditional Commitment to Alcoa to Support
Manufacturing of Aluminum for Automotive Sector. March 2015. http://go.usa.gov/3SnCJ
.
77
U.S. Department of Energy, Vehicle Technologies Office. Lightweight Materials for Cars and Trucks. Accessed
October 2015. http://go.usa.gov/3SnrB
.
21
Conclusion
The clean energy technologies highlighted here are transforming how our nation produces and
uses energy. While challenges and uncertainty exist for these technologies, it is clear that they
are not some far away opportunity, but are now a significant part of the energy landscape. We
can and should plan on using them to clean our air, reduce our reliance on unstable oil markets,
and help build an economy that is more competitive and more efficient, while reducing carbon
pollution.
There are even more technologies that are just on the horizon. These will increase the efficiency
of the vehicles we depend on for travel and move goods, and the systems we use to manufacture
new products and control our buildings. Although not as visible to the public eye, these
technologies are every bit as important to the future clean energy economy, holding the potential
for significant energy savings.
DOE will continue to encourage these innovations by providing support for R&D, consumer
education, and industry and stakeholder engagement. With continued progress in critical
renewable and energy-efficient technologies like these, we can look forward to a future of clean,
American-made energy.
