AUGUST 2013
2012 WIND
TECHNOLOGIES
MARKET REPORT
This report is being disseminated by the U.S. Department of Energy (DOE). As such, this document was
prepared in compliance with Section 515 of the Treasury and General Government Appropriations Act for
fiscal year 2001 (public law 106-554) and information quality guidelines issued by DOE. Though this report
does not constitute “influential” information, as that term is defined in DOE’s information quality guidelines or
the Oce of Management and Budget’s Information Quality Bulletin for Peer Review, the study was reviewed
both internally and externally prior to publication. For purposes of external review, the study benefited from
the advice and comments of five wind industry and trade association representatives, seven consultants,
three federal laboratory sta, and one U.S. Government employee.
NOTICE
This report was prepared as an account of work sponsored by an agency of the United States government.
Neither the United States government nor any agency thereof, nor any of their employees, makes any
warranty, express or implied, or assumes any legal liability or responsibility for the accuracy, completeness, or
usefulness of any information, apparatus, product, or process disclosed, or represents that its use would not
infringe privately owned rights. Reference herein to any specific commercial product, process, or service by
trade name, trademark, manufacturer, or otherwise does not necessarily constitute or imply its endorsement,
recommendation, or favoring by the United States government or any agency thereof. The views and opinions
of authors expressed herein do not necessarily state or reflect those of the United States government or any
agency thereof.
Available electronically at osti.gov/bridge
Available for a processing fee to U.S. Department of Energy
and its contractors, in paper, from:
U.S. Department of Energy
Oce of Scientific and Technical Information
P.O. Box 62
Oak Ridge, TN 37831-0062
phone: 865.576.8401
fax: 865.576.5728
email: reports@adonis.osti.gov
Available for sale to the public, in paper, from:
U.S. Department of Commerce
National Technical Information Service
5285 Port Royal Road
Springfield, VA 22161
phone: 800.553.6847
fax: 703.605.6900
email: orders@ntis.fedworld.gov
online ordering: ntis.gov/ordering.htm

2012 Wind Technologies Market Report
i
2012 Wind Technologies Market Report
Primary authors
Ryan Wiser, Lawrence Berkeley National Laboratory
Mark Bolinger, Lawrence Berkeley National Laboratory
With contributions from
Galen Barbose, Naïm Darghouth, Ben Hoen, Andrew Mills, Samantha Weaver (Berkeley Lab)
Kevin Porter, Michael Buckley, Sari Fink (Exeter Associates)
Frank Oteri, Suzanne Tegen (National Renewable Energy Laboratory)
Table of Contents
Acknowledgments ......................................................................................................................... i
List of Acronyms and Abbreviations .......................................................................................... ii
Executive Summary .................................................................................................................... iv
1. Introduction ............................................................................................................................... 1
2. Installation Trends ................................................................................................................... 3
3. Industry Trends ...................................................................................................................... 14
4. Cost Trends ............................................................................................................................ 32
5. Performance Trends .............................................................................................................. 42
6. Wind Power Price Trends ..................................................................................................... 49
7. Policy and Market Drivers .................................................................................................... 55
8. Future Outlook ........................................................................................................................ 69
Appendix: Sources of Data Presented in this Report ........................................................... 72
References .................................................................................................................................. 76
Acknowledgments
For their support of this ongoing report series, the authors thank the entire U.S. Department of Energy (DOE) Wind
& Water Power Technology Office team and, in particular, Patrick Gilman, Cash Fitzpatrick, Mark Higgins, and
Rich Tusing. For reviewing elements of this report or providing key input, we also acknowledge: Eric Lantz and Ted
James (National Renewable Energy Laboratory, NREL); Liz Salerno, Emily Williams, and Michael Goggin
(American Wind Energy Association, AWEA); Cash Fitzpatrick, Liz Hartman, and Larry Mansueti (DOE); Alice
Orrell (Pacific Northwest National Laboratory); Andrew David (U.S. International Trade Commission); Matthew
Kaplan (IHS-EER); Charlie Smith (UVIG); Ed DeMeo (Renewable Energy Consulting Services); Ed Weston
(GLWN); and Matthew McCabe (Clear Wind). We greatly appreciate AWEA for the use of their comprehensive
database of wind power projects. We also thank Amy Grace (Bloomberg New Energy Finance) for the use of
Bloomberg NEF’s graphic on domestic wind turbine nacelle assembly capacity; Charlie Bloch, Terese Decker, and
Bruce Hamilton (Navigant Consulting) for assistance with the section on offshore wind; Donna Heimiller and Billy
Roberts (NREL) for assistance with the wind project and wind manufacturing maps as well as for assistance in
mapping wind resource quality; Kathleen O’Dell (NREL) for assistance with layout, formatting, and production; and
Jarett Zuboy (consultant) for editorial assistance. Berkeley Lab’s contributions to this report were funded by the
Wind & Water Power Technology Office, Office of Energy Efficiency and Renewable Energy of the U.S.
Department of Energy under Contract No. DE-AC02-05CH11231. The authors are solely responsible for any
omissions or errors contained herein.
2012 Wind Technologies Market Report
ii
List of Acronyms and Abbreviations
AWEA American Wind Energy Association
Bloomberg NEF Bloomberg New Energy Finance
BPA Bonneville Power Administration
CAISO California Independent System Operator
CREZ Competitive Renewable Energy Zone
DOE U.S. Department of Energy
EDPR EDP Renováveis
EEI Edison Electric Institute
EIA U.S. Energy Information Administration
ERCOT Electric Reliability Council of Texas
FERC Federal Energy Regulatory Commission
GE General Electric Corporation
GW gigawatt
HTS Harmonized Tariff Schedule
ICE IntercontinentalExchange
IOU investor-owned utility
IPP independent power producer
ISO independent system operator
ISO-NE New England Independent System Operator
ITC investment tax credit
kV kilovolt
kVA kilovolt-amp
kW kilowatt
kWh kilowatt-hour
LIBOR London Interbank Offered Rate
m
2
square meter
MAPP Mid-Atlantic Power Pathway
MISO Midcontinent Independent System Operator
MTEP12 MISO Transmission Expansion Plan 2012
MW megawatt
MWh megawatt-hour
NERC North American Electric Reliability Corporation
NREL National Renewable Energy Laboratory
NSP Northern States Power Company
NYISO New York Independent System Operator
O&M operations and maintenance
OEM original equipment manufacturer
PATH Potomac-Appalachian Transmission Highline
2012 Wind Technologies Market Report
iii
PGE Portland General Electric
PJM PJM Interconnection
POU publicly owned utility
PPA power purchase agreement
PSCo Public Service Company of Colorado
PTC production tax credit
REC renewable energy certificate
RGGI Regional Greenhouse Gas Initiative
RPS renewables portfolio standard
RTO regional transmission organization
SPP Southwest Power Pool
SPS Southwestern Public Service Company
USITC U.S. International Trade Commission
W watt
WAPA Western Area Power Administration
2012 Wind Technologies Market Report
iv
Executive Summary
Annual wind power capacity additions in the United States achieved record levels in 2012,
motivated by the then-planned expiration of federal tax incentives at the end of 2012 and recent
improvements in the cost and performance of wind power technology. At the same time, even
with a short-term extension of federal tax incentives now in place, the U.S. wind power industry
is facing uncertain times. It will take time to rebuild the project pipeline, ensuring a slow year for
new capacity additions in 2013. Continued low natural gas prices, modest electricity demand
growth, and limited near-term demand from state renewables portfolio standards (RPS) have also
put a damper on industry growth expectations. In combination with global competition within the
sector, these trends continue to impact the manufacturing supply chain. What these trends mean
for the medium to longer term remains to be seen, dictated in part by future natural gas prices,
fossil plant retirements, and policy decisions, although recent declines in the price of wind
energy have boosted the prospects for future growth.
Key findings from this year’s Wind Technologies Market Report include:
• Wind Power Additions Hit a New Record in 2012, with 13.1 GW of New Capacity
Added in the United States and $25 Billion Invested. Wind power installations in 2012
were more than 90% higher than in 2011 and 30% greater than the previous record in 2009.
Cumulative wind power capacity grew by 28% in 2012, bringing the total to 60 GW.
• Wind Power Represented the Largest Source of U.S. Electric-Generating Capacity
Additions in 2012. Wind power constituted 43% of all nameplate capacity additions in 2012,
overtaking natural gas-fired generation as the leading source of new capacity. This follows
the 5 previous years in which wind power represented between 25% and 43% of new U.S.
electric generation capacity in each year.
• The United States Narrowly Regained the Lead in Annual Wind Power Capacity
Additions in 2012 but Was Well Behind the Market Leaders in Wind Energy
Penetration. After leading the world in annual wind power additions from 2005 through
2008, and then losing the mantle to China from 2009 through 2011, the U.S. narrowly
regained the global lead in 2012. The U.S. market represented roughly 29% of global
installed capacity in 2012, a steep rise from the 16% registered in 2011. In terms of
cumulative capacity, the U.S. remained the second leading market. A number of countries are
beginning to achieve high levels of wind energy penetration: end-of-2012 installed wind
power is estimated to supply the equivalent of nearly 30% of Denmark’s electricity demand,
compared to approximately 18% for Portugal and Spain, 16% for Ireland, and 10% for
Germany. In the United States, the cumulative wind power capacity installed at the end of
2012 is estimated, in an average year, to equate to roughly 4.4% of electricity demand.
• Texas Added More New Wind Power Capacity than Any Other State, while Nine States
Exceed 12% Wind Energy Penetration. With 1,826 MW installed in 2012, Texas edged
out California to reclaim its lead in adding the most new wind capacity. Other leading states
in terms of new capacity (each with more than 1,000 MW) included California, Kansas, and
Oklahoma. On a cumulative basis, Texas remained the clear leader. Notably, the wind power
capacity installed in Iowa, South Dakota, and Kansas as of the end of 2012 is estimated, in an
average year, to supply approximately 25%, 24%, and 20%, respectively, of all in-state

2012 Wind Technologies Market Report
v
electricity generation. As of the end of 2012, a total of nine states had enough wind capacity
installed to supply more than 12% of all in-state electricity generation in an average year.
• No Commercial Offshore Turbines Have Been Commissioned in the United States, but
Offshore Project and Policy Developments Continued in 2012. At the end of 2012, global
cumulative offshore wind capacity stood at roughly 5,117 MW, with Europe being the
primary locus of activity. No commercial offshore projects have been installed in the United
States, and the emergence of a U.S. market faces both challenges and opportunities.
Significant strides continued to be made in the federal arena in 2012, both through the U.S.
Department of the Interior’s responsibilities with regards to regulatory approvals and the U.S.
Department of Energy’s (DOE’s) investments in offshore wind energy research and
development (which includes funding seven advanced demonstration project partnerships).
Interest exists in developing offshore wind energy in several parts of the country; for
example, Navigant Consulting finds that eight projects totaling 2,380 MW are somewhat
more advanced in the development process. Of these, two have signed power purchase
agreements (PPAs), and the extension of federal tax incentives in early 2013 may motivate
both projects to commence construction by the end of 2013.
• Data from Interconnection Queues Demonstrate that an Enormous Amount of Wind
Power Capacity Is Under Consideration but that Relative Interest in Wind May Be
Declining. At the end of 2012, there were 125 GW of wind power capacity within the
transmission interconnection queues administered by independent system operators, regional
transmission organizations, and utilities reviewed for this report. More than 95% of this
capacity is planned for Texas, the Northwest, Southwest Power Pool, PJM Interconnection,
the Midwest, the Mountain region, and California. Wind power represented 37% of all
generating capacity within these queues at the end of 2012 and was slightly lower than the
130 GW of natural gas in the queues. In 2012, 20 GW of gross wind power capacity entered
the interconnection queues, compared to 55 GW of natural gas and 10 GW of solar. Of note
is that the absolute amount of wind, coal, and nuclear power in the sampled interconnection
queues (considering gross additions and project drop-outs) has generally declined in recent
years, whereas natural gas and solar capacity has increased.
• The “Big Three” Turbine Suppliers Captured more than 70% of the U.S. Market in
2012, yet Diversification Continues. GE Wind led the U.S. market with more than 5 GW of
wind turbines newly installed in 2012, for a 38% market share. Following GE Wind were
Siemens (with a 20% market share), Vestas (14%), and Gamesa (10%). There has been a
notable increase in the number of wind turbine manufacturers serving the U.S. market; the
number installing more than 1 MW increased from just five in 2005 to 25 in 2012. The “big
three” turbine suppliers—GE Wind, Vestas, and Siemens—have, however, actually gained
market share since 2008/2009. Globally, U.S.-owned GE ascended to an effective tie with
Vestas as the top supplier of turbines worldwide in 2012. Chinese turbine manufacturers also
continue to occupy positions of prominence in the global ratings, although none of these
suppliers made the top five in 2012. To date, their growth has been based almost entirely on
sales to the Chinese market. However, 2012 U.S. installations by Chinese and South Korean
manufacturers included those from Goldwind, China Creative Wind Energy, Guodian United
Power, Sinovel, Hyundai, HZ Windpower, and Sany Electric.
• The Manufacturing Supply Chain Responded to a Record Year in Wind Power
Capacity Additions, but with Substantial Growing Pains. Wind turbine and component
manufacturers met the challenge of supplying a 13-GW market in 2012. Seven of the 10
2012 Wind Technologies Market Report
vi
turbine suppliers with the largest share of the U.S. market in 2012 had one or more
operational manufacturing facility in the United States in 2012. In contrast, only 8 years
earlier, there was only one active utility-scale turbine manufacturer assembling nacelles in
the United States (GE). Despite this significant growth in the domestic supply chain, reduced
near-term demand expectations led to a difficult business environment in 2012. Not only did
a smaller number of new turbine and component manufacturing facilities open in 2012 than
in 2011, but also a number of facilities closed (including the manufacturing facilities of
Clipper and Nordic). Even with these adjustments, near-term forecasts for wind power
additions in the United States suggest that the market will have an over-capacity of nacelle
assembly capability in the short term. The American Wind Energy Association estimates that
the entire wind energy sector directly and indirectly employed 80,700 full-time workers in
the United States at the end of 2012. Although this is 5,700 more jobs than reported in 2011,
wind industry manufacturing jobs saw an overall decrease from 30,000 jobs in 2011 to
25,500 in 2012 due to the severe decline in new orders towards the end of 2012.
Manufacturers have now begun receiving orders for 2013 and 2014 delivery, but it is not yet
clear to what degree these orders will lead to a recovery of the manufacturing sector in 2013.
• Despite Challenges, a Growing Percentage of the Equipment Used in U.S. Wind Power
Projects Has Been Sourced Domestically in Recent Years. U.S. trade data show that the
United States remained a large importer of wind power equipment in 2012 but that growth in
installed wind power capacity has outpaced the growth in imports in recent years. As a result,
a growing percentage of the equipment (in dollar-value terms) used in wind power projects
has been sourced domestically. Focusing on selected trade categories, and when presented as
a fraction of total equipment-related wind turbine costs, the overall import fraction is
estimated to have declined considerably, from 75% in 2006–2007 to 28% in 2012.
Conversely, if one assumes that no wind equipment imports occurred through trade
categories beyond those analyzed here, then domestic content has increased from 25% in
2006–2007 to 72% in 2012. Exports of wind-powered generating sets from the United States
have also increased, rising from $16 million in 2007 to $388 million in 2012 (all cost and
price data in the report are in real 2012$).
• Although the Average Nameplate Capacity of Installed Wind Turbines Declined
Slightly, the Average Hub Height and Rotor Diameter Continued to Increase. The
average nameplate capacity of wind turbines installed in the United States in 2012 was 1.94
MW, nearly the same as in 2011 (when it was 1.97 MW). Since 1998–1999, average turbine
capacity has increased by 170%. Average hub heights and rotor diameters have also scaled
with time, to 83.8 and 93.5 meters, respectively, in 2012. Since 1998–1999, the average
turbine hub height has increased by 50%, while the average rotor diameter has increased by
96%. In large part, these increases have been driven by new turbines designed to serve lower-
wind-speed sites. Industry expectations as well as new turbine announcements suggest that
significant further scaling, especially in rotor diameter, is anticipated in the near term.
• The Project Finance Environment Held Steady in 2012. Considerable uncertainty
surrounding the fate of the production tax credit (PTC) in 2013 led to lower commitments of
both tax equity and debt in 2012. Yields in both markets, however, remained largely
unchanged from 2011. In the debt market, a seemingly permanent shift to shorter bank loan
tenors has created an opportunity for institutional lenders and bond markets that can offer
longer-maturity instruments. Some developers are tapping into hybrid bank/bond instruments
2012 Wind Technologies Market Report
vii
that play to the strengths of both types of debt in offering what, from the developer’s
perspective, appears to be a synthetic, fully amortizing long-term loan.
• Independent Power Producers Remained the Dominant Owners of Wind Projects while
Utilities Took a Breather in 2012. Independent power producers (IPPs) own 88% of all new
wind power capacity installed in the United States in 2012 and 83% of the cumulative
installed capacity. In a deviation from what has been a growth trend, utility ownership of new
capacity built in 2012 fell to 10%, down from 25% in 2011, while on a cumulative basis
utilities owned 15% of total wind power capacity at the end of 2012.
• Long-Term Contracted Sales to Utilities Remained the Most Common Off-Take
Arrangement and Have Gained Ground since the Peak of Merchant Development in
2008/2009. Electric utilities continued to be the dominant off-takers of wind power in 2012,
either owning (10%) or buying (69%) power from 79% of the new capacity installed last
year. Merchant/quasi-merchant projects were less prevalent in 2012 than they have been in
recent years, accounting for 19% of all new capacity. On a cumulative basis, utilities own
(15%) or buy (54%) power from 69% of all wind power capacity in the United States, with
merchant/quasi-merchant projects accounting for 23% and power marketers 8%.
• Wind Turbine Prices Remained Well Below Levels Seen Several Years Ago. After
hitting a low of roughly $700/kW from 2000 to 2002, average turbine prices increased to
more than $1,500/kW by 2009. Wind turbine prices have since dropped substantially, despite
continued technological advancements that have yielded increases in hub heights and
especially rotor diameters. Recently announced turbine transactions have often been priced in
the $950–$1,300/kW range. These price reductions, coupled with improved turbine
technology and more-favorable terms for turbine purchasers, are exerting downward pressure
on total project costs and wind power prices.
• Reported Installed Project Costs Continued to Trend Lower in 2012. Among a large
sample of wind projects installed in 2012, the capacity-weighted average installed cost stood
at nearly $1,940/kW, down almost $200/kW from the reported average cost in 2011 and
down almost $300/kW from the reported average cost in both 2009 and 2010. Whereas
turbine prices peaked in 2008/2009, project-level installed costs appear to have peaked in
2009/2010. That changes in average project costs would lag changes in average turbine
prices is not surprising; it reflects the normal passage of time between when a turbine supply
agreement is signed and when those turbines are actually installed. Anecdotal indications
from a handful of projects currently under construction and anticipating completion in 2013
suggest that average installed costs may decline further.
• Installed Costs Differed By Project Size, Turbine Size, and Region. Installed project costs
exhibit some economies of scale, at least at the lower end of the project and turbine size
range. Additionally, among projects built in 2012, the windy Interior region of the country
was the lowest-cost region.
• Operations and Maintenance Cost Varied By Project Age and Commercial Operations
Date. Despite limited data availability, it appears that projects installed over the past decade
have, on average, incurred lower operations and maintenance (O&M) costs than older
projects in their first several years of operation, and that O&M costs increase as projects age.
• Trends in Sample-Wide Capacity Factors Were Impacted by Curtailment and Inter-
Year Wind Resource Variability. Wind project capacity factors have generally been higher
on average in more recent years (e.g., 32.1% from 2006–2012 versus 30.3% from 2000–
2005), but time-varying influences—such as inter-year variations in the strength of the wind

2012 Wind Technologies Market Report
viii
resource or changes in the amount of wind power curtailment—have tended to mask the
positive influence of turbine scaling on capacity factors in recent years. Positively, the degree
of wind curtailment has declined recently in what historically have been the most
problematic areas (e.g., West Texas) as a result of concrete steps taken to address the issue.
• Average Capacity Factors for Projects Built After 2005 Have Been Stagnant: Turbine
Design Changes Boosted Capacity Factors, while Project Build-Out in Lower-Quality
Resource Areas Pushed the Other Way. Even when controlling for time-varying influences
by focusing only on capacity factors in 2012 (parsed by project vintage), it is difficult to
discern any improvement in average capacity factors among projects built after 2005. This is
partially attributable to the fact that average “specific power”
i
remained largely unchanged
from 2006–2009, before resuming its downward trend with 2010-vintage projects. At the
same time, the average quality of the wind resource in which new projects are located has
declined; this decrease has been particularly sharp since 2008 and has counterbalanced the
drop in specific power. Controlling for these two competing influences of specific power and
wind resource quality confirms this offsetting effect and shows that turbine design changes
are driving capacity factors higher for projects located in fixed wind resource regimes.
• Regional Variations in Capacity Factor Reflect the Strength of the Wind Resource.
Based on a sub-sample of wind power projects built from 2007 through 2011, average
capacity factors in 2012 were the highest in the Interior region (36%) and the lowest in the
Southeast (23%) and Northeast (24%) regions. Not surprisingly, these regional rankings are
roughly consistent with the relative quality of the wind resource in each region.
• Wind Power Purchase Agreement Prices Generally Have Been Falling Since 2009 and
Now Rival Previous Lows Set a Decade Ago (Despite the Trend Towards Lower-Quality
Wind Resource Sites). After topping out at nearly $70/MWh in 2009, the average levelized
long-term price from wind PPAs signed in 2011/2012—many of which were for projects
built in 2012—fell to around $40/MWh nationwide. This level approaches previous lows set
back in the 2000–2005 period, which is notable given that installed project costs have not
returned to 2000–2005 levels and that wind projects increasingly have been sited in lower-
quality wind resource areas. Clearly, turbine scaling has more than overcome these
headwinds to drive PPA prices lower. PPA prices are generally lowest in the Interior region,
highest in the West, and in the middle ground elsewhere.
• Low Wholesale Electricity Prices Continued to Challenge the Relative Economics of
Wind Power. Average levelized wind PPA prices compared favorably to yearly wholesale
electricity prices from 2003 through 2008. Starting in 2009, the sharp drop in wholesale
electricity prices squeezed average wind PPA prices out of the wholesale price range on a
nationwide basis. Wind PPA prices then fell and, in 2011 and 2012, reconnected with the
upper end of the wholesale power price range. Based on our sample, wind PPA prices in
2011/2012 were most competitive with wholesale prices in the Interior region (where PPAs
signed in 2011/2012 generally ranged from $20–$40/MWh) and were least competitive in the
West (with a PPA price range of less than $50/MWh to more than $90/MWh), with the Great
Lakes and Northeast regions falling in between (with PPA prices of roughly $50–$70/MWh).
• Short-Term Extension of Federal Incentives for Wind Energy Has Helped Restart the
Domestic Market. In January 2013, the PTC was extended, as was the ability to take the
i
A wind turbine’s specific power is the ratio of its nameplate capacity rating to its rotor-swept area. All else equal, a
decline in specific power should lead to an increase in capacity factor.
2012 Wind Technologies Market Report
ix
30% investment tax credit (ITC) in lieu of the PTC. Wind power projects that begin
construction before the end of 2013 will now be eligible to receive the PTC or ITC. These
provisions helped restart the domestic wind market and are expected to spur capacity
additions in 2014 as projects that begin construction in 2013 reach commercial operations.
• State Policies Help Direct the Location and Amount of Wind Power Development, but
Current Policies Cannot Support Continued Growth at Recent Levels. As of June 2013,
RPS policies existed in 29 states and Washington D.C. From 1999 through 2012, 69% of the
wind power capacity built in the United States was located in states with RPS policies; in
2012, this proportion was 83%. However, given renewable energy growth over the last
decade, existing RPS programs are projected to drive average annual renewable energy
additions of just 3–5 GW/year between 2013 and 2020 (only a portion of which will be from
wind), less than the amount of wind capacity added in recent years, thus demonstrating the
limitations of relying exclusively on RPS programs to drive future deployment.
• Solid Progress on Overcoming Transmission Barriers Continued. During the last 5 years,
more than 2,300 circuit miles of new transmission additions were constructed per year, and
an additional 18,700 circuit miles are planned for the next 5 years. The wind industry has
identified near-term transmission projects that—if all were completed—could carry almost
70 GW of wind power capacity. The Federal Energy Regulatory Commission continues to
implement Order 1000, which requires public utility transmission providers to improve intra-
and inter-regional transmission planning processes and to determine cost-allocation
methodologies for new transmission facilities. States, grid operators, utilities, regional
organizations, and DOE also continue to take proactive steps to encourage transmission
investment. Additionally, construction and development progress was made in 2012 on a
number of transmission projects designed, in part, to support wind power. Despite this
progress, siting, planning, and cost-allocation issues remain key barriers to transmission
investment, and wind curtailment continues to be a problem in some areas.
• System Operators Are Implementing Methods to Accommodate Increased Penetration
of Wind Energy. Recent studies show that wind energy integration costs are almost always
below $12/MWh—and often below $5/MWh—for wind power capacity penetrations of up to
or even exceeding 40% of the peak load of the system in which the wind power is delivered.
The increase in balancing reserves with increased wind penetration is projected, in most
cases, to be below 15% of the nameplate capacity of wind power and typically considerably
less than this figure, particularly in studies that use intra-hour scheduling. Moreover, a
number of strategies that can help to ease the integration of increasing amounts of wind
energy—including the use of larger balancing areas, the use of wind forecasts, and intra-hour
scheduling—are being implemented by grid operators across the United States.
Although federal tax incentives are now available for wind projects that initiate construction by
the end of 2013, it will take time to recharge the project pipeline. As a result, 2013 is expected to
be a slow year for new capacity additions, lowering not only U.S. but global growth forecasts.
The year 2014, on the other hand, is expected to be more robust as developers commission
projects that began construction in 2013. Projections for 2015 and beyond are much less certain.
Despite the improved cost, performance, and price of wind energy and the prospect for fossil
plant retirement, federal policy uncertainty—in concert with continued low natural gas prices,
modest electricity demand growth, and the aforementioned slack in existing state policies—may
put a damper on medium-term growth expectations.

2012 Wind Technologies Market Report
1
1. Introduction
Annual wind power capacity additions in the United States achieved record levels in 2012,
motivated by the then-planned expiration of federal tax incentives at the end of 2012 and
impressive recent improvements in the cost and performance of wind power technology. At the
same time, even with a short-term extension of federal tax incentives now in place, the U.S. wind
power industry is facing uncertain times. It will take time to rebuild the project pipeline, ensuring
a slow year for new capacity additions in 2013. Continued low natural gas prices, modest
electricity demand growth, and limited near-term demand from state renewables portfolio
standards (RPS) have also put a damper on industry growth expectations. In combination with
global competition within the sector, these trends continue to impact the manufacturing supply
chain. What these trends mean for the medium to longer term remains to be seen and will be
dictated in part by future natural gas prices, fossil plant retirements, and state and federal policy
decisions, although recent declines in wind energy prices have boosted future growth prospects.
This annual report—now in its seventh year—provides a detailed overview of developments and
trends in the U.S. wind power market, with a particular focus on 2012. As with previous editions,
the report begins with an overview of key installation-related trends: trends in wind power
capacity growth; how that growth compares to other countries and generation sources; the
amount and percentage of wind energy in individual states; the status of offshore wind power
development; and the quantity of proposed wind power capacity in various interconnection
queues in the United States. Next, the report covers an array of wind power industry trends,
including: developments in turbine manufacturer market share; manufacturing and supply-chain
developments; wind turbine and component imports into and exports from the United States;
wind turbine size, hub height, and rotor diameter; project financing developments; and trends
among wind power project owners and power purchasers. The report then turns to a discussion of
wind power cost, performance, and pricing trends. In so doing, it describes trends in wind turbine
transaction prices, installed project costs, operations and maintenance (O&M) expenses, and
project performance. It also reviews the prices paid for wind power in the United States and how
those prices compare to short-term wholesale electricity prices. Next, the report examines policy
and market factors impacting the domestic wind power market, including federal and state policy
drivers, transmission issues, and grid integration. The report concludes with a preview of
possible near-term market developments.
This seventh edition of the annual report updates data presented in previous editions while
highlighting key trends and important new developments from 2012. New to this edition are the
following: a somewhat expanded analysis of wind turbine equipment imports and exports as well
as wind project O&M costs; a summary of trends in wind project capacity factors by turbine
design and estimated wind resource conditions; further emphasis on full-term power purchase
agreement (PPA) prices levelized over the contract term; and reporting certain data based on
revised regional definitions and boundaries. The report concentrates on larger-scale wind
turbines, defined here as individual turbines that exceed 100 kW in size.
1
The U.S. wind power
1
This 100-kW threshold between “small” and “large” wind turbines is applied starting with 2011 projects (to better
match AWEA’s historical methodology) and is justified by the fact that the U.S. tax code makes a similar
distinction. In years prior to 2011, however, different cut-offs are used to better match AWEA’s reported capacity
numbers and to ensure that older utility-scale wind power projects in California are not excluded from the sample.
2012 Wind Technologies Market Report
2
sector is multifaceted, however, and also includes smaller, customer-sited wind turbines used to
power residences, farms, and businesses. Data on these smaller turbines are not the focus of this
report, although a brief discussion on Small Wind Turbines is provided on page 4. Further
information on the larger category of distributed wind power is available through a separate
annual report funded by the U.S. Department of Energy (DOE). Additionally, because this report
has an historical focus, and all U.S. wind power projects have been land based, its treatment of
trends in the offshore wind power sector is limited to a brief summary of recent developments. A
companion annual report funded by DOE that focuses exclusively on offshore wind energy also
will be published later this year.
Much of the data included in this report were compiled by Lawrence Berkeley National
Laboratory (Berkeley Lab) from a variety of sources, including the American Wind Energy
Association (AWEA), the U.S. Energy Information Administration (EIA), and the Federal
Energy Regulatory Commission (FERC). The Appendix provides a summary of the many data
sources used in the report, and a list of specific references follows the Appendix. Data on wind
power capacity additions in the United States (as well as wind power projects) are based largely
on information provided by AWEA, although minor methodological differences may yield
slightly different numbers from AWEA (2013a) in some cases. In other cases, the data shown
here represent only a sample of actual wind power projects installed in the United States;
furthermore, the data vary in quality. As such, emphasis should be placed on overall trends,
rather than on individual data points. Finally, each section of this document primarily focuses on
historical market information, with an emphasis on 2012; with some limited exceptions
(including the final section of the report), the report does not seek to forecast future trends.

2012 Wind Technologies Market Report
3
2. Installation Trends
Wind Power Additions Hit a New Record in 2012, with 13.1 GW of New
Capacity Added in the United States and $25 Billion Invested
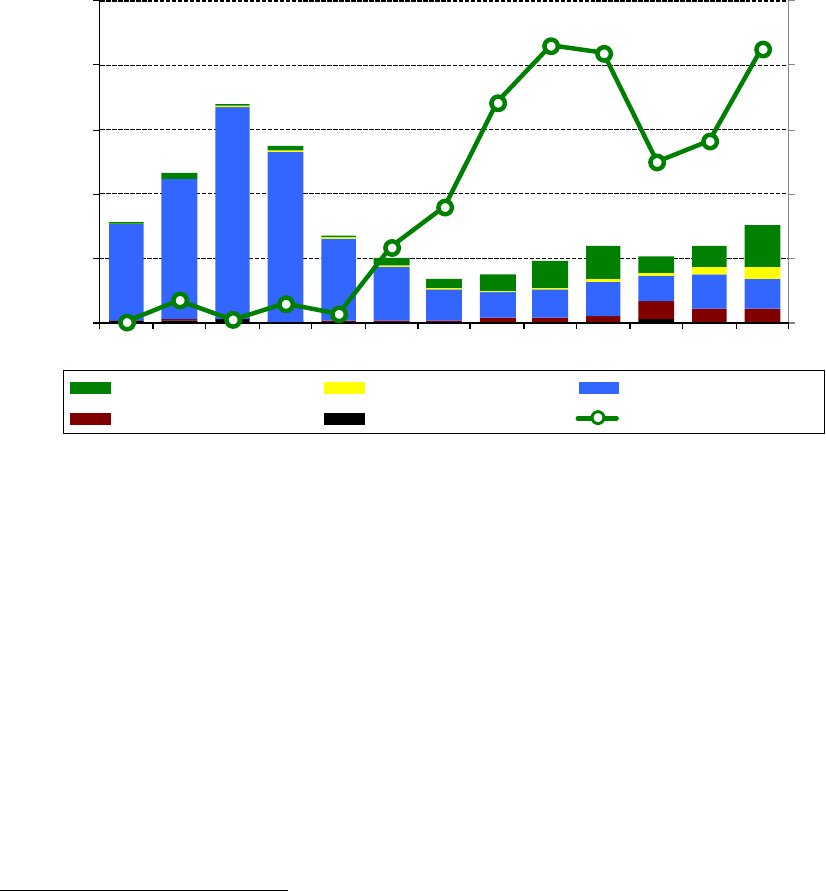
The U.S. wind power market achieved a new record in 2012, with 13,131 MW of new capacity
added, bringing the cumulative total to approximately 60,000 MW (Figure 1).
2
This growth
translates into $25 billion (real 2012 dollars) invested in wind power project installation in 2012,
for a cumulative investment total of $122 billion since the beginning of the 1980s (all cost and
price data are reported in real 2012$).
3
Wind power installations in 2012 were more than 90%
higher than in 2011 and 30% higher than the previous record in 2009. Cumulative wind power
capacity grew by 28% in 2012.
Source: AWEA project database
Figure 1. Annual and Cumulative Growth in U.S. Wind Power Capacity
Key factors driving growth in 2012 included continued state and federal incentives for wind
energy, the then-planned expiration of federal tax incentives at the end of 2012, and recent
improvements in the cost and performance of wind power technology. Bloomberg New Energy
Finance (Bloomberg NEF) reports that more than 11,000 MW of the wind power capacity added
in 2012 was commissioned in states without any near-term incremental RPS requirements
(Bloomberg NEF 2013a). These builds were instead driven by a desire to take advantage of
federal tax supports to either meet RPS targets after 2018 or because wind energy was deemed
economically attractive absent state RPS targets.
2
When reporting annual wind power capacity additions, this report focuses on gross capacity additions of large
wind turbines. The net increase in capacity each year can be somewhat lower, reflecting turbine decommissioning.
3
These investment figures are based on an extrapolation of the average project-level capital costs reported later in
this report and do not include investments in manufacturing facilities, research and development expenditures, or
O&M costs.
0
5
10
15
20
25
30
35
40
45
50
55
60
65
70
0
1
2
3
4
5
6
7
8
9
10
11
12
13
14
1998
1999
2000
2001
2002
2003
2004
2005
2006
2007
2008
2009
2010
2011
2012
Annual U.S. Capacity (left scale)
Cumulative U.S. Capacity (right scale)
Cumulative Capacity (GW)
Annual Capacity (GW)

2012 Wind Technologies Market Report
4
Small Wind Turbines
Small wind turbines can provide power directly to homes, farms, schools, businesses, and industrial
facilities, offsetting the need to purchase some portion of the host’s electricity from the grid; such
wind turbines can also provide power to off-grid sites. Wind turbines used in these applications are
sometimes much smaller than the larger-scale (larger than 100-kW) turbines that are the primary focus
of this report.
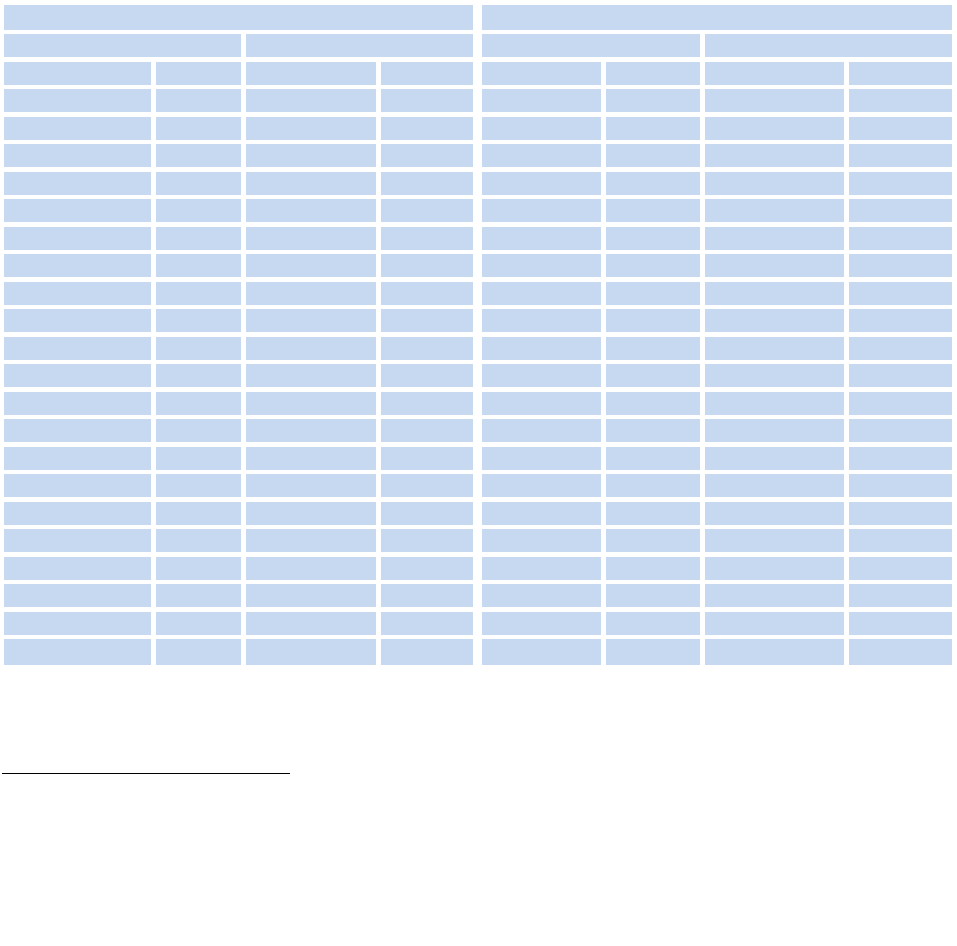
The table below summarizes sales of small (100-kW and smaller) wind turbines into the U.S. market
from 2003 through 2012. Roughly 18.4 MW of small wind turbines were sold in the United States in
2012, with 86% of that capacity manufactured by U.S. companies. These installation figures represent
a 3% decline in annual sales—in capacity terms—relative to 2011 and a larger decline relative to the
peak year of sales in 2010 (DOE 2013).
DOE (2013) reports that, within this market segment, there has been a general trend towards larger,
grid-tied systems: the average U.S. small wind turbine unit size nearly doubled, from 2.6 kW in 2011
to 5 kW in 2012, while off-grid sales claimed just 5% of 2012 small wind turbine capacity, down from
9% in 2011. The average installed cost of U.S. small wind turbines in 2012 was reportedly $6,960/kW,
up 15% from 2011. The largest markets in 2012 were located in Nevada, Iowa, Minnesota, Alaska,
and New York.
Year
Annual Sales of Small Wind Turbines (≤ 100 kW)
into the United States
Capacity Additions
Number of Turbines
2003
3.2 MW
3,200
2004
4.9 MW
4,700
2005
3.3 MW
4,300
2006
8.6 MW
8,300
2007
9.7 MW
9,100
2008
17.4 MW
10,400
2009
20.4 MW
9,800
2010
25.6 MW
7,800
2011
19.0 MW
7,300
2012
18.4 MW
3,700
Source: DOE (2013)
Sales in this sector historically have been driven—at least in part—by a variety of state incentive
programs, although several states scaled back or eliminated their small wind rebate programs in 2012.
In addition, wind turbines of 100 kW or smaller are eligible for an uncapped 30% federal investment
tax credit (ITC, in place through 2016). The Section 1603 Treasury Grant Program and programs
administered by the U.S. Department of Agriculture have also played a role in the sector.
Further information on small wind turbines, as well as the broader category of distributed wind power
that also includes larger turbines used in distributed applications, is available through a separate
annual report funded by DOE: 2012 Market Report on U.S. Wind Technologies in Distributed
Applications.
2012 Wind Technologies Market Report
5
Wind Power Represented the Largest Source of U.S. Electric-Generating
Capacity Additions in 2012
In 2012, wind power was—for the first time—the largest source of new generation capacity
added to the U.S. electrical grid in terms of gross capacity additions. Wind power contributed
roughly 43% of all U.S. generation capacity additions in 2012, overtaking natural gas-fired
generation as the leading source of new capacity.
4
This feat follows upon the 5 preceding years
during which wind power represented between 25% and 43% of new U.S. electric-generation
capacity in each year (Figure 2). The recent contributions from wind power are particularly
remarkable given persistently low natural gas prices for the last several years, illustrating the
impact of federal tax incentives and their planned expiration on wind power growth.
Source: EIA, Ventyx, AWEA, Interstate Renewable Energy Council, Solar Energy Industries Association/GTM Research, Berkeley
Lab
Figure 2. Relative Contribution of Generation Types in Annual Capacity Additions
EIA’s (2013a) reference-case forecast projects that total U.S. electricity supply will need to
increase at an average pace of roughly 40 TWh (1%) per year over the next decade in order to
meet demand growth. On an energy basis, the annual amount of electricity expected to be
generated by the new wind power capacity added in 2012 represents roughly 95% of this average
annual projected growth in supply. By extension, if wind power additions continued over the
next decade at the same pace as in 2012, then roughly 95% of the nation’s projected increase in
electricity generation over that period would be met with wind electricity. Although analysts do
not anticipate that level of future wind power capacity additions, it is nonetheless clear that a
significant portion of the country’s new generation needs is already being met by wind energy.
4
Data presented here are based on gross capacity additions, not considering retirements. Furthermore, it includes
only the 50 U.S. states, not U.S. territories.
0%
10%
20%
30%
40%
50%
0
20
40
60
80
100
2000
2001
2002
2003
2004
2005
2006
2007
2008
2009
2010
2011
2012
Total Annual Capacity Additions (GW)
Wind
Other Renewable
Gas
Coal
Other Non-Renewable
Wind (% of Total)
Wind Capacity Additions
(% of Total Annual Capacity Additions)

2012 Wind Technologies Market Report
6
The United States Narrowly Regained the Lead in Annual Wind Power
Capacity Additions in 2012 but Was Well Behind the Market Leaders in
Wind Energy Penetration
Led by growth in the U.S. market, a record of roughly 45,000 MW of wind power capacity was
added globally in 2012, up almost 8% from the additions experienced in 2011 and bringing the
cumulative total to more than 285,000 MW (Navigant 2013; Table 1).
5
In terms of cumulative
capacity, the United States ended the year with 21% of total global wind power capacity but is
now a distant second to China by this metric (Table 1).
6
Annual growth in cumulative capacity
was 28% for the United States and 19% globally.
After leading the world in annual wind power capacity additions from 2005 through 2008, and
then losing the mantle to China from 2009 through 2011, the United States narrowly regained the
global lead in 2012, followed closely by China (Table 1). The U.S. wind power market
represented roughly 29% of global installed capacity in 2012, a steep rise from the 16% in 2011
and 13% in 2010 and similar to the 26%–30% levels achieved from 2007 through 2009. China,
Germany, India, and the United Kingdom rounded out the top five countries in 2012 for annual
capacity additions.
Table 1. International Rankings of Wind Power Capacity
Annual Capacity
(2012, MW)
Cumulative Capacity
(end of 2012, MW)
United States
13,131
China
75,372
China
12,960
United States
60,005
Germany
2,415
Germany
31,467
India
2,336
Spain
22,462
United Kingdom
1,958
India
18,602
Italy
1,272
United Kingdom
9,113
Spain
1,112
Italy
7,998
Brazil
1,077
France
7,593
Canada
936
Canada
6,214
Romania
923
Portugal
4,363
Rest of World
6,838
Rest of World
42,368
TOTAL
44,958
TOTAL
285,558
Source: Navigant; AWEA project database for U.S. capacity
Growth in the U.S. market in 2012 was in large measure driven by then-scheduled cuts in federal
incentives. With that motivation not in place in 2013, the United States is not expected to be in
5
Yearly and cumulative installed wind power capacity in the United States are from the present report, while global
wind power capacity comes from Navigant (2013) but updated with the U.S. data presented here. Some
disagreement exists among these data sources and others, e.g., Windpower Monthly, the Global Wind Energy
Council, and AWEA.
6
Wind power additions and cumulative capacity in China are from Navigant (2013) and may include capacity that
was installed but that had not yet begun to deliver electricity by the end of 2012, due to a lack of coordination
between wind developers and transmission providers and the lengthier time that it takes to build transmission and
interconnection facilities. All of the U.S. capacity reported here, on the other hand, was capable of electricity
delivery.

2012 Wind Technologies Market Report
7
the global lead in 2013. In fact, the anticipated steep decline in U.S. wind power capacity
additions in 2013 is expected to result in a decline in aggregate global wind power additions in
2013 as well (e.g., GWEC 2013, Navigant 2013).
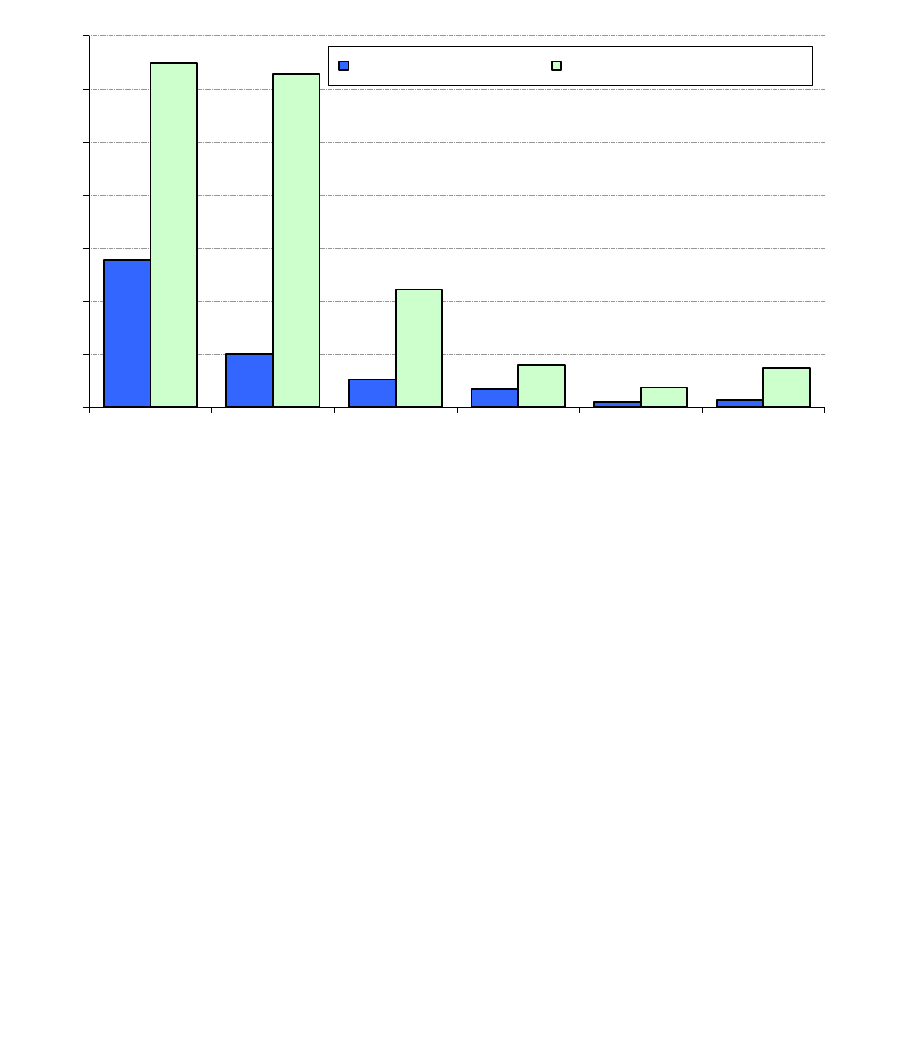
A number of countries have achieved relatively high levels of wind energy penetration in their
electricity grids. Figure 3 presents data on end-of-2012 (and end-of-2006/08/10/11) installed
wind power capacity, translated into projected annual electricity supply based on assumed
country-specific capacity factors and then divided by projected 2013 (and actual or projected
2007/09/11/12) electricity consumption. Using this approximation for the contribution of wind
power to electricity consumption, and focusing only on those countries with the greatest
cumulative installed wind power capacity, end-of-2012 installed wind power is estimated to
supply the equivalent of nearly 30% of Denmark’s electricity demand and approximately 18% of
Portugal and Spain’s demand, 16% of Ireland’s demand, and 10% of Germany’s demand. In the
United States, the cumulative wind power capacity installed at the end of 2012 is estimated, in an
average year, to equate to roughly 4.4% of the nation’s electricity demand.
7
On a global basis,
wind energy’s contribution is estimated to be 3.2%.
Source: Berkeley Lab estimates based on data from Navigant, EIA, and elsewhere
Figure 3. Approximate Wind Energy Penetration in the Countries with the Greatest
Installed Wind Power Capacity
7
In terms of actual 2012 deliveries, EIA reports that wind energy represented 3.5% of net electricity generation and
3.8% of national electricity consumption in the United States. These figures are below the 4.4% figure provided
above in part because 4.4% is a projection based on end-of-year 2012 wind power capacity.
0%
2%
4%
6%
8%
10%
12%
14%
16%
18%
20%
22%
24%
26%
28%
30%
Denmark
Portugal
Spain
Ireland
Germany
Greece
Romania
UK
Sweden
Netherlands
Italy
U.S.
India
Turkey
Poland
Australia
Canada
China
France
Brazil
Japan
TOTAL
Approximate Wind Penetration, end of 2012
Approximate Wind Penetration, end of 2011
Approximate Wind Penetration, end of 2010
Approximate Wind Penetration, end of 2008
Approximate Wind Penetration, end of 2006
Estimated Wind Generation as a
Proportion of Electricity Consumption

2012 Wind Technologies Market Report
8
Texas Added More New Wind Power Capacity than Any Other State, while
Nine States Exceed 12% Wind Energy Penetration
New large-scale
8
wind turbines were installed in 32 states, plus Puerto Rico, in 2012. With 1,826
MW installed in 2012, Texas edged out California to reclaim its lead in adding the most new
wind capacity. As shown in Figure 4 and Table 2, other leading states in terms of new capacity
(each with more than 1,000 MW) included California, Kansas, and Oklahoma. Twenty-two states
(plus Puerto Rico) added more than 100 MW each in 2012.
On a cumulative basis, Texas remained the clear leader among states, with 12,214 MW installed
at the end of 2012—more than twice as much as the next-highest state (California, with 5,542
MW). In fact, Texas has more installed wind capacity than all but five countries (including the
United States) worldwide. States (distantly) following Texas in cumulative installed capacity
include California, Iowa, Illinois, Oregon, and Oklahoma—all with more than 3,000 MW.
Thirty-four states, plus Puerto Rico, had more than 100 MW of wind capacity installed as of the
end of 2012, with 22 of these topping 500 MW, 15 topping 1,000 MW, and 10 topping 2,000
MW. Although all wind power projects in the United States to date have been installed on land,
offshore development activities continued in 2012, as discussed in the next section.
Note: Numbers within states represent cumulative installed wind capacity and, in brackets, annual additions in 2012.
Figure 4. Location of Wind Power Development in the United States
8
“Large-scale” turbines are defined consistently with the rest of this report, i.e., turbines larger than 100 kW.
2012 Wind Technologies Market Report
9
Some states are beginning to realize relatively high levels of wind energy penetration. The right
half of Table 2 lists the top 20 states based on both actual wind electricity generation in 2012 as
well as estimated wind electricity generation from end-of-2012 wind power capacity, both
divided by total in-state electricity generation in 2012.
9
Using either method, Iowa and South
Dakota lead the list, each with more than 20% wind penetration. With 1,441 MW of new wind
capacity installed during 2012, Kansas makes the largest jump from actual 2012 to estimated
end-of-2012 penetration—from 11.4% to 20.1%, respectively. As of the end of 2012, a total of
nine states had enough wind power capacity installed to supply more than 12% of all in-state
electricity generation in an average year.
Table 2. U.S. Wind Power Rankings: The Top 20 States
Capacity (MW)
Percentage of In-State Generation
Annual (2012)
Cumulative (end of 2012)
Actual (2012)*
Estimated (end of 2012)**
Texas
1,826
Texas
12,214
Iowa
24.5%
Iowa
25.3%
California
1,656
California
5,542
South Dakota
23.9%
South Dakota
23.9%
Kansas
1,441
Iowa
5,133
North Dakota
14.7%
Kansas
20.1%
Oklahoma
1,127
Illinois
3,568
Minnesota
14.3%
Minnesota
16.9%
Illinois
823
Oregon
3,153
Kansas
11.4%
Idaho
16.0%
Iowa
814
Oklahoma
3,134
Colorado
11.3%
North Dakota
15.6%
Oregon
640
Minnesota
2,987
Idaho
11.3%
Oklahoma
14.0%
Michigan
611
Washington
2,808
Oklahoma
10.5%
Colorado
13.1%
Pennsylvania
550
Kansas
2,713
Oregon
10.0%
Oregon
12.8%
Colorado
496
Colorado
2,301
Wyoming
8.8%
Wyoming
8.8%
Idaho
355
North Dakota
1,680
Texas
7.4%
Texas
8.3%
Ohio
315
New York
1,638
New Mexico
6.1%
Hawaii
8.0%
Minnesota
267
Indiana
1,543
Maine
5.9%
California
7.1%
Montana
258
Wyoming
1,410
Washington
5.8%
Montana
7.0%
New York
237
Pennsylvania
1,340
California
4.9%
Maine
6.6%
Washington
235
Michigan
988
Montana
4.5%
New Mexico
6.3%
North Dakota
235
Idaho
973
Illinois
3.9%
Washington
6.1%
Indiana
203
South Dakota
783
Nebraska
3.7%
Illinois
4.8%
Nevada
152
New Mexico
778
Hawaii
3.6%
Nebraska
4.3%
New Hampshire
147
Wisconsin
648
Indiana
2.8%
Vermont
3.7%
Rest of U.S.
743
Rest of U.S.
4,673
Rest of U.S.
0.6%
Rest of U.S.
0.8%
TOTAL
13,131
TOTAL
60,005
TOTAL
3.5%
TOTAL
4.2%
* Based on 2012 wind and total generation by state from EIA’s Electric Power Monthly.
** Based on a projection of wind electricity generation from end-of-2012 wind power capacity, divided by total in-state electricity
generation in 2012.
Source: AWEA project database, EIA, Berkeley Lab estimates
9
Wind energy penetration can either be expressed as a percentage of in-state load or in-state generation. In-state
generation is used here, primarily because wind energy (like other energy resources) is often sold across state lines,
which tends to distort penetration levels expressed as a percentage of in-state load. The actual penetration of wind
electricity generation in 2012 is based exclusively on preliminary EIA data for 2012 and matches what AWEA
provides in AWEA (2013a). For the estimated penetration—which captures the full, rather than partial, impact of
new wind power capacity added in 2012—end-of-2012 wind power capacity is translated into estimated annual wind
generation based on estimated state-specific capacity factors that derive from the project performance data reported
later in this report. The resulting state-specific wind electricity generation estimates are then divided by preliminary
EIA data on total in-state electricity generation in 2012.

2012 Wind Technologies Market Report
10
No Commercial Offshore Turbines Have Been Commissioned in the United
States, but Offshore Project and Policy Developments Continued in 2012
10
At the end of 2012, global cumulative offshore wind power capacity stood at roughly 5,117 MW
(Navigant 2013), with Europe (and to a much lesser extent, China) being the primary locus of
activity. In 2012, 1,131 MW of new offshore wind power capacity was commissioned, up from
just 470 MW in 2011, with Navigant (2013) projecting that almost 3,000 MW are likely to be
installed in 2013.
No commercial offshore projects have been installed in the United States, and the emergence of a
U.S. market faces both challenges and opportunities. Perhaps most importantly, the projected
near-term cost of offshore wind energy remains high. Additionally, planning, siting, and
permitting can be challenging. At the same time, interest in developing offshore wind energy
exists in several parts of the country. Driving this interest is the proximity of offshore wind
resources to population centers, the potential for local economic development benefits, and
superior capacity factors compared to the finite set of developable land-based wind power
projects available in some regions. Moreover, significant strides continue to be made in the
federal arena, both through the U.S. Department of the Interior’s responsibilities with regards to
regulatory approvals and DOE’s investments in offshore wind energy research and development
(which includes funding seven advanced demonstration project partnerships).
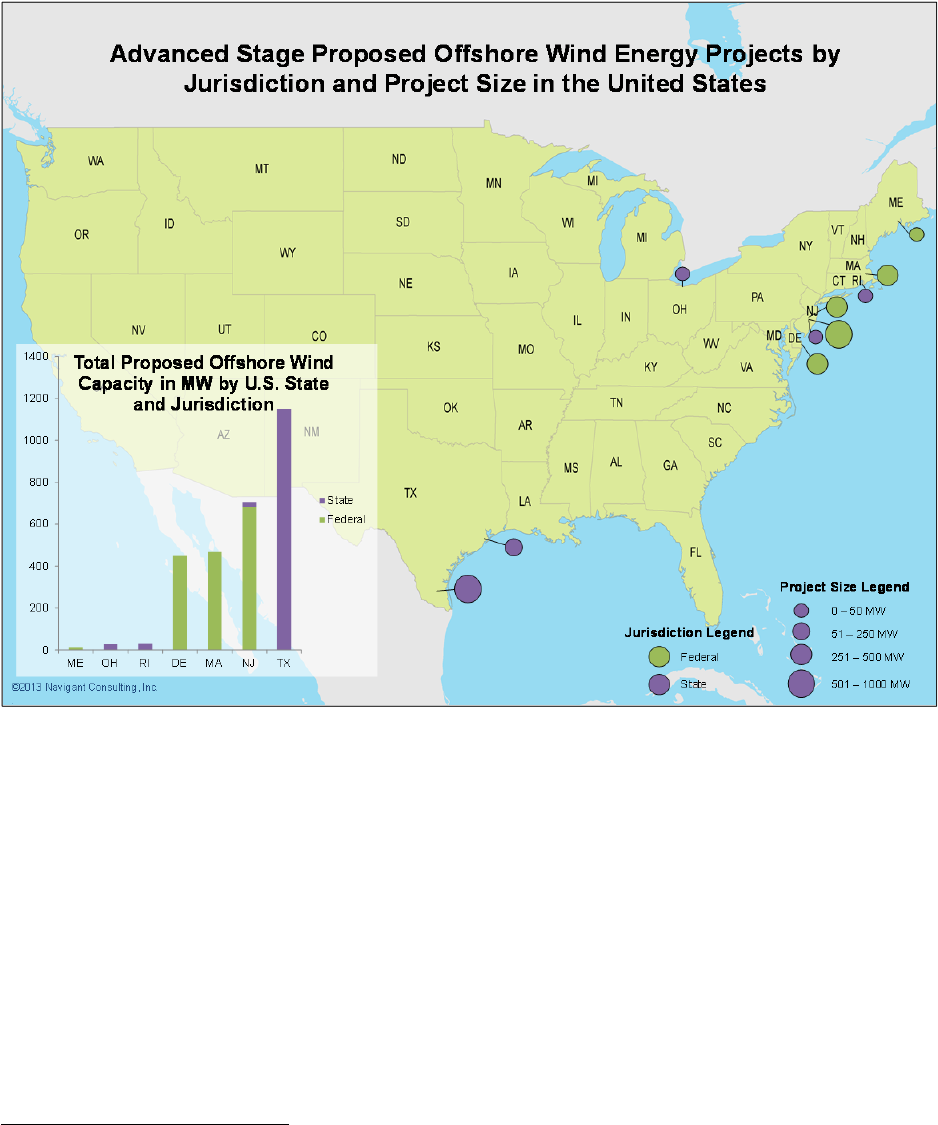
Figure 5 identifies 10 proposed offshore wind power projects in the United States that have been
identified by Navigant Consulting as being more advanced in the development process;
generally, this includes projects that have a signed PPA, have received approval for an interim
limited lease or a commercial lease in state or federal waters, and/or have conducted baseline or
geophysical studies at the proposed site with a meteorological tower erected and collecting data,
boreholes drilled, or geological and geophysical data acquisition systems in place. In total, these
projects equal 2,840 MW of anticipated capacity and are primarily located in the Northeast, Mid-
Atlantic, and Gulf of Mexico, with one project located in the Great Lakes. It is not certain which
of these projects will ultimately come to fruition, while many other proposed projects not listed
in Figure 5 are in earlier planning phases.
Of the projects identified in Figure 5, two have signed PPAs: Cape Wind (Massachusetts) and
Deepwater Wind (Rhode Island); Cape Wind signed a second PPA in 2012. Moreover, with the
extension of the production tax credit (PTC) and ITC to wind power projects that begin
construction by the end of 2013, both of these projects may seek to qualify by initiating
construction activities this year. In addition, the terms of a PPA for the Statoil (Maine) project
have been approved by the state public utilities commission. Also in Maine, in June 2013 the
first small, 1:8 scale-model prototype floating offshore wind turbine was deployed. Also of note,
and potentially impacting future developments, in 2013 Maryland passed legislation that will
establish a set-aside for roughly 200 MW of offshore wind power in the state’s RPS.
10
A companion annual report funded by DOE that focuses exclusively on offshore wind will be published later this
year and will provide a detailed summary of the status of the offshore wind sector in the United States.
2012 Wind Technologies Market Report
11
Figure 5. Proposed Offshore Wind Power Projects in a Relatively Advanced State of
Development
Data from Interconnection Queues Demonstrate that an Enormous Amount
of Wind Power Capacity Is Under Consideration but that Relative Interest in
Wind May Be Declining
One testament to the continued interest in land-based wind energy is the amount of wind power
capacity currently working its way through the major transmission interconnection queues across
the country. Figure 6 provides this information for wind power and other resources aggregated
across 42 different interconnection queues administered by independent system operators (ISOs),
regional transmission organizations (RTOs), and utilities.
11
These data should be interpreted with
11
The queues surveyed include PJM Interconnection (PJM), Midcontinent Independent System Operator (MISO),
New York ISO (NYISO), ISO-New England (ISO-NE), California ISO (CAISO), Electric Reliability Council of
Texas (ERCOT), Southwest Power Pool (SPP), Western Area Power Administration (WAPA), Bonneville Power
Administration (BPA), and 33 other individual utilities. To provide a sense of sample size and coverage, the ISOs,
RTOs, and utilities whose queues are included here have an aggregated non-coincident (balancing authority) peak
demand of more than 85% of the U.S. total. Figures 6 and 7 only include projects that were active in the queue at the
end of 2012 but that had not yet been built; suspended projects are not included.
2012 Wind Technologies Market Report
12
caution: although placing a project in the interconnection queue is a necessary step in project
development, being in the queue does not guarantee that a project actually will get built. In fact,
projects currently in interconnection queues are often early in the development process. As a
result, efforts have been made by FERC, ISOs, RTOs, and utilities to reduce the number of
speculative projects that have—in recent years—clogged these queues. One consequence of
those efforts, as well as perhaps the uncertain magnitude of the future U.S. wind market, is that
the total amount of wind power capacity in the nation's interconnection queues has declined
dramatically in recent years.
Source: Exeter Associates review of interconnection queues
Figure 6. Nameplate Resource Capacity in 42 Selected Interconnection Queues
Even with this important caveat, the amount of capacity in the nation’s interconnection queues
still provides at least some indication of the amount of wind power development that is in the
planning phase. At the end of 2012, even after reforms by a number of ISOs, RTOs, and utilities
to reduce the number of projects in their queues, there were 125 GW of wind power capacity
within the interconnection queues reviewed for this report—more than two times the installed
wind power capacity in the United States. This 125 GW represented 37% of all generating
capacity within these selected queues at that time and was slightly lower than the 130 GW of
natural gas in the queues. In 2012, 20 GW of gross wind power capacity entered the
interconnection queues, compared to 55 GW of natural gas and 10 GW of solar; lower quantities
of nuclear and coal capacity entered these queues in 2012.
Of note, however, is that the absolute amount of wind, coal, and nuclear power in the sampled
interconnection queues (considering gross additions and project drop-outs) has generally
declined in recent years, whereas natural gas and solar capacity has increased. Since 2009, for
example, the amount of wind power capacity has dropped by 59%, coal by 76%, and nuclear by
45%, whereas solar capacity has increased by 31% and natural gas by 17%.
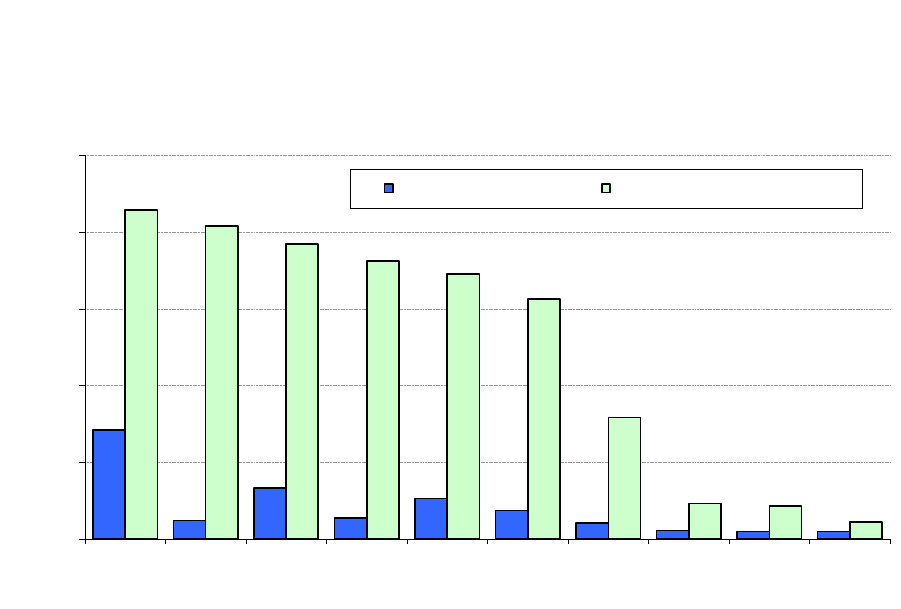
Much of this wind power capacity is planned for Texas, the Northwest, Southwest Power Pool
(SPP), PJM Interconnection, the Midwest, the Mountain region, and California; wind power
0
20
40
60
80
100
120
140
Natural Gas Wind Solar Nuclear Coal Other
Nameplate Capacity (GW)
Entered queue in 2012 Total in queue at end of 2012
2012 Wind Technologies Market Report
13
projects in the interconnection queues in these regions at the end of 2012 accounted for more
than 95% of the aggregate 125 GW of wind power in the selected queues (Figure 7). Smaller
amounts of wind power capacity were represented in the interconnection queues of the New
York ISO (NYISO, 1.8%), ISO-New England (ISO-NE, 1.7%), and the Southeast (0.9%).
Source: Exeter Associates review of interconnection queues
Figure 7. Wind Power Capacity in 42 Selected Interconnection Queues
As a measure of the near-term development pipeline, Ventyx (2013) estimates that—as of early
June 2013—approximately 28 GW of wind power capacity was either under construction or in
site preparation (2 GW of the 28 GW total), in development and permitted (12 GW of the 28
GW), or in development with pending permit and/or regulatory applications (the remaining 14
GW of the 28 GW total). This total is less than the 40 GW that was in the development pipeline
as of last year at approximately the same time (June 2012), perhaps as a result of 2012’s record
deployment year and continued uncertainty about future PTC extensions. AWEA (2013b),
meanwhile, reports just 1.6 MW of wind power capacity installed in the first quarter of 2013,
with another 537 MW under construction as of the end of March 2013.
0
5
10
15
20
25
ERCOT Northwest SPP PJM MISO /
Midwest
Mountain California New York
ISO
ISO-New
England
Southeast
Nameplate Wind Power Capacity (GW)
Entered queue in 2012 Total in queue at end of 2012
2012 Wind Technologies Market Report
14
3. Industry Trends
The “Big Three” Turbine Suppliers Captured more than 70% of the U.S.
Market in 2012, yet Diversification Continues
GE Wind led the U.S. market with more than 5 GW of wind turbines newly installed in 2012, for
a 38% market share.
12
Notably, GE Wind’s 1.5/1.6+ MW wind turbine remained the nation’s
most-popular turbine in 2012, with 2,749 units installed (505 of the 1.5-MW version and 2,224
of the 1.6/1.62/1.68-MW models), equating to 33% of all wind power capacity installed in
2012.
13
Following GE Wind and rounding out the top 10 were Siemens (with a 20% market share),
Vestas (14%), Gamesa (10%), REpower (5%),
14
Mitsubishi (3%), Nordex and Clipper (both at
2%), and Acciona and Suzlon (both at 1%). These top 10 manufacturers accounted for 97% of all
new wind power capacity installed in the United States in 2012. Three other manufacturers
installed more than 50 MW each in the United States in 2012—Goldwind (154.5 MW), DeWind
(140 MW), and China Creative Wind Energy (61.2 MW)—while another 14 installed at least one
utility-scale (larger than 100-kW) turbine.
15
The list of turbine suppliers serving the U.S. market
has become increasingly global in nature, with manufacturers no longer just from the United
States, Europe, Japan, and India, but now also from China and South Korea.
Source: AWEA project database
Figure 8. Annual U.S. Market Share of Wind Manufacturers by MW, 2005–2012
12
Market share reported here is in MW terms and is based on project installations in the year in question, not turbine
shipments or orders.
13
A number of preexisting GE 1.5-MW turbines installed in earlier years have been upgraded to 1.6 MW, but data
on how many or which turbines have been upgraded are not publicly available, and so this change in nameplate
capacity is not reflected in the data presented in this report.
14
As of October 2011, REpower became a wholly owned subsidiary of Suzlon.
15
These 14 include Guodian United Power (9 MW), Sinovel (4.5 MW), Hyundai (4 MW), HZ Windpower (4 MW),
PowerWind (3.6 MW), Vensys (3 MW), Emergya Wind Technologies (2.7 MW), Kenersys (2.5 MW), Aeronautica
(2.25 MW), Sany Electric (2 MW), Nordic Windpower (2 MW), Leitner-Poma (1.5 MW), Turbowinds (0.6 MW),
and Siva (0.25 MW).
0%
10%
20%
30%
40%
50%
60%
70%
80%
90%
100%
2005 2006 2007 2008 2009 2010 2011 2012
Other
Suzlon
Acciona
Clipper
Nordex
Mitsubishi
REpower
Gamesa
Vestas
Siemens
GE Wind
Turbine Manufacturer U.S. Market Share

2012 Wind Technologies Market Report
15
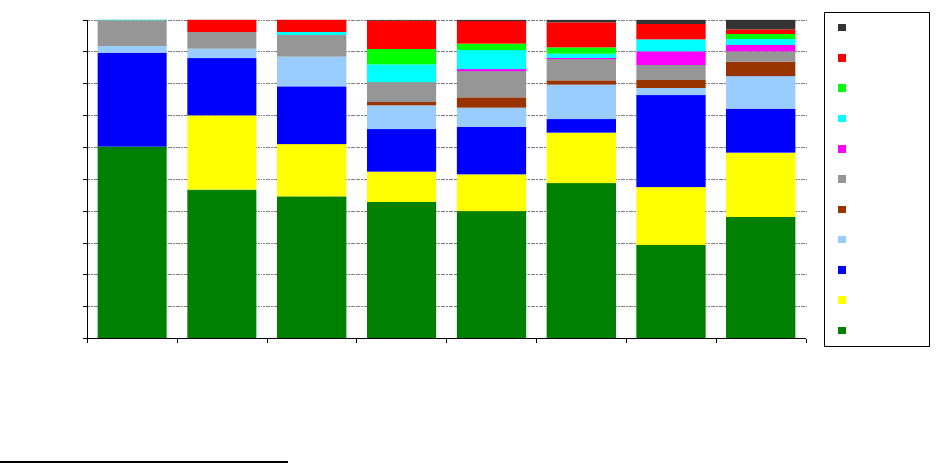
Figure 8 and Table 3 also depict a notable increase in the number of wind turbine manufacturers
serving the U.S. market since 2005, when just five manufacturers (compared to 25 in 2012)
installed more than 1 MW and just four manufacturers captured 99% of the market (compared to
the 12 it took to reach 99% in 2012). Despite steady growth in the number of turbine
manufacturers serving the U.S. market over time, however, the “big three” turbine suppliers—
GE Wind, Vestas, and Siemens—have, in aggregate, actually gained market share since
2008/2009 (from 66% in both 2008 and 2009 up to 72% in 2012, which is down from 76% in
2011), reversing some of their earlier losses through 2008. This recapture may, in part, reflect a
legacy of the financial crisis (i.e., a heightened preference among investors for projects using
“bankable” turbines), coupled with ample turbine supply (relative to demand), which reduces the
need to consider less-bankable technology.
Table 3. Annual U.S. Turbine Installation Capacity, by Manufacturer
Source: AWEA project database
Globally, U.S.-owned GE ascended to an effective tie with Vestas as the top supplier of turbines
worldwide in 2012, with Siemens taking third place. No other U.S.-owned manufacturer cracked
the top 15.
16
On a worldwide basis, Chinese turbine manufacturers continued to occupy positions
of prominence, although—in contrast to 2011—none of these suppliers resided in the top five;
Chinese manufacturers occupied the 7
th
through 10
th
spots in the global rankings in 2012.
To date, the global growth of Chinese turbine manufacturers has been based almost entirely on
sales to the Chinese market. With the Chinese market beginning to cool, however, Chinese (and
South Korean) manufacturers have begun to look abroad and penetrate the international wind
turbine market, including limited sales in Europe, Canada, and the United States. In the United
States, for example, 2012 installations by Chinese and South Korean manufacturers included
those from Goldwind (154.5 MW), China Creative Wind Energy (61.2 MW), Guodian United
16
These statements emphasize the sale of large wind turbines. U.S. manufacturers are major players in the global
market for smaller-scale turbines (DOE 2013).
Manufacturer
Turbine Installations (MW)
2005
2006
2007
2008
2009
2010
2011
2012
GE Wind
1,431
1,146
2,342
3,585
3,995
2,543
2,006
5,014
Siemens
0
573
863
791
1,162
828
1,233
2,638
Vestas
699
439
948
1,120
1,489
221
1,969
1,818
Gamesa
50
74
494
616
600
566
154
1,341
REpower
0
0
0
94
330
68
172
595
Mitsubishi
190
128
356
516
814
350
320
420
Nordex
0
0
3
0
63
20
288
275
Clipper
3
0
48
470
605
70
258
250
Acciona
0
0
0
410
204
99
0
195
Suzlon
0
92
198
738
702
413
334
187
Other
2
2
2
23
43
41
86
398
TOTAL
2,374
2,453
5,253
8,362
10,005
5,220
6,819
13,131

2012 Wind Technologies Market Report
16
Power (9 MW), Sinovel (4.5 MW), Hyundai and HZ Windpower (4 MW each), and Sany
Electric (2 MW). Many of these early installations have been developed and financed by the
turbine suppliers themselves, and until there is sufficient operating experience to mitigate
uncertainty over turbine quality and bankability, widespread entry by Chinese suppliers into the
U.S. market seems unlikely.
The Manufacturing Supply Chain Responded to a Record Year in Wind
Power Capacity Additions, but with Substantial Growing Pains
With a record year of wind power additions in 2012, and an anticipated slow-down thereafter,
the wind industry’s domestic supply chain dealt with conflicting pressures this past year. As the
cumulative capacity of wind projects has grown, foreign and domestic turbine and component
manufacturers have localized and expanded operations in the United States. But with reduced
short-term demand expectations, the prospects for further supply-chain expansion have dimmed.
As a result, although manufacturers met the challenge of supplying a 13-GW market in 2012, the
late extension of the PTC in January 2013 found some manufacturers with already reduced
workforces or closed facilities in preparation for lower demand in the near future.
Figure 9 presents a non-exhaustive list of the more than 160 wind turbine and component
manufacturing and assembly facilities operating in the United States at the end of 2012.
17
Due
to near-term demand uncertainty, not only did a smaller number of new turbine and component
manufacturing facilities open in 2012 (7) than in 2011 (16), but also, as discussed further
below, a number of facilities closed in 2012. Moreover, unlike in previous years, no major new
announcements were made in 2012 about prospective future wind turbine and component
manufacturing and assembly facilities.
None of the new plant openings in 2012 is owned by major international wind turbine original
equipment manufacturers (OEMs). Nonetheless, seven of the 10 OEMs with the largest share
of the U.S. market in 2012 (Acciona, Clipper, Gamesa, GE, Nordex, Siemens, and Vestas) had
one or more operational manufacturing facilities in the United States in 2012; the three top-10
OEMs that did not have U.S. manufacturing facilities in 2012 include Mitsubishi, REpower,
and Suzlon, whereas Clipper ceased manufacturing for the wind industry in 2012. Companies
with multiple facilities include Gamesa, GE, Siemens, and Vestas. Other active domestic and
foreign OEMs that have sold larger turbines in the U.S. market and that have established U.S.
manufacturing facilities include Alstom, DeWind, Northern Power Systems, and Aeronautica,
while still other companies have announced their future interest in domestic manufacturing.
Although new supply-chain investments may have slowed in 2012, in contrast to the multiple
OEMs operating in the United States in 2012, only 8 years earlier (2004) there was only one
active utility-scale wind energy OEM assembling nacelles in the United States (GE).
18
17
The data on existing, new, and announced manufacturing facilities presented here differ from those presented in
AWEA (2013a) due, in part, to methodological differences. For example, AWEA (2013a) has access to data on a
large number of smaller component suppliers that are not included in this report; the figure presented here also does
not include research and development and logistics centers.
18
Nacelle assembly is defined here as the process of combining the multitude of components included in a turbine
nacelle to produce a complete turbine nacelle unit.
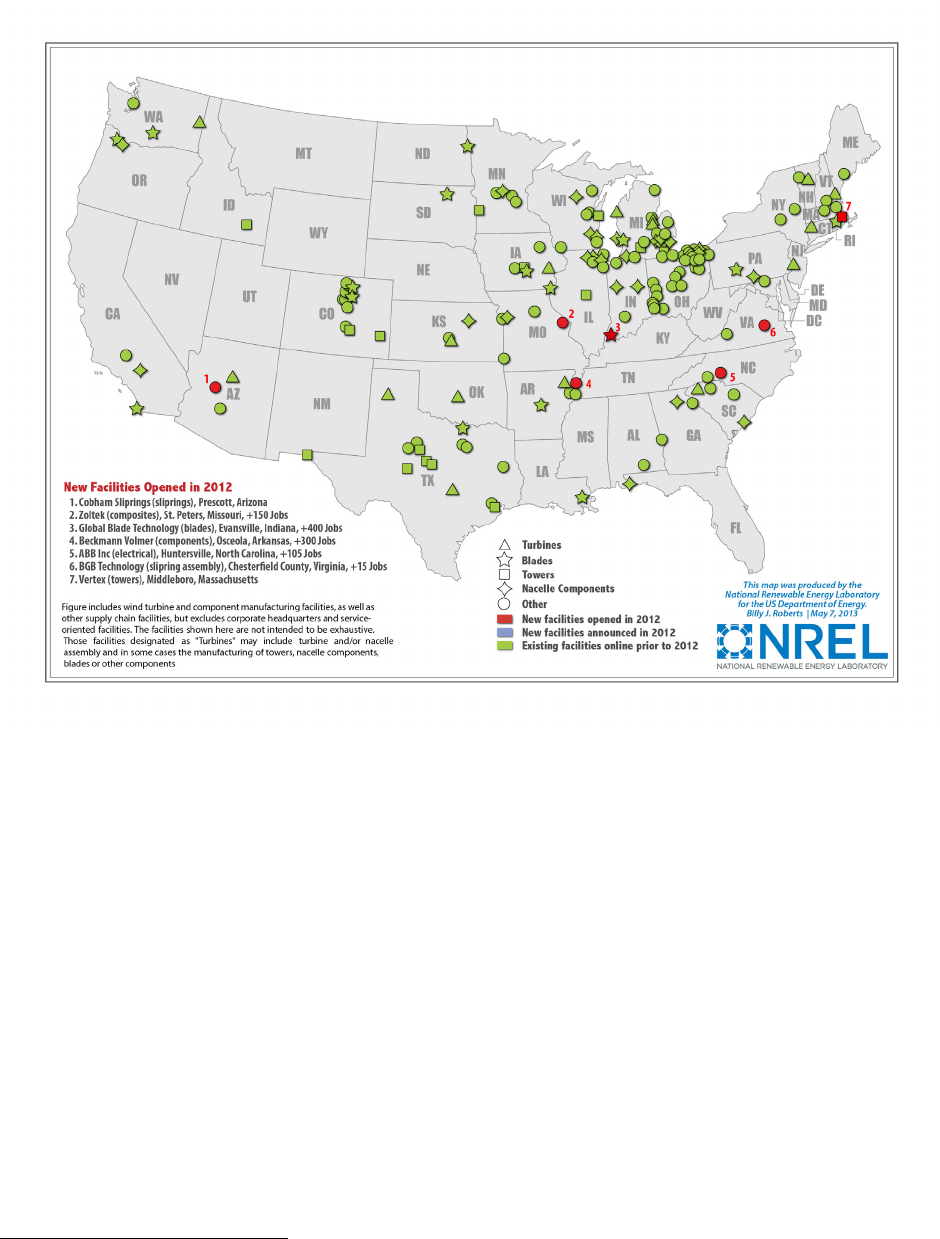
2012 Wind Technologies Market Report
17
Figure 9. Location of Existing and New Turbine and Component Manufacturing Facilities
Domestic turbine nacelle assembly capability—defined here as the maximum nacelle assembly
capability of U.S. plants if all were operating at maximum utilization—grew to exceed 12 GW
in 2012 and is expected by Bloomberg NEF (2013a) to drop to 10 GW in 2013 and 2014. Even
with this expected decline, near-term forecasts for U.S. wind power additions (see Chapter 8,
“Future Outlook”) suggest that the market will have an over-capacity of nacelle assembly
capability in the short term relative to U.S. turbine installations, in contrast to 4 GW of under-
capacity in 2009 and 1 GW of under-capacity in 2012 (Figure 10). Because maximum factory
utilization is uncommon, and because of turbine exports from the United States, some level of
domestic over-capacity should not be considered problematic. On the other hand, actual over-
capacity may be greater because U.S. demand for wind turbines is also partially met with
imports from other countries (see next section).
19
19
Exports of wind turbines from U.S. nacelle assembly facilities to other countries have the ability to reduce the
estimated over-capacity, but as shown in the next section, U.S. exports have been relatively modest to date.
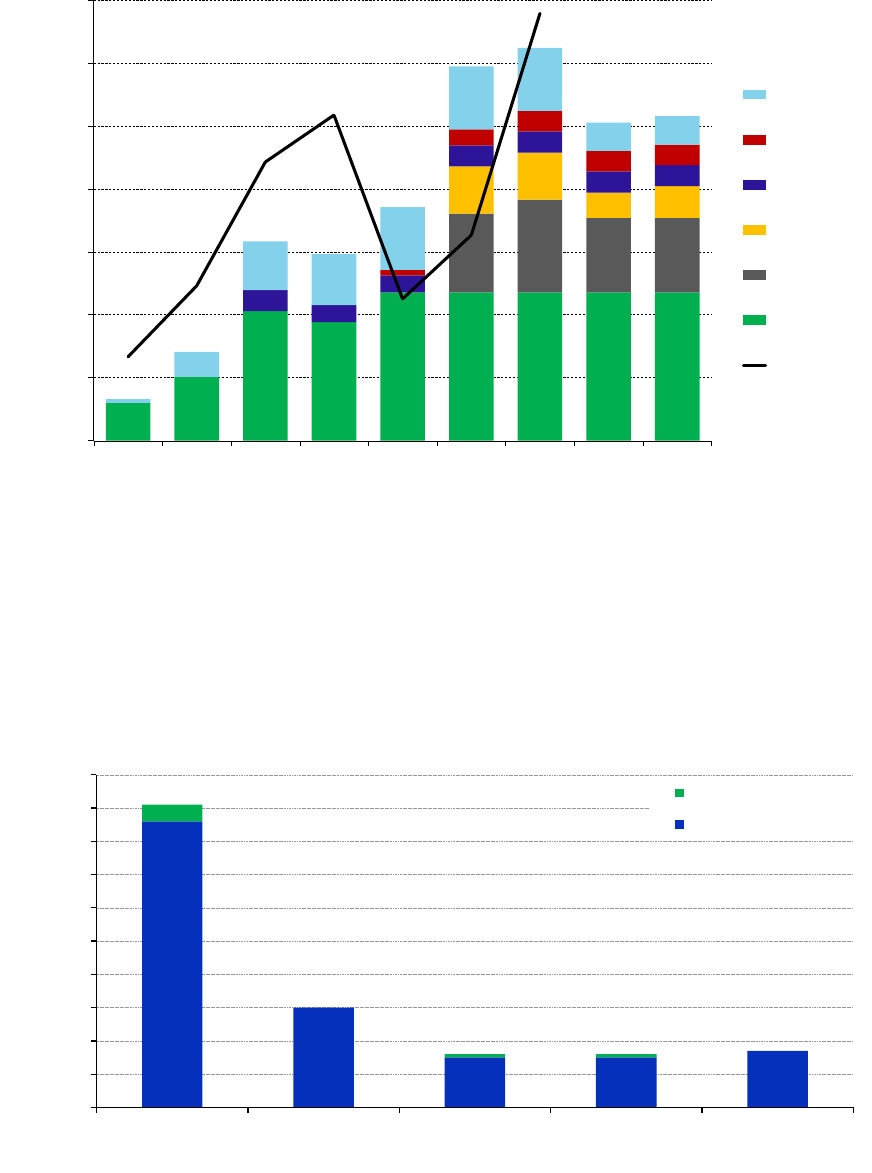
2012 Wind Technologies Market Report
18
Source: Bloomberg NEF
Figure 10. Domestic Wind Turbine Nacelle Assembly Capacity vs. U.S. Wind Turbine
Installations
Figure 11 segments the manufacturing facilities in the United States by major component,
including those that opened prior to and in 2012. The seven new facilities are all related to
component manufacturing, including one blade and one tower facility. In addition to the nacelle
assembly capability noted above, AWEA (2013a) reports that U.S. manufacturing facilities
have the capability to produce 12,500 individual blades and 3,800 towers annually.
Note: Manufacturing facilities that produce multiple components are included in multiple bars.
Source: National Renewable Energy Laboratory
Figure 11. Number of Operating Wind Turbine and Component Manufacturing Facilities in
the United States
0
2
4
6
8
10
12
14
2006
2007
2008 2009 2010 2011
2012 2013e
2014e
Wind Turbine Nacelle Assembly Capacity in the
U.S. (and Wind Turbine Installations) (GW)
Other
Nordex
Acciona
Siemens
Vestas
GE
U.S. Turbine
Installations
0
10
20
30
40
50
60
70
80
90
100
Other Nacelle
Components
Towers Blades Turbines
Number of Manufacturing Facilities
Opened in 2012
Open before 2012

2012 Wind Technologies Market Report
19
Turbine and component manufacturing facilities are spread across the country, with a number
of component manufacturers choosing to locate in markets with substantial wind power
capacity or near already established large-scale OEMs. However, even states that are relatively
far from major wind power markets—including several states in the Southeast—have seen
wind turbine and component manufacturing facilities come online in recent years. Workforce
considerations, transportation costs, and state and local incentives are among the factors that
typically drive location decisions. As an example of this regional diversity, the new component
manufacturing facilities that were opened in 2012 are located in seven different states, only one
of which has more than 1,000 MW of installed wind power capacity.
AWEA (2013a) estimates that the wind energy industry directly and indirectly employed
80,700 full-time
20
workers in the United States at the end of 2012—approximately 5,700 more
jobs than reported in 2011 but fewer than the peak number of jobs reported in 2008 and 2009.
The 80,700 jobs include manufacturing, project development, construction and turbine
installation, O&M, transportation and logistics, and financial, legal, and consulting services.
Manufacturing jobs saw an overall decrease, from 30,000 in 2011 to 25,500 in 2012, due to the
severe decline in new orders towards the end of 2012, while construction jobs increased to
respond to the record new build in 2012.
Reflecting the challenging business environment towards the end of 2012 and lack of new
orders, at least 12 existing wind turbine or component manufacturing facilities were closed or
left the wind industry in 2012. This includes two turbine OEMs (the second-largest U.S.-owned
manufacturer, Clipper, as well as Nordic; Suzlon ceased its domestic manufacturing in 2011,
while Mitsubishi put on hold its plans for U.S. manufacturing in early 2012
21
) and five tower
manufacturers in eight different locations (Aerisyn, Ameron, DMI, Katana, and Trinity). At the
same time, compression of turbine OEM and component manufacturer profit margins continued
in 2012, with many manufacturers experiencing net losses and therefore executing corporate
realignments and other cost-cutting strategies. As a result, in addition to those companies and
facilities that ceased operations, numerous others experienced layoffs or furloughs in 2012, with
a majority of the staffing reductions taking place towards the end of the year. Those impacted
include, but are not limited to, three major turbine OEMs: Vestas, Siemens, and Gamesa.
Although manufacturers have now begun receiving orders for 2013 and 2014 delivery, it is not
yet clear to what degree these orders will lead to a recovery of the manufacturing sector in 2013.
20
Jobs are reported as full-time equivalents. For example, two people working full-time for 6 months are equal to
one full-time job in that year.
21
In addition, Nordex announced in June 2013 that it would close it turbine manufacturing plant in Jonesboro,
Arkansas.

2012 Wind Technologies Market Report
20
Despite Challenges, a Growing Percentage of the Equipment Used in U.S.
Wind Power Projects Has Been Sourced Domestically in Recent Years
Despite strain throughout the domestic supply chain, the import share of wind turbines and
selected components has dropped in recent years, while the share of selected domestically
manufactured wind power equipment has witnessed corresponding growth. These trends are
supported by data on wind power equipment trade from the U.S. Department of Commerce.
22
Figure 12 presents calendar-year data on estimated imports to the United States of wind-related
equipment from 2006 through 2012.
23
Specifically, the figure shows imports of wind-powered
generating sets (i.e., nacelles and, when imported with the nacelle, other turbine components) as
well as imports of select turbine components that are shipped separately from the generating
sets.
24
The separate importation of selected wind turbine components includes towers, generators
(and generator parts), blades and hubs, and gearboxes. Prior to 2012, estimates provided for
many of these component-level imports should be viewed with caution because the underlying
data used to produce the figure are based on trade categories that were not exclusive to wind
energy (e.g., they could include generators for non-wind applications). The component-level
import estimates shown in Figure 12 therefore required assumptions about the fraction of larger
trade categories likely to be represented by wind turbine components; the error bars included in
the figure account for uncertainty in these assumed fractions.
25
By 2012, however, many of the
22
The Department of Commerce trade data are accessed through the U.S. International Trade Commission’s
(USITC) DataWeb, which compiles statistics from the Department of Commerce on imports and exports. The
statistics can be queried online at: http://dataweb.usitc.gov/
. Much of the analysis presented here relies on the
“customs value” of imports as opposed to the “landed value” and hence does not include costs relating to shipping or
duties. For more information on these data and their application to wind energy, see David (2009, 2010, 2011).
23
“Wind-powered generating sets” are in Harmonized Tariff Schedule (HTS) 8502.31.0000. This HTS provision
includes both utility-scale and small wind turbines. Prior to 2012, estimating separate wind turbine component
imports is complicated by the fact that the HTS does not contain provisions that are exclusive to wind turbine
components. Included in the analysis presented here are: HTS 7308.20.0000—“towers and lattice masts” (available
for years 2006–2010, not exclusive to wind turbine components); HTS 7308.20.0020—“towers and lattice masts -
tubular” (available for 2011–2012, virtually all for wind turbines); HTS 8501.64.0020—“AC generators (alternators)
from 750 to 10,000 kVA” (available for 2006–2011, not exclusive to wind turbine components); HTS
8501.64.0021—“AC generators (alternators) from 750 to 10,000 kVA for Wind-powered Generating sets” (available
for 2012 only, exclusive to wind turbine components); HTS 8412.90.9080—“other parts of engines and motors”
(available for 2006–2011, not exclusive to wind turbine components); HTS 8412.90.9081—“wind turbine blades
and hubs” (available for 2012 only, exclusive to wind turbine components); HTS 8503.00.9545—“parts of
generators (other than commutators, stators, and rotors)” (available for 2006–2011, not exclusive to wind turbine
components); HTS 8503.00.9546—“parts of generators for wind-powered generating sets” (available for 2012 only,
exclusive to wind turbine components); HTS 8483.40.5010—“fixed ratio speed changers” (available for all years,
not exclusive to wind turbine components); and HTS 8483.40.5050—“multiple and variable ratio speed changers”
(available for all years, not exclusive to wind turbine components).
24
Wind turbine components such as blades, towers, generators, and gearboxes are included in the data on wind-
powered generating sets if shipped with the nacelle. Otherwise, these component imports are reported separately.
25
Assumptions were made for the proportion of wind-related equipment in each of the larger HTS trade categories
based on an analysis of recent data where separate, wind-specific trade categories exist; a review of the countries of
origin for the imports; personal communications with USITC and AWEA staff; USITC trade cases (ITC 2012, ITC
2013); and import patterns in the larger HTS trade categories. These assumptions generally reflect the rapidly
increasing imports of wind equipment from 2006–2008, the subsequent decline in imports from 2008–2010, and the
slight increase from 2010–2012. To reflect uncertainty in these proportions, a ±10% variation is applied to the larger
trade categories that include wind turbine components other than gearboxes, and a ±20% variation is applied to the

2012 Wind Technologies Market Report
21
trade categories were either specific to or largely restricted to wind power: wind-specific
generators (and generator components), wind-specific blades and hubs, and tubular towers. As
such, by 2012, only the trade category for gearboxes was not specific to wind energy; the error
bar for 2012 is hence narrower than in earlier years and is fully attributable to gearboxes.
Source: Berkeley Lab analysis of data from USITC DataWeb: http://dataweb.usitc.gov
Figure 12. Estimated Imports of Wind-Powered Generating Sets, Towers, Wind
Generators, Wind Blades and Hubs, and Other Wind Turbine Components, as well as
Exports of Wind-Powered Generating Sets
As shown, estimated imports of wind-related equipment into the United States in these trade
categories substantially increased from 2006–2008, before falling dramatically through 2010 and
then increasing somewhat in 2011 and 2012. These overall trends are driven primarily by
changes in the share of domestically manufactured wind turbines and components (versus
imports) as well as changes in the annual rate of wind power capacity installations and wind
turbine prices. To the extent that imports of wind turbine component parts occur in additional,
broad trade categories not captured by those included in Figure 12, the data presented here may
understate the amount of aggregate wind equipment imports into the United States.
Figure 12 also shows that exports of wind-powered generating sets from the United States have
increased over time, rising from $16 million in 2007 to $150 million in 2010, staying relatively
constant in 2011, and then increasing substantially in 2012 to $388 million. The largest
destination markets for these exports over the entire 2006–2012 timeframe included Canada
(53%), Brazil (26%), Mexico (8%), Chile (5%), and China (4%), while 2012 exports were
dominated by Canada (48%), Brazil (35%), Chile (6%), and Nicaragua (6%). Wind turbine
component exports (towers, blades, gearboxes, and generators) are not shown in the figure
because such exports are likely a small and/or uncertain fraction of the broader trade category
categories that include gearboxes (the larger uncertainty for gearboxes reflects the relative paucity of data that can
be used to estimate a more precise point estimate for wind-related imports).
0
1
2
3
4
5
6
7
2006
2453 MW
2007
5253 MW
2008
8362 MW
2009
10005 MW
2010
5220 MW
2011
6819 MW
2012
13131 MW
Billion 2012$US
Gearboxes * (2012)
Wind generators (2012)
Wind blades and hubs (2012)
Other wind-related equipment *
To wers *
Wind-Powered Generating Sets
US Imports
:
Exports of Wind-Powered
Generating Sets
* estimated imports

2012 Wind Technologies Market Report
22
totals.
26
Despite growth in exports, the United States remained a sizable net importer of wind
turbine equipment over the entire 2006–2012 timeframe.
Looking behind the import data presented in Figure 12 in more regional detail, Figure 13 shows
a number of trends in the origin of the U.S. imports of wind-powered generating sets, towers,
wind blades and hubs, and wind generators and parts.
27
• Wind-Powered Generating Sets: The primary source markets for wind-powered generating
sets during 2006–2012 have been the home countries of the major international turbine
manufacturers: Denmark, Spain, Japan, India, and Germany. The obvious exception is Italy,
which is not “home” to a major wind turbine manufacturer, although Vestas, at least, has
blade and nacelle manufacturing facilities there. Offsetting the decrease in Denmark's share
in 2012 was a notable increase in the share of imports from China and India and, to a lesser
extent, Japan and Germany. A shift in European manufacturers to U.S. production may
explain the overall decrease in European import share from 2011 to 2012.
• Towers: The countries of origin for tower imports are only reported for 2011 and 2012, as
the proportion of tower imports that were wind related for each country is not known for
earlier years. The share of imports of tubular towers from Asia was over 80% in both 2011
and 2012 (almost 50% from China), with much of the remainder from Canada and Mexico;
unlike for wind-powered generating sets, the share of tower imports from Europe is relatively
minor. A decrease in the share of tower imports from Mexico and Vietnam from 2011 to
2012 was compensated by a rise in the share from Korea, China, and Europe. Beginning in
2012, cash deposits were required for tower imports from China and Vietnam, and sizeable
duties are going to be in effect in 2013. Those duties may impact the magnitude and source
countries of future U.S. tower imports.
• Blades and Hubs: With regards to wind blades and hubs, about half of the imports in 2012
were from Brazil, with the rest mostly coming from Asia (e.g., China) and Europe (e.g.,
Denmark).
• Generators and Parts: The import origins for wind-related generators and generator parts
are distributed across a large number of countries, including Vietnam, Japan, Mexico, Spain,
and Serbia, with under half of imports from Asia, about a third from Europe, and under a
quarter from North America.
Considering total 2012 imports of wind turbine equipment in the categories described above,
almost half of the import value comes from Asia (especially China), one-third from Europe
(especially Denmark), and significant amounts from the Americas (especially Brazil).
26
U.S. exports of ‘towers and lattice masts’ in 2012 totaled $154 million (including substantial amounts to Canada
and Mexico). The USITC data for tower exports do not differentiate between tubular towers (used in wind power
applications) and other types of towers for any years, unlike the import classification for 2011 and 2012. Although it
is likely that most of these tower exports are wind related, the exact proportion is not known and hence the $154
million figure should be viewed with some caution.
27
“Gearboxes” are not included because the trade category is not specific to wind power.
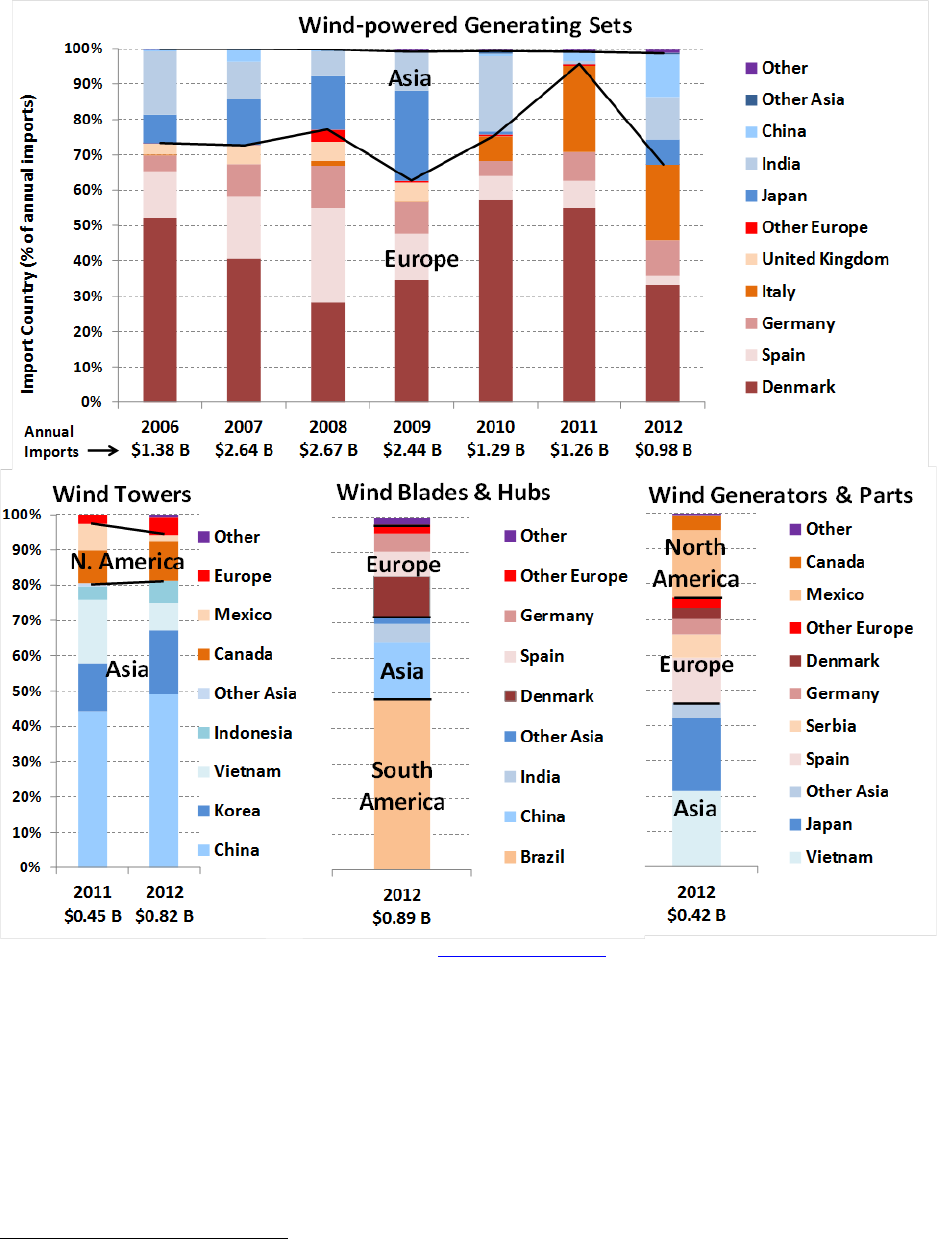
2012 Wind Technologies Market Report
23
Source: Berkeley Lab analysis of data from USITC DataWeb: http://dataweb.usitc.gov
Figure 13. Origins of U.S. Imports of Wind Turbine Equipment
Although the text thus far depicts a U.S. wind power market that remains reliant on equipment
imports, the level of reliance has declined over time. To estimate the percentage share of selected
imports over time, one must account for the fact that wind turbines and components imported at
the end of one year may not be installed until the following year. As such, in Figure 14 the
combined imports of wind-powered generating sets and selected turbine components are
determined, in most years, by using a 4-month lag.
28
The resulting import figures are then
28
Specifically, monthly import data from September of the previous year to August of the current year are used to
estimate the value of imports in wind turbine installations in the current year. For 2012, however, because of
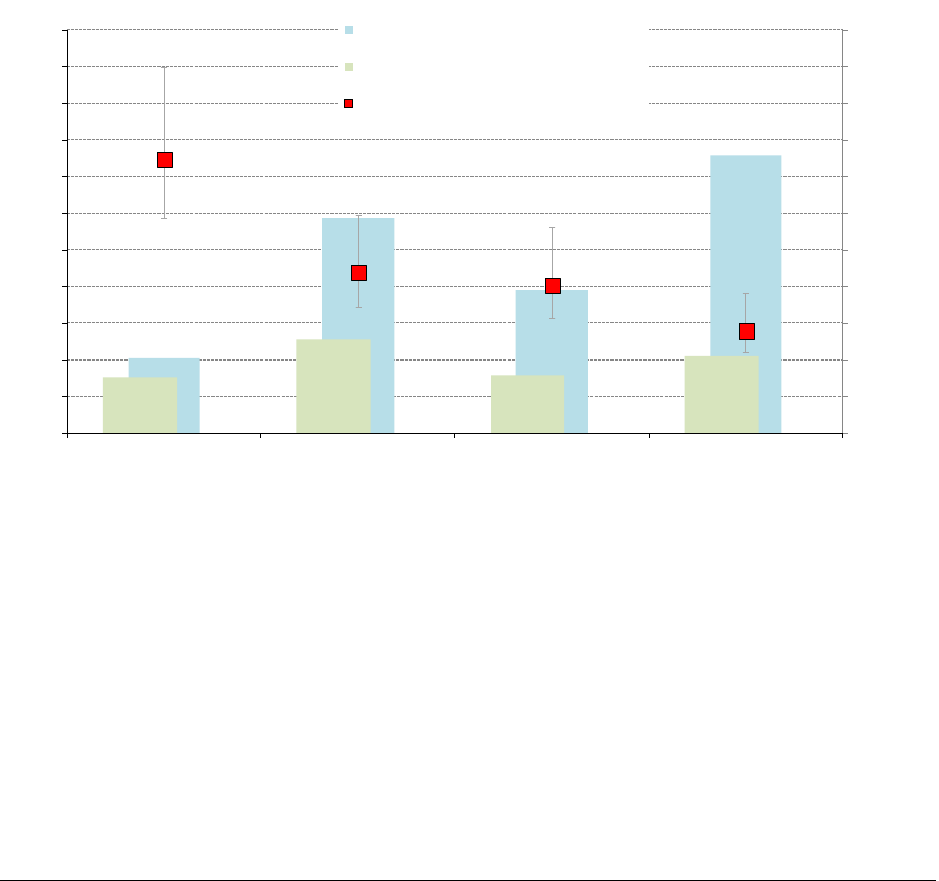
2012 Wind Technologies Market Report
24
compared to total wind turbine equipment-related costs on a calendar-year basis.
29
Data from
2006–2011 are averaged over 2-year periods to further avoid “noise” in the resulting estimates.
The error bars around the estimated import shares correspond to the combination of uncertainty
around import quantities (reported in Figure 12) as well as uncertainty in total wind turbine
equipment costs (described in footnote 29).
30
Figure 14. Estimated Wind Power Equipment Imports as a Fraction of Total Turbine Cost
Ultimately, when presented as a fraction of total equipment-related turbine costs in this fashion,
the overall import fraction is estimated to have declined considerably, from approximately 75%
in 2006–2007 to approximately 28% in 2012. Conversely, if one assumes that no wind
equipment imports occurred through other trade categories beyond those analyzed here, then
domestic content has increased from 25% in 2006–2007 to 72% in 2012.
The USITC trade data similarly do not allow for a precise estimate of the domestic content of
specific wind turbine components. Nonetheless, based on those data and a wide variety of
somewhat uncertain assumptions, Table 4 presents rough estimates of the domestic content for
major wind turbine components used in U.S. wind power projects in 2012. On a component-by-
uncertainty in the availability of federal tax incentives in 2013, we assume that imports through November were
used in 2012 installations.
29
Total wind turbine costs ($/kW) are assumed to equal 70% of the average project-level costs reported later in this
report (with a range of 60% to 75% used to generate the error bars in the figure). Wind turbine equipment-related
costs, meanwhile, are assumed to equal 85% of total wind turbine costs, with the remaining 15% consisting of
transportation, project management, and other soft costs (a range of 80% to 90% is used to generate the error bars in
the figure). To calculate total calendar-year wind turbine equipment-related costs, the wind turbine equipment-
related cost figure in $/kW is multiplied by annual wind power capacity installations.
30
If, in addition to these uncertainties, we also consider a range of lags for the combined imports of wind-powered
generating sets and selected turbine components in 2012, from 1 month (December 2011 to November 2012) to 6
months (July 2011 to November 2012), the import fraction in 2012 ranges from 19% to 45%.
0
2
4
6
8
10
12
14
16
18
20
22
2006-2007
2008-2009
2010-2011
2012*
Selected Import Content as Fraction of Turbine Cost
Billion 2012$US
Average Annual Turbine Equipment Cost
(Calendar Year)
Value of Selected Imports (Customs value,
4 month lag, Sept - Aug * )
Selected Import Content
50%
40%
0%
30%
60%
70%
10%
20%
* For 2012, the import period is from September 2011 through November 2012.
80%
90%
100%

2012 Wind Technologies Market Report
25
component basis, domestic content varied widely in 2012, with the U.S. most-heavily reliant on
imports of generators relative to other major components.
Table 4. Approximate Domestic Content of Major Components in 2012
These figures should be considered rough approximations and may understate the wind power
industry’s reliance on turbine and component imports, because it is possible that wind-related
imports are occurring under other trade categories not captured here, including equipment (such
as bearings, bolts, or voltage controllers, for example) or inputs (such as foreign steel and oil
used in the domestic manufacturing of wind-related equipment). If these were accounted for, the
estimated import content numbers would be higher than reported here, while the domestic
content numbers would be lower. On the other hand, our analysis also assumes that all
components imported into the United States are used for the domestic market and not used to
assemble wind-powered generating sets that are exported from the United States.
31
If this were
not the case, the resulting import fraction would be lower (domestic fraction higher) than that
presented above.
Notwithstanding these limitations, the data presented here demonstrate that a growing amount of
the equipment used in U.S. wind power projects has been sourced domestically in recent years
and that a majority of wind equipment—in dollar-value terms—was sourced domestically in
2012. Such trends do not hold for all turbine components, however, and whether these trends
continue in the future may depend on the size and stability of the U.S. wind power market as
well as the manufacturing strategies of established and emerging turbine manufacturers.
Although the Average Nameplate Capacity of Installed Wind Turbines
Declined Slightly, the Average Hub Height and Rotor Diameter Continued to
Increase
The average nameplate capacity of wind turbines that were newly installed in the United States
in 2012 declined slightly, to roughly 1.94 MW, down from 1.97 MW in 2011 (Figure 15). Since
1998–1999, average turbine nameplate capacity has increased by 170%.
32
As shown in Figure
16 (as well as Figure 15), however, the pace of growth in nameplate capacity has slowed since
2006. Specifically, while it took just six years (2000-2005) for MW-class turbines to almost
totally displace sub-MW-class turbines, it has taken another seven years (2006-2012) for multi-
MW-class turbines (i.e., 2 MW and above) to gain nearly equal market share (in terms of
percentage of turbines deployed each year) with MW-class turbines.
31
This concern is limited primarily to generator parts and gearboxes, however, and basic calculations show that it is
unlikely to create much error in the estimates provided here.
32
Figure 15 (as well as a number of the other figures and tables included in this report) combines data into both 1-
and 2-year periods in order to avoid distortions related to small sample size in the PTC lapse years of 2000, 2002,
and 2004; although not a PTC lapse year, 1998 is grouped with 1999 due to the small sample of 1998 projects.
Generators
Towers
Blades and Hubs
Wind-Powered Generating Sets
< 25%
50-70%
60-80%
> 80% of nacelles
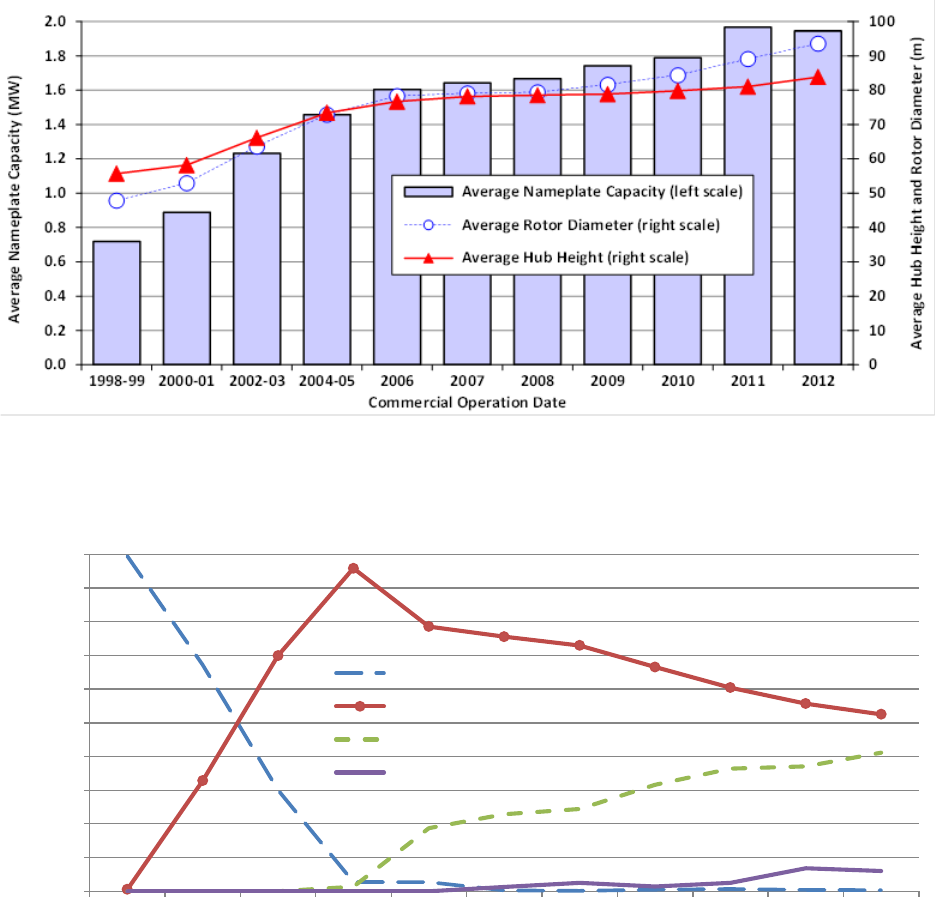
2012 Wind Technologies Market Report
26
Source: AWEA project database
Figure 15. Average Turbine Nameplate Capacity, Rotor Diameter, and Hub Height
Installed during Period (only turbines larger than 100 kW)
Source: AWEA project database
Figure 16. Size Distribution of Number of Turbines (>100 kW) Deployed in Each Period
In addition to nameplate capacity ratings, average hub heights and rotor diameters have also
scaled with time. The average hub height of wind turbines installed in the United States in 2012
was 83.8 meters (Figure 15), up from 81 meters in 2011 and 79.8 meters in 2010. Since 1998–
1999, the average turbine hub height has increased by 50% (or 28.1 meters), although growth has
slowed in the more recent years. At the upper extreme, more than 1,000 turbines installed in
2012 (15% of installed capacity in 2012) had hub heights of 100 meters or taller (AWEA 2013a),
up from 128 such turbines installed in 2011 (3.5% of installed capacity) and just 17 in 2010
(<1% of installed capacity). Not surprisingly, most of these taller towers have been installed in
0%
10%
20%
30%
40%
50%
60%
70%
80%
90%
100%
1998-99
1,429
1,027
2000-01
1,984
1,761
2002-03
1,685
2,075
2004-05
1,900
2,769
2006
1,530
2,453
2007
3,199
5,253
2008
5,015
8,361
2009
5,744
10,002
2010
2,916
5,215
2011
3,469
6,819
2012
6,753
13,131
Size Distribution (% of turbines deployed)
>0.1 MW & <1 MW
≥1 MW & <2 MW
≥2 MW & <3 MW
≥3 MW
Year:
Turbines:
MW:

2012 Wind Technologies Market Report
27
areas with less-energetic wind regimes, such as the Great Lakes region (see Figure 24, later, for
regional definitions).
Average rotor diameters have increased at a more rapid pace, especially in the last 3 years; the
average rotor diameter of wind turbines installed in the United States in 2012 was 93.5 meters
(Figure 15), up from 89 meters in 2011 and 84.3 meters in 2010. Since 1998–1999, the average
rotor diameter has increased by 96% (or 45.7 meters), which translates into 283% growth in
rotor-swept area. At the upper extreme, 3,193 turbines installed in 2012 (50.5% of installed
capacity in 2012) featured rotor diameters of 100 meters or larger (AWEA 2013a), up from 810
such turbines installed in 2011 (26.5% of installed capacity) and 222 in 2010 (10% of installed
capacity).
These trends in hub height and rotor scaling are two of several factors impacting the project-level
capacity factors highlighted later in this report. Moreover, industry expectations as well as new
turbine announcements (especially to serve lower-wind-speed sites) suggest that significant
further scaling is anticipated in the near term.
Apart from (but related to) turbine size, turbine configuration is also changing somewhat. In
particular, there were 194 direct drive (as opposed to geared) turbines installed in the United
States in 2012 (totaling 429.7 MW, or 3.3% of new capacity installed that year), up from just 17
in 2011 (totaling 35.3 MW) and no more than three (totaling no more than 4.5 MW) in any of the
previous 3 years from 2008–2010.
33
Among the five turbine manufacturers that supplied direct
drive units to the United States in 2012, Siemens accounted for the largest share with its new 3-
MW direct drive model (267 MW), followed by Goldwind with a mix of 1.5-MW and 2.5-MW
direct drive turbines (totaling 155.5 MW), Vensys (3 MW), Emergya Wind Technolgies (2.7
MW), and Leitner-Poma (1.5 MW).
The Project Finance Environment Held Steady in 2012
Although the amount of new debt and tax equity committed in 2012 declined relative to 2011
(reflecting the considerable uncertainty surrounding incentive availability in 2013), yields on
both sources of capital were largely unchanged from 2011. At the same time, the nature of deals
shifted somewhat in 2012, as the debt market responded to the new reality of shorter bank tenors
by looking more to institutional lenders, while the tax-equity market continued to move away
from Section 1603 cash grant deals.
On the debt side, AWEA (2013a) reports that nearly 4,300 MW of new wind capacity raised $4.9
billion in debt in 2012—down 17% from the $5.9 billion of debt raised by nearly 4,200 MW in
2011 and down 42% from the $8.4 billion of debt raised by nearly 5,600 MW in 2010.
34
The
33
Direct drive technology has been relatively slow to enter the U.S. market in comparison to global trends—e.g.,
Navigant (2013) reports that 19.5% of global wind turbine supply in 2012 featured direct drive turbines—in part
because Enercon, a German leader in direct drive technology, has not entered the U.S. market, while Chinese sales
of direct-drive turbines into the United States have been limited.
34
AWEA (2013a) defines debt inclusively as “traditional project loans, bond issuance, bridge loans, and all other
reported debt financing.” The dollar and capacity figures cited here include only those deals that closed in a given
year, some of which might have involved projects installed in a later year.

2012 Wind Technologies Market Report
28
decline in leverage implied by this $1-billion reduction in capital committed to roughly the same
amount of capacity as in 2011 (even after accounting for declining project costs) is perhaps
indicative of the continued shift away from the Section 1603 cash grant in favor of the PTC
(PTC deals are financed mostly with tax equity rather than with debt),
35
a trend towards lower
PPA prices (which cannot support as much debt), and perhaps also stricter capital requirements
resulting from new banking regulations. These new regulations also kept a lid on bank loan
tenors, with 7- to 10-year “mini-perms” representing the norm in the bank market.
36
Pricing
remained largely unchanged from 2011, with spreads over the London Interbank Offered Rate
(LIBOR) reportedly ranging from 225–275 basis points (depending on the particulars of the
deal), with a 25-basis-point increase in the spread every few years until maturity. With LIBOR
ending the year at around 0.3%, however, and with 10-year interest rate swaps priced below 2%
for much of 2012, all-in interest rates starting around 5% were achievable—somewhat lower
than in 2011.
With banks restricted to shorter-term mini-perms, institutional lenders (e.g., insurance
companies) seized the opportunity to offer long-term products, e.g., as long as 20 years with full
amortization and at competitive all-in interest rates of around 5%. Some wind project developers
have split up their debt financing in response to this divergence, using banks for their shorter-
term borrowing needs (e.g., construction and cash grant bridge financing) and institutional
lenders (or even the bond market) for long-term permanent debt financing. In fact, some
developers have even tapped into bank/bond hybrid instruments, whereby the bank portion of the
debt amortizes over the first 7–10 years (during which the bond portion is interest only), while
the bond portion amortizes over the next 10–12 years (once the bank portion has matured); from
the developer’s perspective, this hybrid product feels like a seamless, long-term, fully amortizing
loan (Fox 2013).
Estimates of new tax-equity commitments to wind projects in 2012 totaled $2.5 billion
(Chadbourne and Parke 2013) to $3 billion (AWEA 2013a), in either case representing a decline
from 2011, caused by the uncertainty over whether or not the PTC would be extended into 2013.
Tax-equity yields have remained fairly steady since mid-2010 and are reportedly in the “high
single digits,” or around 8% on an after-tax unlevered basis, but increasing by as much as 500–
800 basis points if project-level debt is present (Chadbourne and Parke 2013). The sheer size of
this debt-based premium is indicative of tax equity’s general discomfort with leverage and is
why most projects with tax equity do not also feature project-level debt (although “back
leverage”—in which the developer borrows against its own equity stake in the project, one step
35
Only 42% of new wind power capacity installed in 2012 chose the 1603 grant, down from 62% in 2011 and 82%
in 2010. Similarly, among tax-equity deals that closed in 2012, 75% (Chadbourne and Parke 2013) to 80% (AWEA
2013a) involved the PTC rather than the 1603 grant.
36
A “mini-perm” is a relatively short-term (e.g., 7–10 years) loan that is sized based on a much longer tenor (e.g.,
15–17 years) and therefore requires a balloon payment of the outstanding loan balance upon maturity. In practice,
this balloon payment is often paid from the proceeds of refinancing the loan at that time. Thus, a 10-year mini-perm
might provide the same amount of leverage as a 17-year fully amortizing loan but with refinancing risk at the end of
10 years. In contrast, a 17-year fully amortizing loan would be repaid entirely through periodic principal and interest
payments over the full tenor of the loan (i.e., no balloon payment required and no refinancing risk).

2012 Wind Technologies Market Report
29
removed from the project itself—is more acceptable to tax-equity investors and therefore more
common).
37
Looking ahead to the remainder of 2013, financing activity is likely to pick up as the PTC and
ITC have been extended and as projects work to either achieve commercial operations this year
or else meet the start of construction deadline at year’s end. Although new wind capacity
projections for 2013 are modest (2–5 GW, see Chapter 8) and therefore likely will not test the
availability of capital, the fact that the Section 1603 grant program is no longer available (at least
to wind projects), and that new projects may feature higher capacity factors as a result of turbine
evolution (higher capacity factors equate to more PTCs per project, which in turn support greater
tax-equity investment per project), means that tax equity will not stretch as far as it has in the
past few years. At the same time, there will be increasing competition for limited tax-equity
dollars from solar projects, particularly as the backlog of grandfathered solar projects with 1603
grants diminishes. As such, 2014 could be the next real test of the industry’s ability to finance its
expansion, particularly given that tax equity is reluctant to commit to projects more than 12
months in advance, which effectively turns the end-of-2013 construction start deadline into an
end-of-2014 commercial operations deadline for most projects using tax equity. Finally, with the
shift to short loan tenors in the bank markets seemingly permanent (Chadbourne and Parke
2013), developers will presumably continue to look to institutional lenders and the bond markets
for creative ways to meet their long-term borrowing needs.
Independent Power Producers Remained the Dominant Owners of Wind
Projects while Utilities Took a Breather in 2012
Independent power producers (IPPs) continued to dominate the ownership of wind power
projects, owning 88% (11,556 MW) of all new capacity additions in 2012 (Figure 17). In a
deviation from what has been a growth trend, utility ownership of new capacity built in 2012 fell
to 10%—down from 25% in 2011 and at its lowest level (percentage-wise) since 2003—with
investor-owned utilities (IOUs) owning 1,128 MW (9%) and publicly owned utilities (POUs)
owning another 219 MW (2%). The remaining 2% (228 MW) of new 2012 wind capacity is
owned by “other” entities that are neither IPPs nor utilities (e.g., towns, schools, commercial
customers, farmers).
38
Of the cumulative installed wind power capacity at the end of 2012, IPPs
owned 83% (49,968 MW) and utilities owned 15% (7,485 MW for IOUs and 1,644 MW for
POUs), with the remaining 2% (1,142 MW) falling into the “other” category.
37
With back leverage, the loan to the developer is secured by the developer’s equity stake in the project, rather than
by the project itself. Hence, in a foreclosure situation, tax equity would still maintain its partial ownership position
along with the rights to the project’s tax benefits. This stands in contrast to project-level debt, where foreclosure
could result in tax equity losing its rights.
38
Most of these “other” projects, along with some IPP- and POU-owned projects, might also be considered
“community wind” projects that are owned by or benefit one or more members of the local community to a greater
extent than typically occurs with a commercial wind project. According to AWEA (2013a), 4.3% of 2012 capacity
additions qualified as community wind projects.
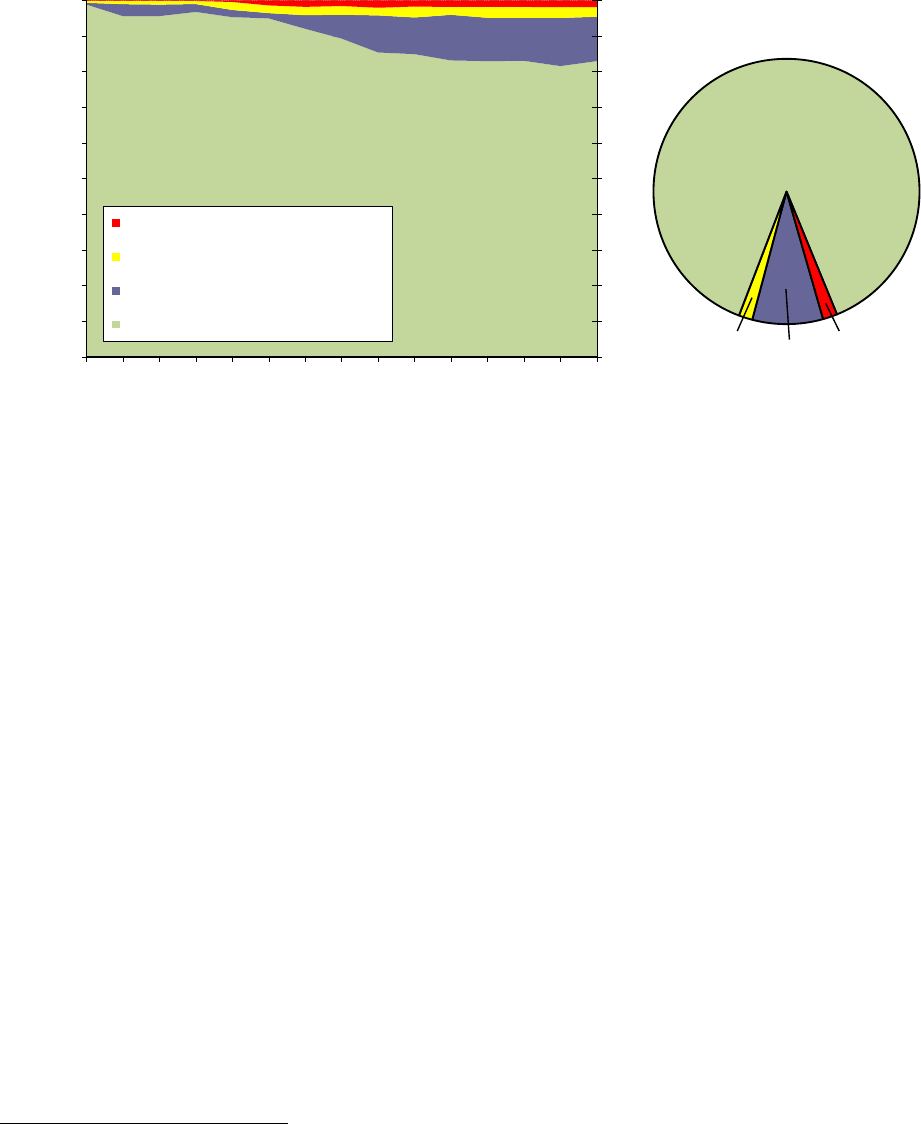
2012 Wind Technologies Market Report
30
Source: Berkeley Lab estimates based on AWEA project database
Figure 17. Cumulative and 2012 Wind Power Capacity Categorized by Owner Type
Long-Term Contracted Sales to Utilities Remained the Most Common Off-
Take Arrangement and Have Gained Ground since the Peak of Merchant
Development in 2008/2009
Electric utilities continued to be the dominant off-takers of wind power in 2012 (Figure 18),
either owning (10%) or buying (69%) power from 79% of the new capacity installed last year
(with the 79% split between 57% IOU and 23% POU). On a cumulative basis, utilities own
(15%) or buy (54%) power from 69% of all wind power capacity installed in the United States
(with the 69% split between 49% IOU and 20% POU)—up from a low of 63% in 2009.
The role of power marketers—defined here as corporate intermediaries that purchase power
under contract and then resell that power to others, sometimes taking some merchant risk
39
—in
the wind power market has waned in recent years. In 2012, power marketers purchased the
output of just 1% of the new wind power capacity, with 8% of the cumulative wind power
capacity being sold to these entities.
Merchant/quasi-merchant projects were somewhat less prevalent in 2012 than they have been in
recent years, accounting for 19% of all new capacity (compared to 21%–23% in 2011 and 2010
and 36%–38% in 2009 and 2008) and 23% of cumulative capacity. Merchant/quasi-merchant
projects are those whose electricity sales revenue is tied to short-term contracted and/or
39
Power marketers are defined here to include not only traditional marketers such as PPM Energy (now part of
Iberdrola), but also the wholesale power marketing affiliates of large IOUs (e.g., PPL Energy Plus or FirstEnergy
Solutions), which may buy wind power on behalf of their load-serving affiliates. Direct sales to end users (e.g., the
University of Maryland buys wind power from both the Pinnacle project in West Virginia and the Roth Rock project
in Maryland) are also included in this category, because in these few limited cases the end user is effectively acting
as a power marketer.
0%
10%
20%
30%
40%
50%
60%
70%
80%
90%
100%
0%
10%
20%
30%
40%
50%
60%
70%
80%
90%
100%
1998
1999
2000
2001
2002
2003
2004
2005
2006
2007
2008
2009
2010
2011
2012
Other
Publicly Owned Utility (POU)
Investor-Owned Utility (IOU)
Independent Power Producer (IPP)
% of Cumulative Installed Capacity
Other:
228 MW (2%)
IPP: 11,556
MW (88%)
IOU:
1,128 MW (9%)
POU:
219 MW (2%)
2012 Capacity by
Owner Type
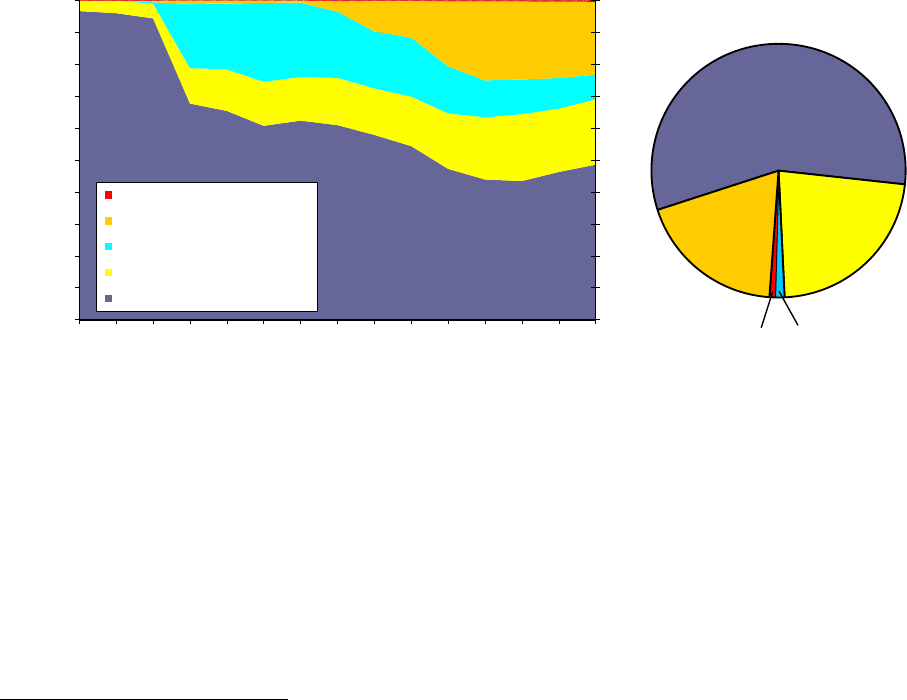
2012 Wind Technologies Market Report
31
wholesale spot electricity market prices (with the resulting price risk commonly hedged over a 5-
to 10-year period
40
) rather than being locked in through a long-term PPA. With PPAs in
relatively short supply compared to wind developer interest, with wholesale power prices at low
levels, and with the threat of an end-of-2012 PTC expiration, it is likely that many of the
merchant/quasi-merchant projects built in 2012 are merchant by necessity rather than by desire.
In other words, in the absence of a PPA, building a project on a merchant basis may, in some
cases, simply have been the most expedient way to guarantee the receipt of important federal
incentives like the Section 1603 Treasury cash grant and the PTC in advance of their scheduled
expirations. Given relatively low wholesale power prices, and despite improvements in the cost
and performance of wind energy, some of these projects are likely still seeking long-term PPAs
and may therefore not remain merchant for long.
Finally, roughly 94 MW of the wind power additions in 2012 that used turbines larger than 100
kW were interconnected on the customer side of the utility meter, with the power being
consumed on site rather than sold.
Source: Berkeley Lab estimates based on AWEA project database
Figure 18. Cumulative and 2012 Wind Power Capacity Categorized by Power Off-Take
Arrangement
40
Hedges are often structured as a “fixed-for-floating” power price swap—a purely financial arrangement whereby
the wind power project swaps the “floating” revenue stream that it earns from spot power sales for a “fixed” revenue
stream based on an agreed-upon strike price. For some projects (especially where natural gas is virtually always the
marginal supply unit), the hedge is structured in the natural gas market rather than the power market, in order to take
advantage of the greater liquidity and longer terms available in the forward gas market.
0%
10%
20%
30%
40%
50%
60%
70%
80%
90%
100%
0%
10%
20%
30%
40%
50%
60%
70%
80%
90%
100%
1998
1999
2000
2001
2002
2003
2004
2005
2006
2007
2008
2009
2010
2011
2012
On-Site
Merchant/Quasi-Merchant
Power Marketer
POU
IOU
% of Cumulative Installed Capacity
Merchant:
2,475 MW
(19%)
On-Site:
94 MW (0.7%)
IOU:
7,448 MW
(57%)
POU:
2,957 MW
(23%)
Marketer:
157 MW (1.2%)
2012 Capacity by
Off-Take Category

2012 Wind Technologies Market Report
32
4. Cost Trends
This chapter presents empirical data on both the upfront and operating costs of wind projects in
the United States. It begins with a review of wind turbine prices, followed by total installed
project costs, and then finally O&M costs. Later chapters present data on wind project
performance and then the price at which wind energy is being sold.
Wind Turbine Prices Remained Well Below Levels Seen Several Years Ago
Wind turbine prices have dropped substantially in recent years, despite continued technological
advancements that have yielded increases in hub heights and especially rotor diameters. This
downward pricing pressure continued in 2012, partly a result of reduced demand expectations for
2013 and stiff competition among and low margins for turbine OEMs and equipment suppliers.
Berkeley Lab gathered price data for 102 U.S. wind turbine transactions totaling 27,000 MW
announced from 1997 through the beginning of 2013, including 12 transactions (2,630 MW)
announced in 2011 but just six transactions (350 MW) announced since that time. Sources of
turbine price data vary, but many derive from press releases and news reports. Most of the
transactions included in the Berkeley Lab dataset likely include turbines, towers, delivery to site,
and limited warranty and service agreements.
41
Nonetheless, wind turbine transactions differ in
the services included (e.g., whether towers and installation are provided, the length of the service
agreement, etc.), turbine characteristics (and therefore performance), and the timing of future
turbine delivery, driving some of the observed intra-year variability in transaction prices.
Unfortunately, collecting data on U.S. wind turbine transaction prices is a challenge: in 2012,
relatively few new wind turbine transactions were announced, only a fraction of which publicly
revealed pricing data. In part as a result, Figure 19—which depicts these U.S. wind turbine
transaction prices—also presents data from Vestas on that company’s global average turbine
pricing from 2005 through 2012, as reported in Vestas’ financial reports (with an average annual
exchange rate used to convert to U.S. dollars); and a range of recent global average wind turbine
prices for both older turbine models (smaller rotors, lower hub height) and new models (larger
rotors, higher hub height), as reported by Bloomberg NEF (2013b).
After hitting a low of roughly $700/kW from 2000 to 2002, average wind turbine prices
increased by approximately $800/kW (more than 100%) through 2008, rising to an average of
more than $1,500/kW. The increase in turbine prices over this period was caused by several
factors, including a decline in the value of the U.S. dollar relative to the Euro; increased
materials, energy, and labor input prices; a general increase in turbine manufacturer profitability
due in part to strong demand growth and turbine and component supply shortages; increased
costs for turbine warranty provisions; and an up-scaling of turbine size, including hub height and
rotor diameter (Bolinger and Wiser 2011).
41
Because of data limitations, the precise content of many of the individual transactions is not known.
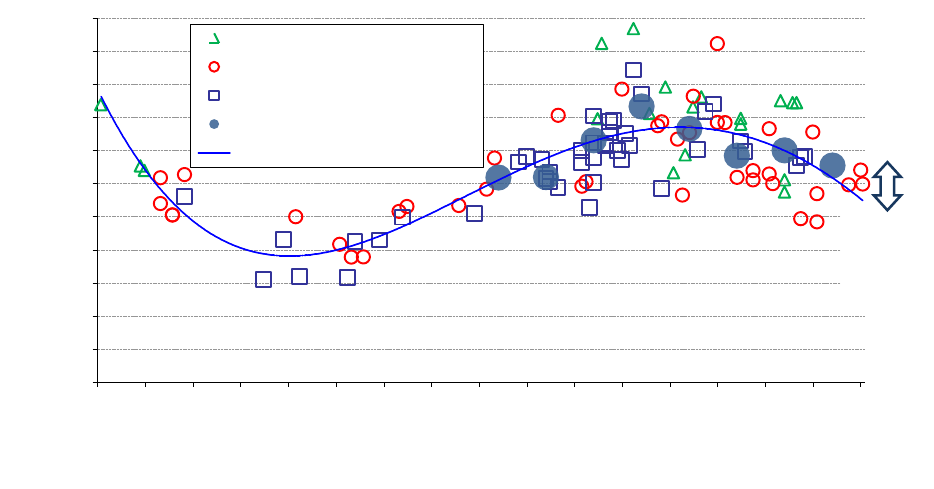
2012 Wind Technologies Market Report
33
Source: Berkeley Lab
Figure 19. Reported Wind Turbine Transaction Prices over Time
Since 2008, wind turbine prices have declined substantially, reflecting a reversal of some of the
previously mentioned underlying trends that had earlier pushed prices higher as well as increased
competition among manufacturers and a shift to a buyer’s market. As shown in Figure 19, our
limited sample of recently announced U.S. turbine transactions shows pricing in the $950–
$1,300/kW range. Bloomberg NEF (2013b) reports global average pricing for contracts signed in
2012 at slightly less than $1,100/kW for older turbine models and slightly more than $1,300/kW
for turbines that feature larger rotors and higher hub heights. Bloomberg NEF (2013b) further
reports U.S. average pricing of $1,140/kW for contracts signed in 2012. Data from Vestas on that
company’s global average pricing largely confirm these basic trends and conclusions.
Overall, these figures suggest price declines of roughly 20%–35% since late 2008. Moreover,
these declines have been coupled with improved turbine technology (e.g., witness the recent and
continued growth in average hub heights and rotor diameters in Figure 16) and more-favorable
terms for turbine purchasers (e.g., reduced turbine delivery lead times and less need for large
frame-agreement orders, longer initial O&M contract durations, improved warranty terms, and
more-stringent performance guarantees). These price reductions and improved terms have
exerted downward pressure on total project costs and wind power prices, whereas increased rotor
diameters and hub heights would be expected to improve capacity factors and further reduce
wind power prices.
Reported Installed Project Costs Continued to Trend Lower in 2012
Berkeley Lab compiles data on the total installed cost of wind power projects in the United
States, including data on 118 projects completed in 2012 totaling 9,414 MW, or 72% of the wind
power capacity installed in that year. In aggregate, the dataset (through 2012) includes 689
0
200
400
600
800
1,000
1,200
1,400
1,600
1,800
2,000
2,200
Jan-97
Jan-98
Jan-99
Jan-00
Jan-01
Jan-02
Jan-03
Jan-04
Jan-05
Jan-06
Jan-07
Jan-08
Jan-09
Jan-10
Jan-11
Jan-12
Jan-13
Announcement Date
U.S. Orders <5 MW
U.S. Orders from 5 - 100 MW
U.S. Orders >100 MW
Vestas Global Average
Polynomial Trend Line for Orders
Turbine Transaction Price (2012$/kW)
Recently
reported
global
average
prices
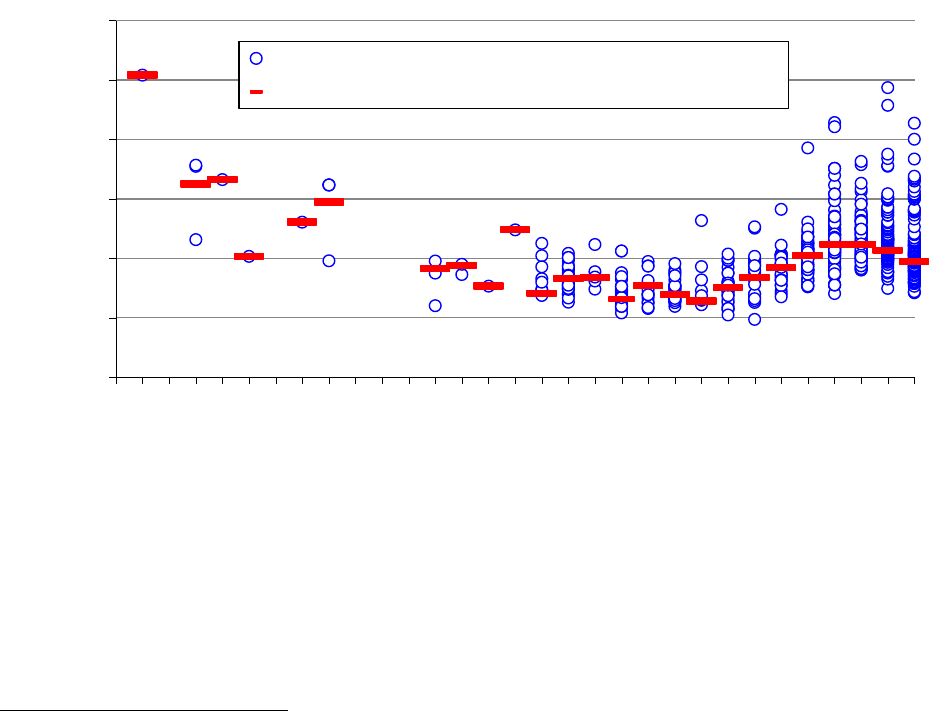
2012 Wind Technologies Market Report
34
completed wind power projects in the continental United States totaling 49,414 MW and
equaling roughly 82% of all wind power capacity installed in the United States at the end of
2012. In general, reported project costs reflect turbine purchase and installation, balance of plant,
and any substation and/or interconnection expenses. Data sources are diverse, however, and are
not all of equal credibility, so emphasis should be placed on overall trends in the data rather than
on individual project-level estimates.
As shown in Figure 20, the average installed costs of wind power projects declined from the
beginning of the U.S. wind industry in California in the 1980s through the early 2000s, before
following turbine prices higher through the latter part of the last decade. Whereas turbine prices
peaked in 2008/2009, however, project-level installed costs appear to have peaked in 2009/2010.
That changes in average installed project costs would lag changes in average turbine prices is not
surprising and reflects the normal passage of time between when a turbine supply agreement is
signed (the time stamp for Figure 19) and when those turbines are actually installed and
commissioned (the time stamp for Figure 20).
42
Source: Berkeley Lab (some data points suppressed to protect confidentiality)
Figure 20. Installed Wind Power Project Costs over Time
In 2012, the capacity-weighted average installed project cost stood at roughly $1,940/kW, down
almost $200/kW from the reported average cost in 2011 and down almost $300/kW from the
apparent peak in average reported costs in 2009 and 2010. Anecdotal indications from a handful
of projects currently under construction and anticipating completion in 2013 suggest that average
installed costs may decline further in 2013.
43
42
On the other hand, since 2009, Figure 20 partly reflects installed cost estimates derived from publicly available
data from the Section 1603 cash grant program. In some cases (although exactly which are unknown), the Section
1603 grant data likely reflect the fair market value rather than the installed cost of wind power projects; in such
cases, the installed cost estimates shown in Figure 20 will be artificially inflated.
43
Learning curves have been used extensively to understand past cost trends and to forecast future cost reductions
for a variety of energy technologies, including wind energy. Learning curves start with the premise that increases in
0
1,000
2,000
3,000
4,000
5,000
6,000
1982
1983
1984
1985
1986
1987
1988
1989
1990
1991
1992
1993
1994
1995
1996
1997
1998
1999
2000
2001
2002
2003
2004
2005
2006
2007
2008
2009
2010
2011
2012
Installed Project Cost (2012 $/kW)
Commercial Operation Date
Individual Project Cost (689 projects totaling 49,414 MW)
Capacity-Weighted Average Project Cost
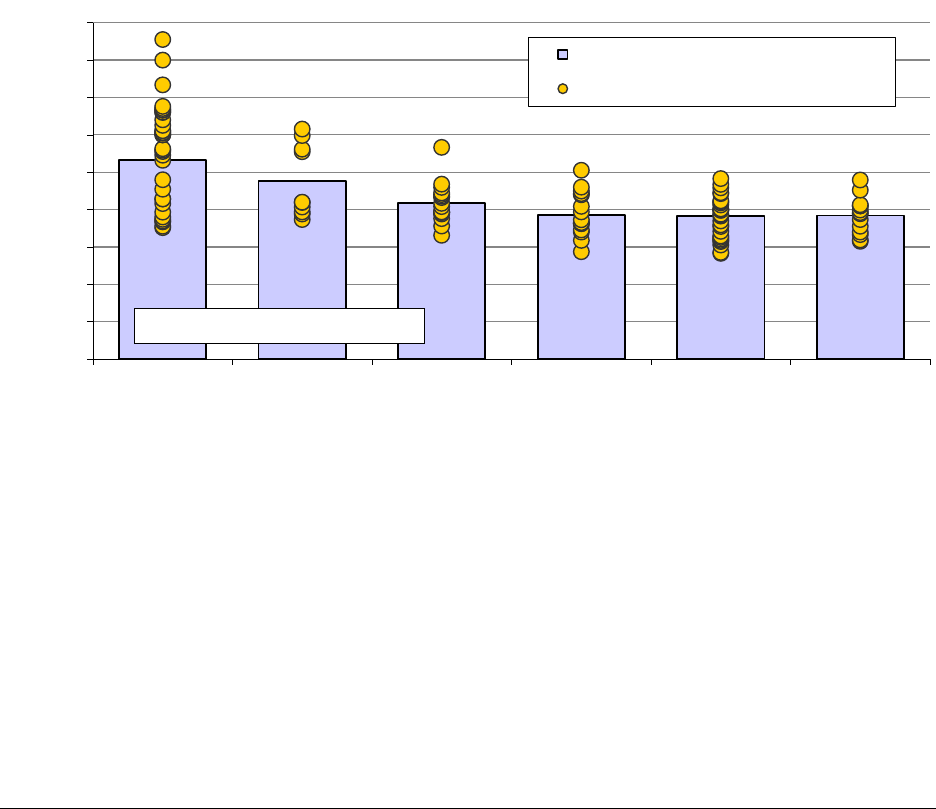
2012 Wind Technologies Market Report
35
Installed Costs Differed By Project Size, Turbine Size, and Region
Average installed wind power project costs exhibit economies of scale, especially at the lower
end of the project size range. Figure 21 shows that—among the sample of projects installed in
2012—there is a steady drop in per-kW average installed costs when moving from projects of 5
MW or less to projects in the 50–100 MW range. As project size increases beyond 100 MW,
economies of scale appear to be less prevalent.
Source: Berkeley Lab
Figure 21. Installed Wind Power Project Costs by Project Size: 2012 Projects
Another way to look for economies of scale is by turbine size (rather than by project size), on the
theory that a given amount of wind power capacity may be built less expensively using fewer,
larger turbines as opposed to more, smaller turbines. Figure 22 explores this relationship and
illustrates that here too some economies of scale are evident as turbine size increases.
44
the cumulative production or installation of a given technology lead to a reduction in its costs. The principal
parameter calculated by learning curve studies is the learning rate: for every doubling of cumulative
production/installation, the learning rate specifies the associated percentage reduction in costs. Based on the
installed cost data presented in Figure 20 and global cumulative wind power installations, learning rates can be
calculated as follows: 7.2% (using data from 1982 through 2012) or 14.1% (using data only during the period of
steadily declining cost, 1982–2004).
44
There is likely some correlation between turbine size and project size, at least at the low end of the range of each.
In other words, projects of 5 MW or less are more likely than larger projects to use individual turbines of less than 1
MW. As such, Figures 21 and 22—both of which show scale economies at small project or turbine sizes,
diminishing as project or turbine size increases—could both be reflecting the same influence, making it difficult to
tease out the unique influences of turbine size from project size.
0
500
1,000
1,500
2,000
2,500
3,000
3,500
4,000
4,500
≤5 MW
71 MW
34 projects
5-20 MW
129 MW
10 projects
20-50 MW
584 MW
17 projects
50-100 MW
1,191 MW
15 projects
100-200 MW
3,717 MW
28 projects
>200 MW
3,723 MW
14 projects
Installed Project Cost (2012 $/kW)
Capacity-Weighted Average Project Cost
Individual Project Cost
Sample includes projects built in 2012
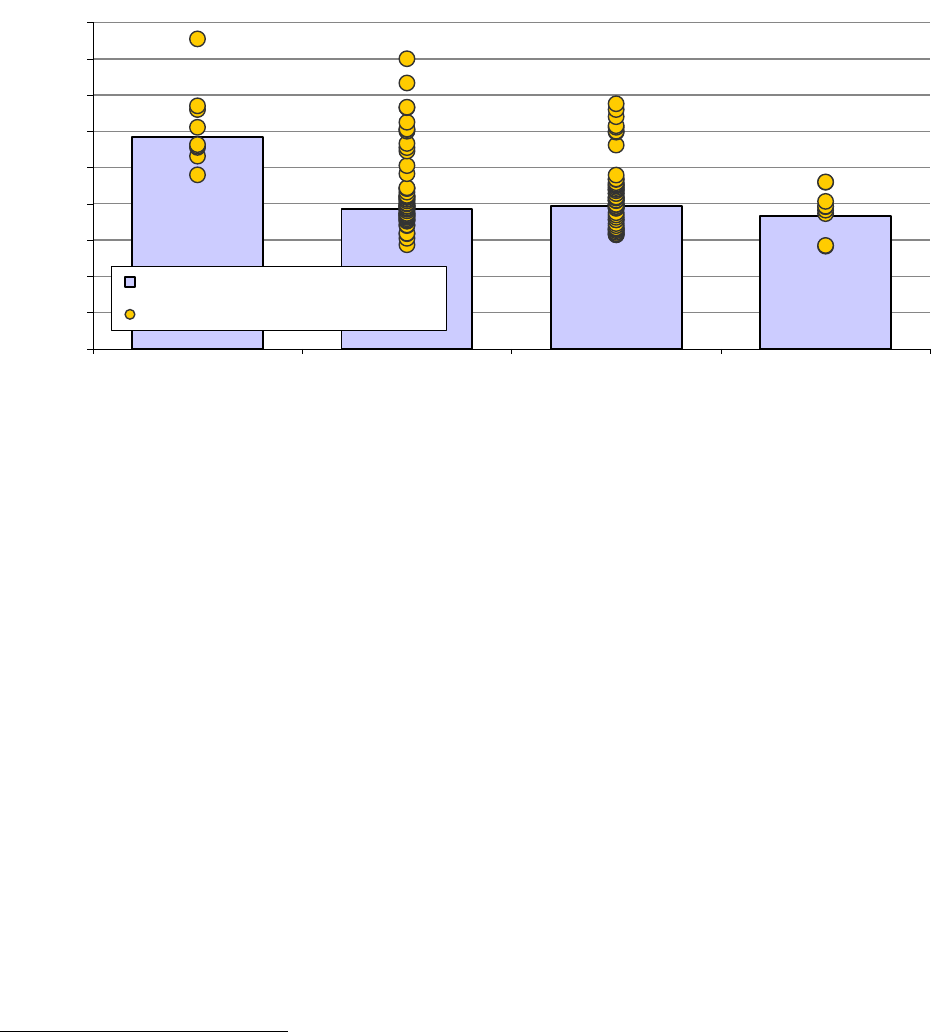
2012 Wind Technologies Market Report
36
Source: Berkeley Lab
Figure 22. Installed Wind Power Project Costs by Turbine Size: 2012 Projects
Regional differences in average project costs are also apparent and may occur due to variations
in development costs, transportation costs, siting and permitting requirements and timeframes,
and other balance-of-plant and construction expenditures as well as variations in the turbines
deployed in different regions (e.g., use of low-wind-speed technology in regions with lesser wind
resources). Considering only projects in the sample that were installed in 2012, Figure 23 breaks
out project costs among the five regions defined in Figure 24.
45
The Interior region—with both
the largest sample and the fewest outliers—was the lowest-cost region on average, with average
costs of $1,760/kW, while the Southeast was the highest-cost region (although with a sample of
just one project); the other three regions all came in relatively close to the nationwide average of
roughly $1,940/kW.
46
45
The five broad regions defined in Figure 24 represent a shift from the eight smaller regions examined in previous
editions of this report. This change was made in an effort to ensure sufficient sample size within individual regions
and to differentiate more clearly between regions based on the relative strength of the wind resource; this clearer
delineation becomes more useful in later sections of the report that are focused on capacity factor and power sales
prices. For reference, the 60 GW of wind installed in the United States at the end of 2012 is apportioned among the
five regions shown in Figure 24 as follows: Interior (34,695 MW), West (13,191 MW), Great Lakes (7,175 MW),
Northeast (3,820 MW), and Southeast (735 MW). The remaining installed U.S. wind power capacity is located in
Hawaii (206 MW), Puerto Rico (125 MW), and Alaska (59 MW) and is typically excluded from our analysis sample
due to the unique issues facing wind development in these three isolated states/territories.
46
Graphical presentation of the data in this way should be viewed with some caution, as numerous other factors also
influence project costs, and those are not controlled for in Figure 23.
0
500
1,000
1,500
2,000
2,500
3,000
3,500
4,000
4,500
>0.1 & <1 MW
10 MW
9 projects
≥1 & <2 MW
4,136 MW
51 projects
≥2 & <3 MW
4,515 MW
49 projects
≥3 MW
752 MW
9 projects
Installed Project Cost (2012 $/kW)
Capacity-Weighted Average Project Cost
Individual Project Cost
Sample includes projects built in 2012

2012 Wind Technologies Market Report
37
Source: Berkeley Lab
Figure 23. Installed Wind Power Project Costs by Region: 2012 Projects
Source: AWS Truepower, National Renewable Energy Laboratory
Figure 24. Regional Boundaries Overlaid on a Map of Average Annual Wind Speed at 80
Meters
0
500
1,000
1,500
2,000
2,500
3,000
3,500
4,000
4,500
Interior
42 projects
3,827 MW
Northeast
29 projects
1,101 MW
Great Lakes
21 projects
1,529 MW
West
25 projects
2,938 MW
Southeast
1 project
19 MW
Installed Project Cost (2012 $/kW)
Capacity-Weighted Average Project Cost
Individual Project Cost
Capacity-Weighted Average Cost, Total U.S.
Sample includes projects built in 2012

2012 Wind Technologies Market Report
38
Operations and Maintenance Cost Varied By Project Age and Commercial
Operations Date
Operations and maintenance costs are a significant component of the overall cost of wind energy
and can vary substantially among projects. Anecdotal evidence and recent analysis (Lantz 2013)
suggest that unscheduled maintenance and premature component failure in particular continue to
be key challenges for the wind power industry.
Unfortunately, publicly available market data on actual project-level O&M costs are not widely
available. Even where data are available, care must be taken in extrapolating historical O&M
costs given the dramatic changes in wind turbine technology that have occurred over the last two
decades, not least of which has been the up-scaling of turbine size (see Figure 16). Berkeley Lab
has compiled limited O&M cost data for 138 installed wind power projects in the United States,
totaling 9,022 MW in capacity, with commercial operation dates of 1982 through 2011. These
data cover facilities owned by both IPPs and utilities, although data since 2004 are exclusively
from utility-owned projects. A full time series of O&M cost data, by year, is available for only a
small number of projects; in all other cases, O&M cost data are available for just a subset of
years of project operations. Although the data sources do not all clearly define what items are
included in O&M costs, in most cases the reported values include the costs of wages and
materials associated with operating and maintaining the facility, as well as rent.
47
Other ongoing
expenses, including general and administrative expenses, taxes, property insurance, depreciation,
and workers’ compensation insurance, are generally not included. As such, the following figures
are not representative of total operating expenses for wind power projects; the last few
paragraphs in this section include data from other sources that demonstrate higher total operating
expenses. Given the scarcity, limited content, and varying quality of the data, the results that
follow may not fully depict the industry’s challenges with O&M issues and expenditures;
instead, these results should be taken as indicative of potential overall trends. Note finally that
the available data are presented in $/MWh terms, as if O&M represents a variable cost; in fact,
O&M costs are in part variable and in part fixed. Although not presented here, expressing O&M
costs in units of $/kW-year yields qualitatively similar results to those presented in this section.
Figure 25 shows project-level O&M costs by commercial operation date.
48
Here, each project’s
O&M costs are depicted in terms of its average annual O&M costs from 2000 through 2012,
based on however many years of data are available for that period. For example, for projects that
reached commercial operation in 2011, only year 2012 data are available, and that is what is
shown in the figure.
49
Many other projects only have data for a subset of years during the 2000–
47
The vast majority of the recent data derive from FERC Form 1, which uses the Uniform System of Accounts to
define what should be reported under “operating expenses” – namely, those operational costs associated with
supervision and engineering, maintenance, rents, and training. Though not entirely clear, there does appear to be
some leeway within the Uniform System of Accounts for project owners to capitalize certain replacement costs for
turbines and turbine components and report them under “electric plant” accounts rather than maintenance accounts.
If this occurs, the operating expenses reported in FERC Form 1 and presented in Figures 25 and 26 will not capture
total operating costs.
48
For projects installed in multiple phases, the commercial operation date of the largest phase is used; for re-
powered projects, the date at which re-powering was completed is used.
49
Projects installed in 2012 are not shown because only data from the first full year of project operations (and
afterwards) are used, which in the case of projects installed in 2012 would be year 2013 (for which data are not yet
available).
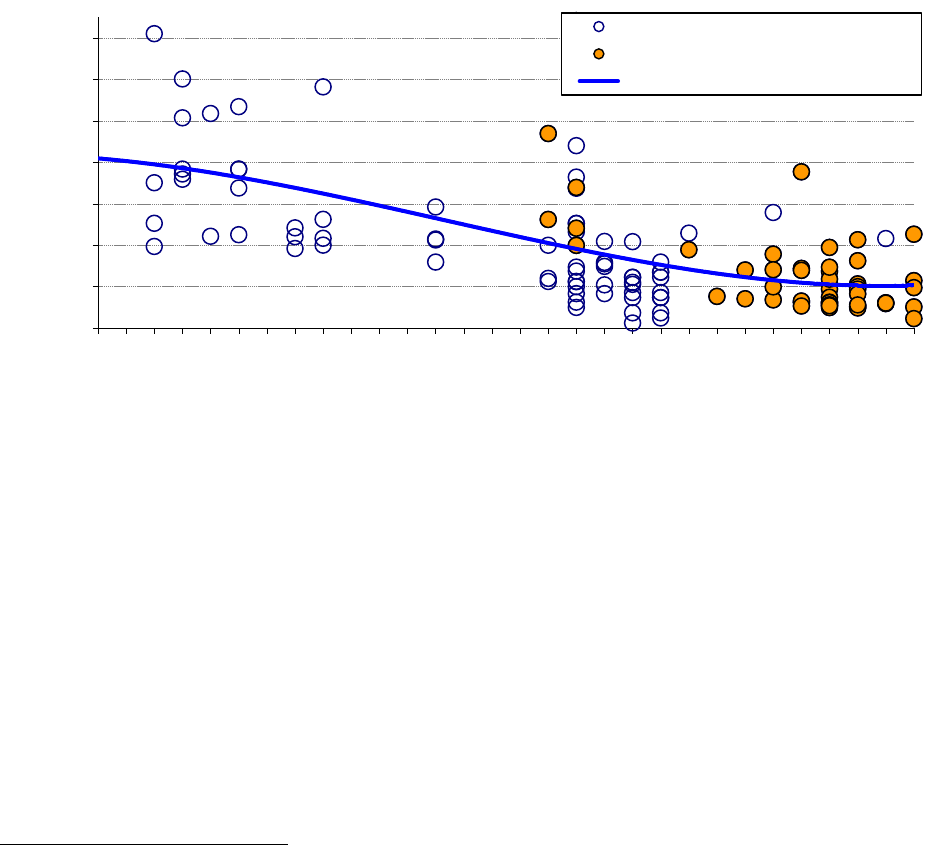
2012 Wind Technologies Market Report
39
2012 timeframe, either because they were installed after 2000 or because a full time series is not
available, so each data point in the chart may represent a different averaging period within the
overall 2000–2012 timeframe. The chart highlights the 51 projects, totaling 5,269 MW, for
which 2012 O&M cost data were available; those projects have either been updated or added to
the chart since the previous edition of this report.
Source: Berkeley Lab; seven data points suppressed to protect confidentiality
Figure 25. Average O&M Costs for Available Data Years from 2000–2012, by Commercial
Operation Date
The data exhibit considerable spread, demonstrating that O&M costs (and perhaps also how
O&M costs are reported by respondents) are far from uniform across projects. However, Figure
25 suggests that projects installed within the past decade have, on average, incurred lower O&M
costs than those installed earlier. Specifically, capacity-weighted average 2000–2012 O&M costs
for the 24 projects in the sample constructed in the 1980s equal $34/MWh, dropping to
$23/MWh for the 37 projects installed in the 1990s, and to $10/MWh for the 74 projects installed
since 2000.
50
This drop in O&M costs may be due to a combination of at least two factors: (1)
O&M costs generally increase as turbines age, component failures become more common, and
manufacturer warranties expire;
51
and (2) projects installed more recently, with larger turbines
and more sophisticated designs, may experience lower overall O&M costs on a per-MWh basis.
50
If expressed instead in terms of $/kW-year, capacity-weighted average 2000–2012 O&M costs were $66/kW-year
for projects in the sample constructed in the 1980s, dropping to $55/kW-year for projects constructed in the 1990s,
to $28/kW-year for projects constructed in the 2000s, and to $25/kW-year for projects constructed since 2010.
Somewhat consistent with these observed O&M costs, Bloomberg NEF (2013d) reports the cost of 5-year full-
service O&M contracts as having declined from $43/kW-year in the 2007–2009 period to less than $25/kW-year in
early 2013. An NREL analysis based on data from DNV KEMA and GL Garrad Hassan covering roughly 10 GW of
operating wind projects also shows average levels of expenditure consistent with the Berkeley Lab dataset, at least
when focusing on turbine and balance-of-plant O&M costs for projects commissioned in the 2000s (Lantz 2013).
51
Many of the projects installed more recently may still be within their turbine manufacturer warranty period, and/or
may have capitalized O&M service contracts within their turbine supply agreement. Projects choosing the Section
1603 cash grant over the PTC may have had a particular incentive to capitalize service contracts (18 projects totaling
roughly one-third of the sample capacity installed since 2000 were installed from 2009-2011 – i.e., within the period
0
10
20
30
40
50
60
70
1982
1983
1984
1985
1986
1987
1988
1989
1990
1991
1992
1993
1994
1995
1996
1997
1998
1999
2000
2001
2002
2003
2004
2005
2006
2007
2008
2009
2010
2011
Commercial Operation Date
Projects with no 2012 O&M data
Projects with 2012 O&M data
Polynomial Trend Line (all projects)
Average Annual O&M Cost 2000-2012
(2012 $/MWh)
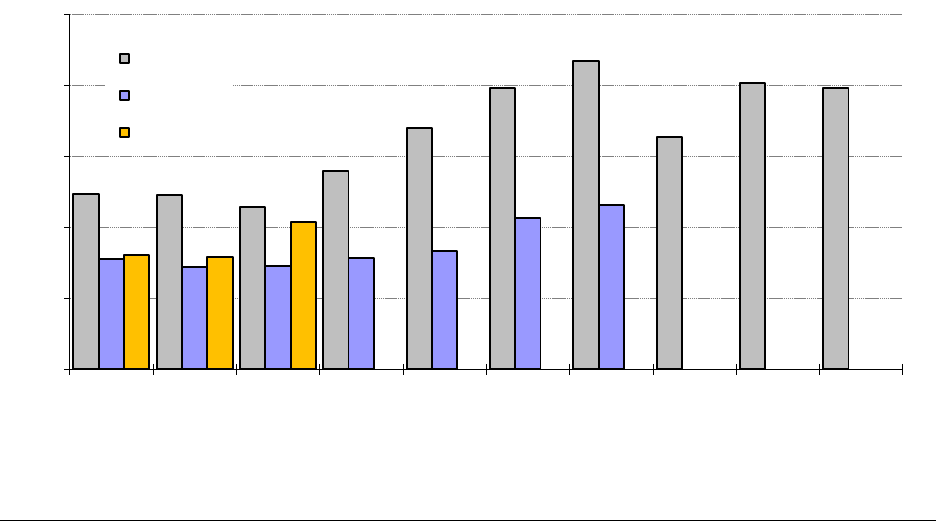
2012 Wind Technologies Market Report
40
Although limitations in the underlying data do not permit the influence of these two factors to be
unambiguously distinguished, to help illustrate key trends, Figure 26 shows median annual O&M
costs over time, based on project age (i.e., the number of years since the commercial operation
date) and segmented into three project-vintage groupings. Data for projects under 5 MW in size
are excluded, to help control for the confounding influence of economies of scale. Note that, at
each project age increment and for each of the three project vintage groups, the number of
projects used to compute median annual O&M costs is limited and varies substantially (from 3 to
31 data points per project-year for projects installed from 1998 through 2004, from 2 to 25 data
points per project-year for projects installed from 2005 through 2008, and from 9 to 18 data
points per project-year for projects installed from 2009 through 2011).
With these limitations in mind, Figure 26 shows an upward trend in project-level O&M costs as
projects age, although the sample size after year 4 is limited. In addition, the figure shows that
projects installed more recently (from 2005–2008 and/or 2009-2011) have had, in general, lower
O&M costs than those installed in earlier years (from 1998–2004), at least for the first 7 years of
operation. Parsing the “recent project” cohort into two sub-periods, however, reveals that
projects installed from 2009-2011 had higher median O&M costs than those installed from 2005-
2008 (though cost differences are small, particularly in the first two years operations, and sample
size is limited). This last finding is consistent with a recent National Renewable Energy
Laboratory (NREL) analysis based on data from GL Garrad Hassan covering the first two years
of operations for more than 3 GW of operating wind capacity (Lantz 2013); that analysis also
suggests that turbine O&M costs may have actually increased among projects installed after
2008. In contrast, the Bloomberg NEF (2013d) data mentioned in footnote 50 portrays lower
O&M costs since the 2007-2009 period.
Source: Berkeley Lab; medians shown only for groups of two or more projects, and only projects >5 MW are included
Figure 26. Median Annual O&M Costs by Project Age and Commercial Operation Date
of eligibility for the Section 1603 grant – though only two of these eighteen projects actually elected the grant over
the PTC). In either case, reported O&M costs will be artificially low.
0
5
10
15
20
25
1 2 3 4 5 6 7 8 9 10
Project Age (Number of Years Since Commercial Operation Date)
1998-2004
2005-2008
2009-2011
Commercial Operation Date:
n=18
Median Annual O&M Cost (2012 $/MWh)
n=23
n=20
n=8
n=5
n=3
n=4
n=31
n=25
n=23
n=25
n=25
n=11
n=3
n=4
n=6
n=2
n=18
n=12
n=9

2012 Wind Technologies Market Report
41
As indicated previously, the data presented in Figures 25 and 26 include only a subset of total
operating expenses. In comparison, the financial statements of public companies with sizable
U.S. wind project assets indicate markedly higher total operating costs. Specifically, two
companies—Infigen and EDP Renováveis (EDPR), which together represented approximately
4,730 MW of installed capacity at the end of 2012 (nearly all of which has been installed since
2000)—report total operating expenses of $23.2/MWh and $23.9/MWh, respectively, for their
U.S. wind project portfolios in 2012 (EDPR 2013, 2012; Infigen 2013, 2012, 2011).
52
These total
operating expenses are more than twice the $10/MWh average O&M cost reported above for the
74 projects in the Berkeley Lab data sample installed since 2000.
This disparity in operating costs between these two project owners and the Berkeley Lab data
sample reflects, in large part, differences in the scope of expenses reported. For example, Infigen
breaks out its total U.S. operating expense in 2012 ($23.2/MWh) into four categories: asset
management and administration ($4.0/MWh), turbine O&M ($10.6/MWh), balance of plant
($2.4/MWh), and other direct costs ($6.1/MWh). Among these four categories, the combination
of turbine O&M and balance of plant ($13/MWh in total) is likely most comparable to the scope
of data reported in the Berkeley Lab sample. Similarly, EDPR breaks out its total U.S. operating
costs in 2012 ($23.9/MWh) into three categories: supplies and services, which “includes O&M
costs” ($15.1/MWh); personnel costs ($3.8/MWh); and other operating costs, which “mainly
includes operating taxes, leases, and rents” ($5.1/MWh). Among these three categories, the
$15.1/MWh for supplies and services is probably closest in scope to the Berkeley Lab data.
Confirming these basic findings, the recent NREL analysis based on data from DNV KEMA on
plants commissioned before 2009 shows total operating expenditures of $40–$60/kW-year
depending on project age, with turbine and balance-of-plant O&M costs representing roughly
half of those expenditures (Lantz 2013).
Finally, Infigen—whose 1,089-MW U.S. wind portfolio has remained unchanged since 2009—
reports a significant escalation in total average operating costs over the past 3 years: an 11%
increase from $19.7/MWh in 2010 to $21.9/MWh in 2011, followed by another 6% increase to
$23.2/MWh in 2012 (all expressed in 2012 dollars). Meanwhile, EDPR’s U.S. operating costs
escalated 8% from $22.8/MWh in 2010 to $24.6/MWh in 2011, before falling 3% to $23.9/MWh
in 2012 (again, all in 2012 dollars). The fact that EDPR has been adding new projects to its U.S.
portfolio over this period (e.g., roughly 200 MW added in both 2011 and 2012) complicates
analysis of changes to its operating costs based on project age. Nonetheless, the overall trend
apparent in the Infigen data is directionally consistent with the previously reported Berkeley Lab
sample and with the NREL analysis, both of which show increased O&M costs as projects age.
52
Infigen’s operating expenses could be considered to be higher than indicated, given that reported costs do not
include certain capital expenditures related to the replacement of turbines and/or turbine components among its
portfolio of U.S. wind projects.
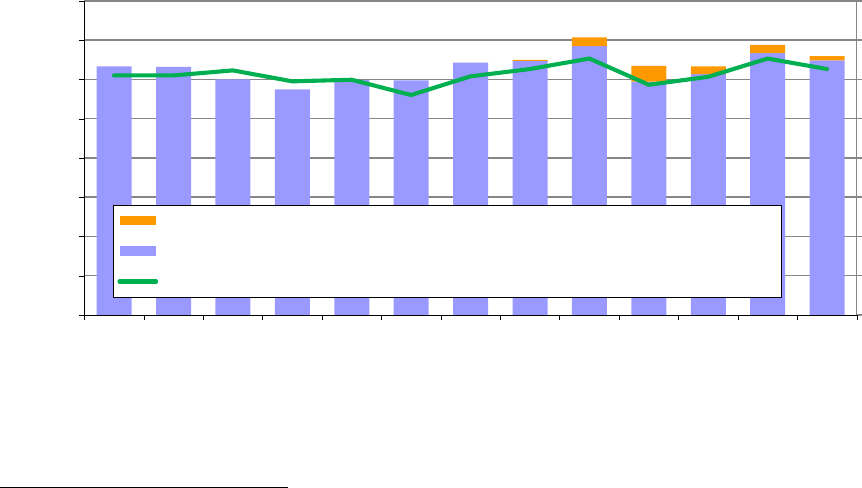
2012 Wind Technologies Market Report
42
5. Performance Trends
This chapter presents data from a Berkeley Lab compilation of project-level capacity factors. The
full data sample consists of 446 wind power projects built between 1998 and 2011 and totaling
42,844 MW (91% of nationwide installed wind power capacity at the end of 2011).
53
The
following discussion of performance trends is divided into three subsections: the first analyzes
trends in sample-wide capacity factors over time, the second looks at variations in capacity
factors by project vintage, and the third focuses on regional variations.
Trends in Sample-Wide Capacity Factors Were Impacted by Curtailment
and Inter-Year Wind Resource Variability
The blue bars in Figure 27 show the average sample-wide capacity factor in each calendar year
among a progressively larger cumulative sample in each year.
54
Viewed this way—on a
cumulative, sample-wide basis—one might expect to see a gradual improvement in capacity
factor over time, as newer and larger turbines are added to the fleet each year. Although capacity
factors have generally been higher on average in more recent years (e.g., 32.1% from 2006–2012
versus 30.3% from 2000–2005), the trend is not as significant or consistent as expected. Two key
factors that influence these trends are discussed below: wind power curtailment and inter-year
variability in the strength of the wind resource. A third factor, the average quality of the wind
resource in which projects are located, is discussed in the next section.
Source: Berkeley Lab
Figure 27. Average Cumulative Sample-Wide Capacity Factor by Calendar Year
53
Although some performance data for wind power projects installed in 2012 are available, those data do not span
an entire year of operations. As such, for the purpose of this section, the focus is on projects with commercial
operation dates from 1998 through 2011.
54
There are fewer individual projects—although more capacity—in the cumulative sample for 2012 than there are
for 2011. This is due to the sampling method used by EIA, which focuses on a subset of larger projects throughout
the year, before eventually capturing the entire sample some months after the year has ended. As a result, it might be
late 2013 before EIA reports 2012 performance data for all of the wind power projects that it tracks, and in the
meantime this report is left with a smaller sample consisting mostly of the larger projects in each state.
0.00
0.15
0.30
0.45
0.60
0.75
0.90
1.05
1.20
0%
5%
10%
15%
20%
25%
30%
35%
40%
2000
10
591
2001
30
943
2002
73
2,682
2003
84
3,128
2004
106
4,500
2005
129
5,142
2006
153
7,967
2007
196
9,951
2008
240
14,926
2009
339
23,617
2010
452
33,381
2011
516
38,561
2012
446
42,844
Long-Term Wind Resource Index
Sample-Wide Capacity Factor
Capacity Factor Based on Estimated Generation (if no curtailment in subset of regions)
Capacity Factor Based on Actual Generation (with curtailment)
Wind Resource Index (right scale)
# MW:
# Projects:
Year:

2012 Wind Technologies Market Report
43
Wind Power Curtailment: Curtailment of wind project output due to transmission inadequacy,
minimum generation limits, and/or other forms of grid inflexibility (and, as a consequence, low
or negative wholesale electricity prices) has become more common across the United States as
wind development has become more significant and widespread. That said, in areas where
curtailment has been particularly problematic in the past—principally in Texas—steps taken to
address the issue have started to bear fruit. For example, Table 5 shows that less than 4% of
potential wind energy generation within the Electric Reliability Council of Texas (ERCOT) was
curtailed in 2012, down sharply from 17% in 2009 and 8.5% in 2011.
55
The data included in
Table 5 for ERCOT include both “forced” (i.e., required by the grid operator) and “economic”
(i.e., voluntary as a result of market prices) curtailment, whereas for many of the other regions
shown in the table, the data only include forced curtailment. As a result, outside of ERCOT, the
data presented in table may understate the level of total curtailment experienced by wind power
projects. Nonetheless, a number of these other regions continue to grapple with lesser amounts of
forced curtailment, and still others—such as SPP, PJM, NYISO, and ISO-NE—have only
recently developed or are just now developing the tools to enable them to track it in the future. In
aggregate, assuming a 33% average capacity factor, the total amount of curtailed wind
generation tracked in Table 5 for 2012 equates to the annual output of roughly 715 MW of wind
power capacity.
Looked at another way, wind power curtailment has reduced sample-wide average capacity
factors in recent years. While the blue bars in Figure 27 reflect actual capacity factors—i.e.,
including the negative impact of curtailment events—the orange bars add back in the estimated
amount of wind generation that has been forced to curtail in recent years within the seven
territories shown in Table 5, to estimate what the sample-wide capacity factors would have been
absent this curtailment. As shown, sample-wide capacity factors would have been on the order of
1–2 percentage points higher nationwide from 2008 through 2012 absent curtailment in just this
subset of regions. Estimated capacity factors would have been even higher if comprehensive
forced and economic curtailment data were available for all regions.
Inter-Year Wind Resource Variability: The strength of the wind resource varies from year to
year, in part in response to significant persistent weather patterns such as El Niño/La Niña. The
green line in Figure 27 shows that—although better than 2009 and 2010—2012 was not as good
of a year as was 2011 or 2008 in terms of the national wind energy resource.
56
It is also evident
that movements in sample-wide capacity factor from year to year are heavily influenced by the
natural inter-year variability in the strength of the national wind resource.
55
The significant reduction in ERCOT curtailment since 2009 is, in part, attributable to a private 229-mile
transmission line built by NextEra Energy in late 2009 to move power from its 735.5-MW Horse Hollow project out
of the congested West zone and into the uncongested South zone. As a result, Horse Hollow’s capacity factor
increased from just 20% in 2009 to 29% in 2010, 2011, and 2012. Several transmission line upgrades related to the
Texas competitive renewable energy zone effort have also helped reduce curtailment in ERCOT, as has the move to
more-efficient wholesale electric market designs.
56
The green line in Figure 27 estimates changes in the strength of the average nationwide wind resource from year
to year and is derived from data presented by NextEra Energy Resources in its quarterly earnings reports.
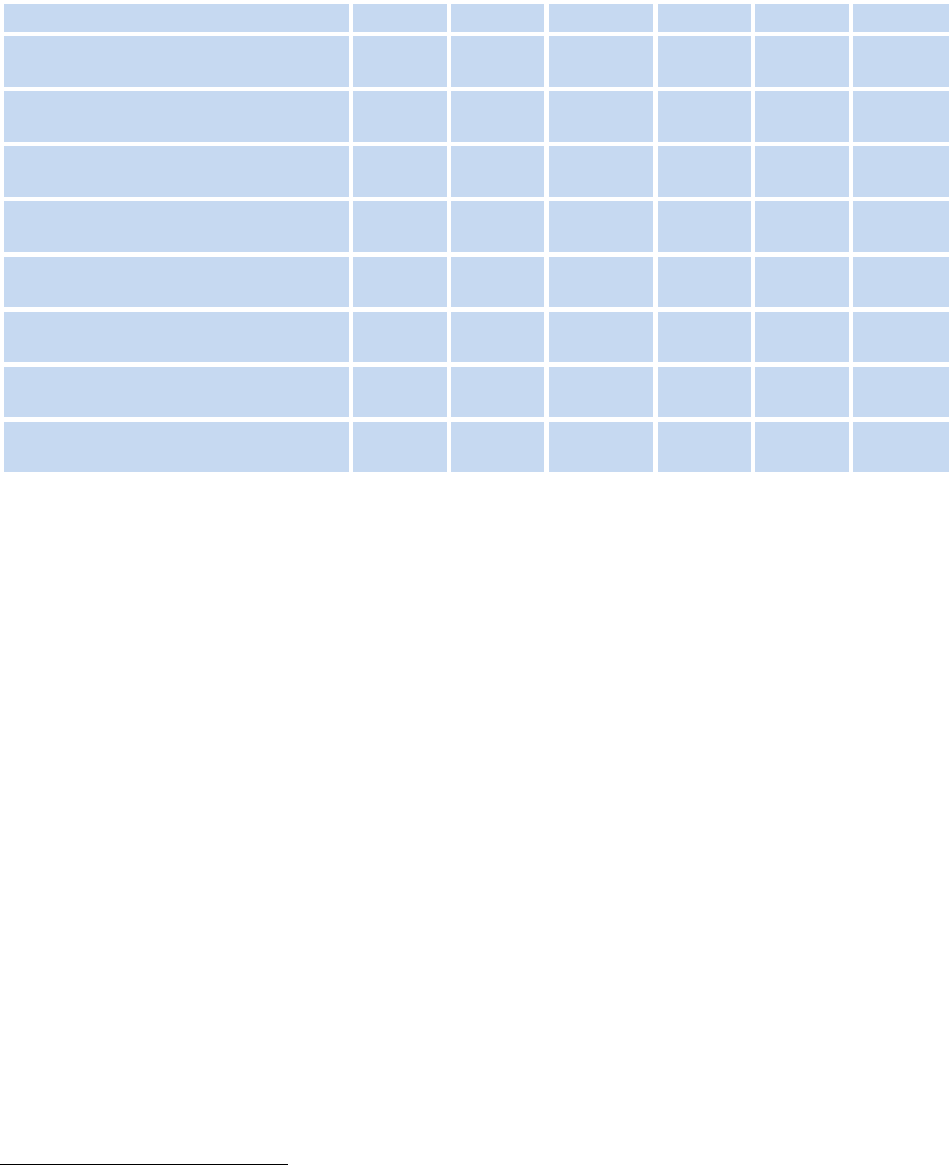
2012 Wind Technologies Market Report
44
Table 5. Estimated Wind Curtailment in Various Areas, in GWh
(and as a percentage of potential wind generation)
2007
2008
2009
2010
2011
2012
Electric Reliability Council of Texas
(ERCOT)
109.1
(1.2%)
1,416.6
(8.4%)
3,872.2
(17.1%)
2,066.5
(7.7%)
2,621.5
(8.5%)
1,038.0
(3.7%)
Southwestern Public Service
Company (SPS)
N/A
0
(0.0%)
0
(0.0%)
0.9
(0.0%)
0.5
(0.0%)
N/A**
Public Service Company of
Colorado (PSCo)
N/A
2.5
(0.1%)
19.0
(0.6%)
81.5
(2.2%)
63.9
(1.4%)
N/A**
Northern States Power Company
(NSP)
N/A
25.4
(0.9%)
42.4
(1.7%)
44.3
(1.7%)
58.7
(1.6%)
120.5
(3.1%)
Midcontinent Independent System
Operator (MISO) less NSP
N/A N/A
249.6
(2.0%)
779.7
(4.2%)
782.6
(3.4%)
726.2
(2.5%)
Bonneville Power Administration
(BPA)
N/A N/A N/A
4.6*
(0.1%)
128.7*
(1.4%)
70.8*
(0.7%)
PJM N/A N/A N/A N/A N/A
111.6
#
(1.8%)
#
Total Across These Seven Areas:
109
(1.2%)
1,444
(5.7%)
4,183
(9.7%)
2,978
(4.9%)
3,656
(4.9%)
2,067
(2.7%)
*A portion of BPA’s curtailment is estimated assuming that each curtailment event lasts for half of the maximum possible hour
for each event.
#
2012 curtailment numbers for PJM are for June through December only (data for January through May are not available).
**Xcel Energy declined to provide 2012 curtailment data for its SPS and PSCo service territories.
Source: ERCOT, Xcel Energy, MISO, BPA, PJM
Average Capacity Factors for Projects Built After 2005 Have Been
Stagnant: Turbine Design Changes Boosted Capacity Factors, while
Project Build-Out in Lower-Quality Resource Areas Pushed the Other Way
One way to control for the time-varying influences described in the previous section (e.g., annual
wind resource variations or changes in the amount of wind curtailment) is to focus exclusively
on capacity factors in a single year, such as 2012.
57
As such, whereas Figure 27 presents capacity
factors in each calendar year, Figure 28 instead shows only capacity factors in 2012, broken out
by project vintage.
Figure 28 shows an increase in generation-weighted average 2012 capacity factors when moving
from projects installed in the 1998–1999 period to those installed in the 2004–2005 period. There
is also a clear increase among more recent vintages in the maximum 2012 capacity factor attained
by any individual project, with several projects built in 2010 or 2011 exceeding a 50% net
capacity factor in 2012. Somewhat surprisingly, however, given the significant scaling in turbine
design over the years, average 2012 capacity factors do not show an increasing trend among
post-2005 project vintages.
57
Although focusing just on 2012 does control (at least loosely) for some of these known time-varying impacts, it
also means that the absolute capacity factors shown in Figure 28 may not be representative over longer terms if 2012
was not a representative year in terms of the strength of the wind resource or wind power curtailment.

2012 Wind Technologies Market Report
45
Source: Berkeley Lab
Figure 28. 2012 Project Capacity Factors by Commercial Operation Date
This listless post-2005 trend in capacity factors can be at least partially explained by two
competing influences among more recent project vintages: a continued decline in average
specific power (which should boost capacity factors, all else equal) versus a build-out of lower-
quality wind resource sites (which should hurt capacity factors, all else equal).
Specific Power: Figure 16 demonstrated that the average hub height, rotor diameter, and
nameplate capacity of turbines installed in the United States have all been increasing over time
but that growth in the swept area of the rotor has increased the fastest. With growth in average
swept area (in m
2
) outpacing growth in average nameplate capacity (in W), there has been a
decline in the average “specific power” (in W/m
2
) among the U.S. turbine fleet over time, from
around 400 W/m
2
among projects installed from 1998–2001 to 283 W/m
2
among projects
installed in 2012 (Figure 29). All else equal, a lower average specific power will boost capacity
factors, because there is more swept rotor area available (resulting in greater energy capture) for
each watt of rated turbine capacity, meaning that the generator is likely to run closer to or at its
rated capacity more often. Hence, based on the decline in average specific power shown in
Figure 29, one would expect average capacity factors to have increased among newer project
vintages. This is especially true from 1998–1999 to 2006 projects (a trend that is largely
observed in Figure 28) and then from 2009 to 2012 (which is not apparent in Figure 28); specific
power was essentially flat from 2006–2009 (as was hub height), thereby partially explaining the
lackluster trend in Figure 28 over this period. Since 2012-vintage projects are not yet in our
capacity factor sample (due to lack of a full year of operating experience), the impact of the
substantial decline in specific power in that year on capacity factors is likely to be more evident
in future editions of this report.
0%
10%
20%
30%
40%
50%
60%
1998-99
23
776
2000-01
24
1,514
2002-03
36
1,908
2004-05
27
3,417
2006
20
1,640
2007
34
4,931
2008
76
8,513
2009
95
9,561
2010
48
4,731
2011
63
5,854
Generation-Weighted Average (by project vintage)
Individual Project (by project vintage)
2012 Capacity Factor (by project vintage)
Sample includes 446 projects totaling 42.8 GW
Vintage:
# projects:
# MW:

2012 Wind Technologies Market Report
46
Figure 29. Index of Wind Resource Quality at 80 Meters vs. Specific Power
Average Wind Resource Quality: Counterbalancing the decline in specific power, however,
and especially among projects installed from 2009 through 2012, has been a commensurate
decline over time in the average quality of the wind resource in which projects are located. For
example, Figure 29 shows that the average estimated quality of the wind resource at 80 meters
among projects built in 2012 is roughly 15% lower than it is among projects built back in 1998–
1999 and that the decline has been particularly sharp since 2008.
58
This trend of building wind
power projects in progressively lower-quality wind resource areas is a key reason that average
capacity factors have not increased for projects installed from 2009 through 2011. The trend may
also come as a surprise, given that the United States still has an abundance of undeveloped high-
quality wind resource areas. Several different factors could be driving this trend:
• Technology Change: The increased availability of low-wind-speed turbines that feature
higher hub heights and a lower specific power may have enabled the economic build-out of
lower-wind-speed sites.
• Siting Impacts: Developers may have reacted to increasing transmission constraints (or
other siting constraints, or even just regionally differentiated wholesale electricity prices) by
focusing on those projects in their pipeline that may not be located in the best wind resource
areas but that do have access to transmission (or higher-priced markets, or readily available
sites without long permitting times).
• Policy Influence: Projects built in the 4-year period from 2009 through 2012 have been able
to access a 30% ITC or cash grant in lieu of the PTC. Because the dollar amount of the ITC
or grant is not dependent on how much electricity a project generates, it is possible that
developers have seized this limited opportunity to build out the less-energetic sites in their
development pipelines. Additionally, state RPS requirements sometimes require or motivate
in-state or in-region wind development in lower wind resource regimes.
58
Estimates of wind resource quality are based on site estimates of gross capacity factor at 80 meters, as derived
from nationwide wind resource maps created for NREL by AWS Truepower; further details are found in the
Appendix.
275
305
335
365
395
425
75
80
85
90
95
100
1998-99 2000-01 2002-03 2004-05 2006 2007 2008 2009 2010 2011 2012
Commercial Operation Date
Average 80m Wind Resource Quality Among Built Projects (left scale)
Average Specific Power Among Built Projects (right scale)
Index of Wind Resource Quality at 80m (1998-99=100)
Specific Power (W/m^2 )
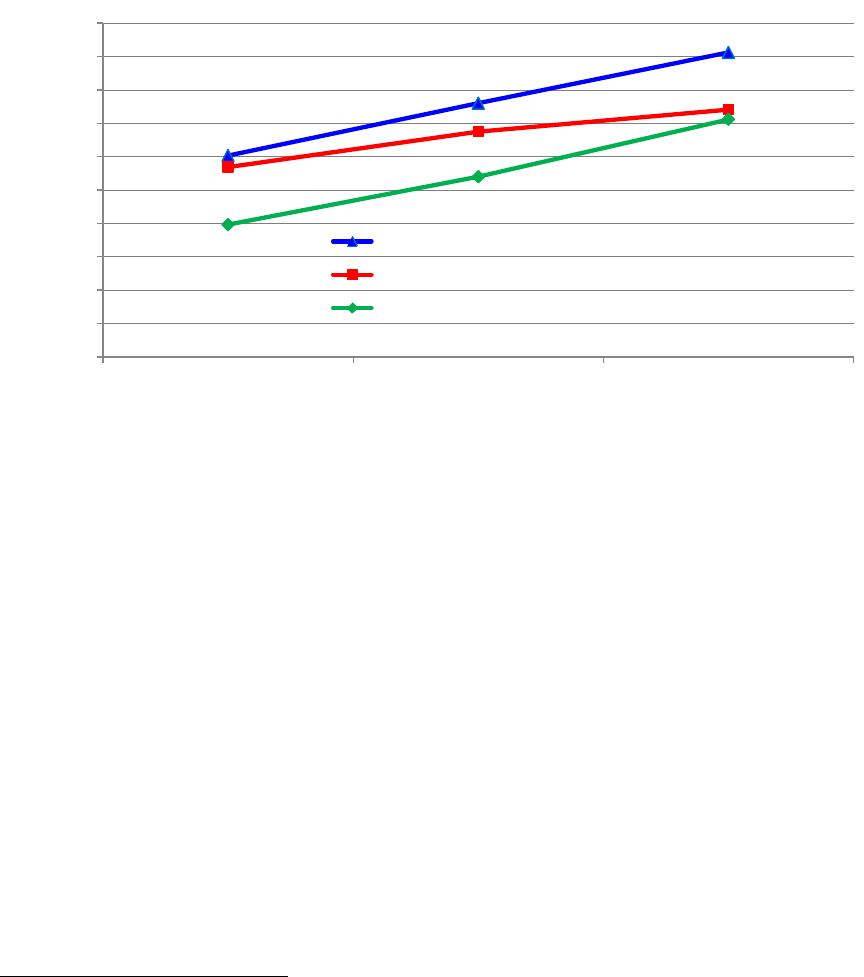
2012 Wind Technologies Market Report
47
In an attempt to disentangle the competing influences of turbine design evolution and lower wind
resource quality on capacity factor, Figure 30 controls for each. Across the x-axis, projects are
grouped into three different categories of wind resource quality.
59
Within each wind resource
category, projects are further differentiated by their specific power, resulting in the three lines
plotted on the graph. As one would expect, projects sited in higher-wind-speed areas have higher
capacity factors than those in low-wind-speed areas, regardless of specific power. Likewise,
within each of the three wind resource categories along the x-axis, projects that fall into a lower
specific power range have higher capacity factors than those in a higher specific power range.
Figure 30. Impact of Wind Resource Quality and Specific Power on Capacity Factor
As a result, notwithstanding the recent build-out of lower-quality wind resource sites, it is clear
that turbine design changes (specifically, larger rotors and therefore also lower specific power,
but also to a lesser extent higher hub heights) are driving capacity factors higher for projects
located in fixed wind resource regimes.
Regional Variations in Capacity Factor Reflect the Strength of the Wind
Resource
The project-level spread in capacity factors shown in Figure 28 is enormous, with 2012 capacity
factors ranging from 17% to 51% among just those projects built in 2011. Some of this spread is
attributable to regional variations in average wind resource quality.
Figure 31 shows the regional variation in 2012 capacity factors (using the regional definitions
shown in Figure 24, earlier) based on a subsample of wind power projects built in 2010 or 2011.
For this sample of projects, generation-weighted average capacity factors are the highest in the
59
Based on site estimates of gross capacity factor at 80 meters by AWS Truepower, the “lower” category includes
all projects with an estimated gross capacity factor of 30%–40%, the “medium” category corresponds to 40%–50%,
and the “higher” category includes any project exceeding 50%.
0%
5%
10%
15%
20%
25%
30%
35%
40%
45%
50%
Lower
(138 projects, 11.1 GW)
Medium
(229 projects, 25 GW)
Higher
(88 projects, 6 GW)
Wind Resource Quality
Specific Power Range of 200-300 (45 projects & 5,048 MW)
Specific Power Range of 300-400 (379 projects & 34,769 MW)
Specific Power Range of 400-500 (31 projects & 2,260 MW)
455 projects totaling 42.1 GW with commercial operation date of 1998-2011
Net Capacity Factor (in 2011 and/or 2012)

2012 Wind Technologies Market Report
48
Interior region (37%) and the lowest in the Southeast (24.7%) and Northeast (25.2%). Not
surprisingly, these regional rankings are roughly consistent with relative average wind speed
within each region, as shown in Figure 24.
60
Source: Berkeley Lab
Figure 31. 2012 Capacity Factors by Region: 2010–2011 Projects Only
Taken together, Figures 27–31 suggest that, in order to understand trends in empirical capacity
factors, one needs to consider (and ideally control for) a variety of factors. These include not
only wind power curtailment and the evolution in turbine design, but also a variety of spatial and
temporal wind resource considerations—for example, the quality of the wind resource where
projects are located as well as inter-year wind resource variability.
60
Given the relatively small sample size in some regions, as well as the possibility that certain regions may have
experienced a particularly good or bad wind resource year or different levels of wind energy curtailment in 2012,
care should be taken in extrapolating these results.
0%
10%
20%
30%
40%
50%
60%
Southeast
4 projects
308 MW
Northeast
6 projects
289 MW
West
37 projects
2,452 MW
Great Lakes
15 projects
2,077 MW
Interior
48 projects
5,430 MW
Generation-Weighted Average (by region)
Generation-Weighted Average (total U.S.)
Individual Project (by region)
2012 Capacity Factor
Sample includes 110 projects built in 2010 or 2011 and totaling 10.6 GW

2012 Wind Technologies Market Report
49
6. Wind Power Price Trends
Earlier sections documented trends in wind turbine prices, installed project costs, O&M costs,
and capacity factors—all of which are determinants of the wind power PPA prices presented in
this chapter. In general, higher-cost and/or lower-capacity-factor projects will require higher
PPA prices, while lower-cost and/or higher-capacity-factor projects can have lower PPA prices.
Berkeley Lab collects data on wind PPA prices from the sources listed in the Appendix, resulting
in a dataset that currently consists of 302 PPAs totaling 24,626 MW from wind projects installed
between 1998 and the end of 2012. Although this sample represents just 42% of all wind power
capacity built in the United States over the 1998–2012 timeframe, it represents 70% of the wind
power capacity that was built over this period and that sells power through a “bundled” PPA
(i.e., a PPA that bundles together the sale of electricity and renewable energy certificates, or
RECs).
61
Throughout this chapter, PPA prices are expressed on a levelized basis over the full term of each
contract and are reported in real 2012 dollars.
62
Whenever individual PPA prices are averaged
together (e.g., within a region or over time), the average is generation weighted.
63
Whenever they
are broken out by time, the date on (or year in) which the PPA was signed or executed is used, as
that date provides the best indication (i.e., better than commercial operation date) of market
conditions at the time. Finally, because the PPA prices in the Berkeley Lab sample are reduced
by the receipt of state and federal incentives (e.g., the levelized PPA prices reported here would
be at least $20/MWh higher without the PTC, ITC, or Treasury Grant), and are also influenced
by various local policies and market characteristics, they do not directly represent wind energy
generation costs.
This chapter summarizes wind PPA prices in a number of different ways: by PPA execution date,
by region, and compared to wholesale power prices both nationwide and regionally. In addition,
REC prices are presented in a text box on page 54.
61
The 58,878 MW of wind power capacity built in the United States from 1998–2012 can be broken down as
follows: 13,750 MW sell power on a merchant basis (no PPA); 9,082 MW are owned by utilities (no PPA); 389 MW
are located in Alaska, Hawaii, or Puerto Rico (excluded as potential outliers); 268 MW are interconnected on the
customer side of the meter (no PPA); and the remaining 35,388 MW are potential candidates for inclusion in
Berkeley Lab’s bundled PPA database. The 24,626 MW currently in our sample therefore represents 70% of the
total potential PPA sample. Much of the roughly 10.7 GW of wind power capacity missing from our sample is
located in Texas, where projects within ERCOT fall outside of FERC’s jurisdiction and are therefore not required to
report price information to the same extent as are other projects.
62
Having full-term price data (i.e., pricing data for the full duration of each PPA, rather than just historical PPA
prices) enables us to present these PPA prices on a levelized basis (levelized over the full contract term), which
provides a complete picture of wind power pricing (e.g., by capturing any escalation over the duration of the
contract). Contract terms range from 10 to 35 years, with 20 years being by far the most common. Prices are
levelized using a 7% real discount rate.
63
Generation weighting is based on the empirical project-level performance data analyzed in the previous chapter of
this report and assumes that historical project performance (in terms of annual capacity factor as well as daily and/or
seasonal production patterns where necessary) will hold into the future as well. In cases where there is not enough
operational history to establish a “steady-state” pattern of performance, we used discretion in estimating appropriate
weights (to be updated in the future as additional empirical data become available).

2012 Wind Technologies Market Report
50
Wind Power Purchase Agreement Prices Generally Have Been Falling Since
2009 and Now Rival Previous Lows Set a Decade Ago (Despite the Trend
Towards Lower-Quality Wind Resource Sites)
Figure 32 plots project-level levelized wind PPA prices by contract execution date, showing a
clear downward trend in PPA prices since 2009—both overall and by region (see Figure 24 for
regional definitions). This trend is particularly evident within the Interior region, which—as a
result of its low average project costs and high average capacity factors shown earlier in this
report—also tends to be the lowest-priced region over time. Prices generally have been higher in
the rest of the United States and have been particularly high in the West in recent years.
64
Note: Size of “bubble” is proportional to project nameplate capacity.
Figure 32. Levelized Wind PPA Prices by PPA Execution Date and Region
Figure 33 provides a smoother look at the time trend nationwide (the blue bars) by averaging the
individual levelized PPA prices shown in Figure 32 by year. After topping out at nearly
$70/MWh for PPAs executed in 2009, the average levelized price of wind PPAs signed in
2011/2012—many of which were for projects built in 2012—fell to around $40/MWh
nationwide, which rivals previous lows set back in the 2000–2005 period.
64
Regional differences can affect not only project capacity factors (depending on the strength of the wind resource
in a given region), but also development and installation costs (depending on a region’s physical geography,
population density, labor rates, or even regulatory processes). It is also possible that regions with higher wholesale
electricity prices or with greater demand for renewable energy will, in general, yield higher wind energy contract
prices due to market factors. For example, recent high prices in the West may be due, in part, to aggressive
renewable energy policies (along with certain elements of policy design) in California, which give developers a
strong negotiating position. Relatively stringent permitting and regulatory requirements may also make California a
particularly expensive state in which to build wind power projects.
$0
$20
$40
$60
$80
$100
$120
Jan-96
Jan-97
Jan-98
Jan-99
Jan-00
Jan-01
Jan-02
Jan-03
Jan-04
Jan-05
Jan-06
Jan-07
Jan-08
Jan-09
Jan-10
Jan-11
Jan-12
Jan-13
PPA Execution Date
Interior (14,802 MW, 173 contracts)
West (6,835 MW, 68 contracts)
Great Lakes (2,356 MW, 33 contracts)
Northeast (855 MW, 20 contracts)
Southeast (268 MW, 6 contracts)
Levelized PPA Price (2012 $/MWh)
75 MW
150 MW
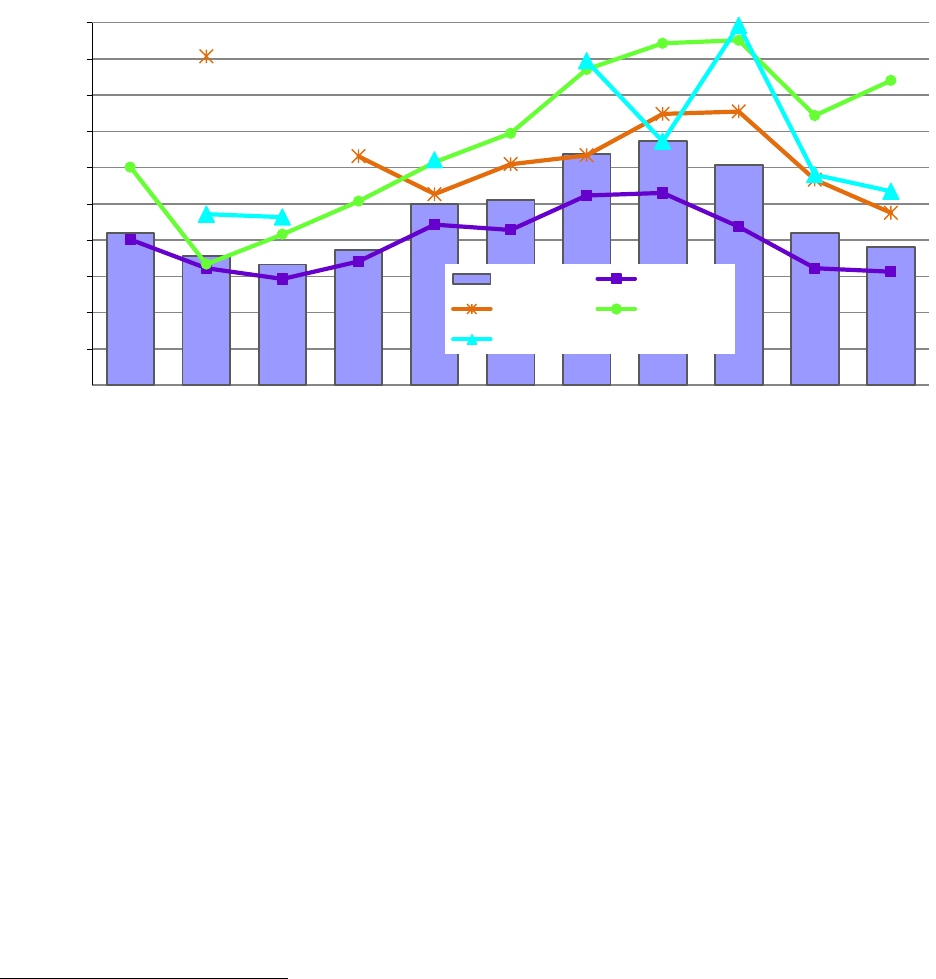
2012 Wind Technologies Market Report
51
While this temporal trend of rising and then falling PPA prices is directionally consistent with
the turbine price and installed project cost trends shown in earlier sections, the fact that PPA
prices have approached previous lows is nevertheless notable, given that installed project costs
have not returned to 2000–2005 levels (Figure 20) and that wind projects increasingly have been
sited in lower-quality wind resource areas (Figure 29). Clearly, the turbine scaling described in
Chapter 5, along with other improvements to turbine efficiency, have more than overcome these
headwinds to drive PPA prices lower.
Figure 33. Generation-Weighted Average Levelized Wind PPA Prices by PPA Execution
Date and Region
Figure 33 also shows trends in the generation-weighted average levelized PPA price over time
among four of the five regions broken out in Figure 32 (the Southeast region is omitted from
Figure 33 owing to its small sample size). Figures 32 and 33 both demonstrate that, based on our
data sample, PPA prices are generally low in the U.S. Interior, high in the West, and in the
middle in the Great Lakes and Northeast regions. The large Interior region, where much of U.S.
wind project development occurs, saw average levelized PPA prices of just over $30/MWh in
2011 and 2012.
Low Wholesale Electricity Prices Continued to Challenge the Relative
Economics of Wind Power
Figure 34 shows the range (minimum and maximum) of average annual wholesale electricity
prices for a flat block of power
65
going back to 2003 at 23 different pricing nodes located
throughout the country (refer to the Appendix for the names and approximate locations of the 23
65
A flat block of power is defined as a constant amount of electricity generated and sold over a specified period.
Although wind power projects do not provide a flat block of power, as a common point of comparison a flat block is
not an unreasonable starting point. In other words, the time variability of wind energy is often such that its wholesale
market value is somewhat lower than, but not too dissimilar from, that of a flat block of (non-firm) power.
$0
$10
$20
$30
$40
$50
$60
$70
$80
$90
$100
1996-99
10
553
2000-01
17
1,249
2002-03
24
1,382
2004-05
30
2,190
2006
30
2,311
2007
26
1,781
2008
39
3,465
2009
47
3,982
2010
40
3,999
2011
34
3,533
2012
8
630
Average Levelized PPA Price (Real 2012 $/MWh)
Nationwide Interior
Great Lakes West
Northeast
PPA Year:
Contracts:
MW:

2012 Wind Technologies Market Report
52
pricing nodes represented by the blue-shaded area). The dark diamonds represent the generation-
weighted average levelized wind PPA prices in the years in which contracts were executed
(consistent with the averages presented in Figure 33).
At least within the sample of projects reported here, average long-term wind PPA prices
compared favorably to yearly wholesale electricity prices from 2003 through 2008. Starting in
2009, however, the sharp drop in wholesale electricity prices (driven by lower natural gas prices)
squeezed average wind PPA prices out of the wholesale power price range on a nationwide basis.
Wind PPA prices have since fallen, however, and in 2011 and 2012 reconnected with the upper
end of the wholesale power price range.
Source: Berkeley Lab, FERC, Ventyx, IntercontinentalExchange
Figure 34. Average Levelized Long-Term Wind PPA Prices and Yearly Wholesale
Electricity Prices over Time
Although Figure 34 portrays a national comparison, there are clearly regional differences in
wholesale electricity prices and in the average price of wind power. Figure 35 focuses just on the
sample of wind PPAs signed in 2011 and/or 2012 and compares those levelized long-term PPA
prices to wholesale electricity prices in 2012 by region. The limited wind PPA sample size in
some regions must be noted. Nonetheless, based on our sample, wind PPA prices are most
competitive with wholesale power prices in the Interior region (where PPAs signed in 2011/2012
generally ranged from $20–$40/MWh) and are least competitive in the West (with a PPA price
range in 2011/2012 of under $50/MWh to over $90/MWh), with the Great Lakes and Northeast
regions falling in between (with a PPA price range of roughly $50–$70/MWh in 2011/2012).
0
10
20
30
40
50
60
70
80
90
100
2003
9
570
2004
13
547
2005
17
1,643
2006
30
2,311
2007
26
1,781
2008
39
3,465
2009
47
3,982
2010
40
3,999
2011
34
3,533
2012
8
630
2012 $/MWh
Nationwide Wholesale Power Price Range (by calendar year)
Generation-Weighted Average Levelized Wind PPA Price (by year of PPA execution)
Wind project sample includes projects
with PPAs signed from 2003
-2012
PPA year:
Contracts:
MW:

2012 Wind Technologies Market Report
53
Source: Berkeley Lab, Ventyx, IntercontinentalExchange
Figure 35. Levelized Long-Term Wind PPA Prices in 2011/2012 and Yearly Wholesale
Electricity Prices by Region
Important Note: Notwithstanding the comparisons made in Figures 34 and 35, neither the wind
nor wholesale electricity prices presented in this section reflect the full social costs of power
generation and delivery. Specifically, the wind PPA prices are reduced by virtue of federal and,
in some cases, state tax and financial incentives. Furthermore, these prices do not fully reflect
integration, resource adequacy, or transmission costs. At the same time, wholesale electricity
prices do not fully reflect transmission costs, may not fully reflect capital and fixed operating
costs, and are reduced by virtue of any financial incentives provided to fossil-fueled generation
and by not fully accounting for the environmental and social costs of that generation. In addition,
wind PPA prices—once established—are fixed and known, whereas wholesale electricity prices
are short term and therefore subject to change over time (EIA and others project natural gas
prices to rise, and therefore wholesale electricity prices to also increase, over time). Finally, the
location of the wholesale electricity nodes and the assumption of a flat block of power are not
perfectly consistent with the location and output profile of the sample of wind power projects.
In short, comparing levelized long-term wind PPA prices and yearly wholesale electricity
prices in this manner is not appropriate if one’s goal is to account fully for the costs and
benefits of wind energy relative to its competition. Another way to think of Figures 34 and 35,
however, is as loosely representing the decision facing wholesale electricity purchasers that are
otherwise under no obligation to purchase additional amounts of wind energy—i.e., whether to
contract long term for wind power or to buy a flat block of (non-firm) spot power on the
wholesale electricity market. In this sense, the costs represented in Figures 34 and 35 are
reasonably comparable in that they represent (to some degree, at least) what the power purchaser
would actually pay in the year in question.
0
10
20
30
40
50
60
70
80
90
100
Interior
28 projects
2,969 MW
Great Lakes
4 projects
219 MW
Northeast
3 projects
210 MW
West
7 projects
766 MW
Total US
42 projects
4,163 MW
Average 2012 Wholesale Power Price Range
Individual Project Levelized Wind PPA Price
Generation-Weighted Average Levelized Wind PPA Price
Wind project sample includes projects with PPAs signed in 2011 or 2012
2012 $/MWh
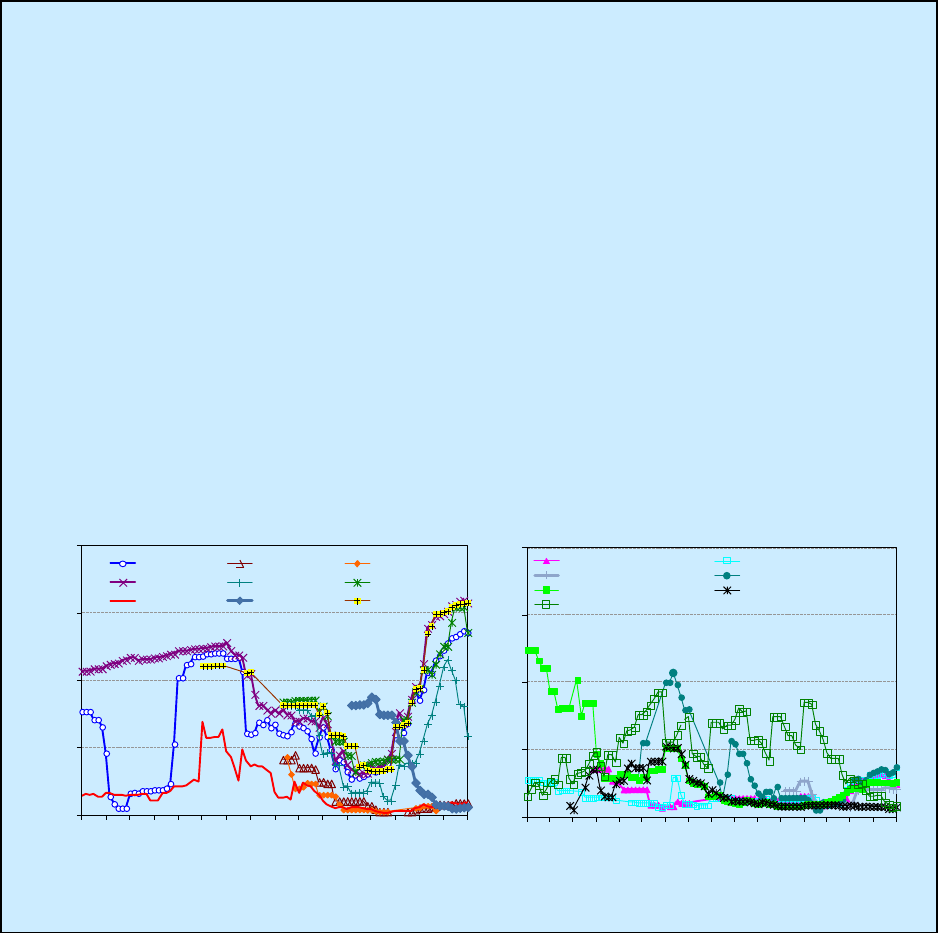
2012 Wind Technologies Market Report
54
REC Prices Rose in the Northeast, Remained Depressed Elsewhere
The wind power sales prices presented in this report reflect only the bundled sale of both electricity
and RECs; excluded are projects that sell RECs separately from electricity, thereby generating two
sources of revenue. REC markets are fragmented in the United States but consist of two distinct
segments: compliance markets, in which RECs are purchased to meet state RPS obligations, and green
power markets, in which RECs are purchased on a voluntary basis.
The figures below present indicative monthly data of spot-market REC prices in both compliance and
voluntary markets, grouped into High-Price and Low-Price markets; data for compliance markets
focus on the “Class I” or “Main Tier” of the RPS policies. Clearly, spot REC prices have varied
substantially, both across states and over time within individual states, although prices across states
within common regions (New England and PJM) are linked to varying degrees. Over the course of
2012, REC spot-market prices continued to rise among four Northeastern markets (Connecticut,
Massachusetts, New Hampshire, and Rhode Island), after their nadir in 2010 and early 2011, and
ended the year above $50/MWh. Elsewhere, however, REC prices for compliance markets generally
fell (e.g., for Ohio’s in-state RPS requirements) or remained below $5/MWh due to a continued
surplus of eligible renewable energy supply relative to RPS-driven demand. Prices for RECs offered
in the voluntary market remained at or fell below $1/MWh.
Sources: Evolution Markets (through 2007) and Spectron (2008 onward). Plotted values are the last monthly trade (if available)
or the mid-point of monthly bid and offer prices, for REC vintages from the current or nearest future year traded in each month.
$0
$5
$10
$15
$20
Jan-05
Jul-05
Jan-06
Jul-06
Jan-07
Jul-07
Jan-08
Jul-08
Jan
-09
Jul-09
Jan-10
Jul-10
Jan-11
Jul-11
Jan-12
Jul-12
Jan-13
Low-Price REC Markets
DC Tier 1
MD Tier 1
OH Out-of-State
PA Tier 1
TX
Voluntary Wind (National)
Voluntary Wind (West)
$0
$20
$40
$60
$80
Jan-05
Jul-05
Jan-06
Jul-06
Jan
-07
Jul-07
Jan-08
Jul
-08
Jan-09
Jul-09
Jan-10
Jul-10
Jan-11
Jul-11
Jan-12
Jul-12
Jan-13
High-Price REC Markets
CT Class I
DE Class I
IL Wind
MA Class I
ME New
NH Class I
NJ Class I
OH In-State
RI New
2012 $/MWh

2012 Wind Technologies Market Report
55
7. Policy and Market Drivers
Short-Term Extension of Federal Incentives for Wind Energy Has Helped
Restart the Domestic Market
Various policy drivers at both the federal and state levels have been important to the expansion
of the wind power market in the United States. At the federal level, the most important policy
incentives in recent years have been the PTC (or, if elected, the ITC), accelerated tax
depreciation, and an American Recovery and Reinvestment Act of 2009 (Recovery Act)
provision that enabled wind power projects to elect, for a limited time only, a 30% cash grant in
lieu of the PTC. Of more limited import to wind development has been DOE’s loan guarantee
program. Several of these federal incentives were extended via the American Taxpayer Relief
Act in January 2013.
• First established by the Energy Policy Act of 1992, the PTC provides a 10-year, inflation-
adjusted credit that stood at 2.2¢/kWh in 2012 (and was raised to 2.3¢/kWh in 2013). The
historical importance of the PTC to the U.S. wind power industry is illustrated by the
pronounced lulls in wind power capacity additions in the 3 years (2000, 2002, and 2004) in
which the PTC lapsed as well as the increased development activity often seen during the
year in which the PTC is otherwise scheduled to expire (see Figure 1); the spike in wind
additions in 2012 is a clear example of this latter effect. In January 2013, the PTC was
extended through the American Taxpayer Relief Act, as was the ability to take the 30% ITC
in lieu of the PTC. Wind power projects that begin construction before the end of 2013 will
now be eligible to receive the PTC or ITC. These provisions have helped restart the domestic
wind market and are expected to spur significant capacity additions in 2014 as projects that
begin construction in 2013 reach commercial operations.
• Accelerated tax depreciation enables wind project owners to depreciate the vast majority of
their investments over a 5- to 6-year period for tax purposes. An even more attractive 50%
1
st
-year “bonus depreciation” schedule was in place during 2008–2010. The Tax Relief,
Unemployment Insurance Reauthorization, and Job Creation Act of 2010 that was signed
into law in mid-December 2010 increased 1
st
-year bonus depreciation to 100% for those
projects placed in service between September 8, 2010 and the end of 2011, after which the
1
st
-year bonus reverted to 50% for projects placed in service during 2012. The American
Taxpayer Relief Act then extended this 50% bonus depreciation for qualifying property
placed in service in 2013 (and 2014 for certain long-lived property).
• The Recovery Act enabled wind power projects placed in service prior to the end of 2012 to
elect a 30% ITC in lieu of the PTC. More importantly, given the relative scarcity of tax
equity in the wake of the financial crisis, Section 1603 of the Recovery Act also enabled
wind power projects to elect a 30% cash grant from the Treasury in lieu of either the ITC or
the PTC. In order to qualify for the grant, wind power projects must have been under
construction by the end of 2011, must have applied for a grant by October 1, 2012, and must
have been placed in service by the end of 2012. As an indication of the popularity of this
option, 42% of the new wind capacity installed in 2012 elected the Section 1603 grant, a drop
from 62% of the capacity installed in 2011, 82% in 2010, and 66% in 2009.
• Another Recovery Act program, the Section 1705 loan guarantee program for commercial
projects, has also wound down, as projects had to be under construction by September 30,

2012 Wind Technologies Market Report
56
2011 in order to qualify. In total, this program closed on four loan guarantees to wind power
projects totaling 1,024 MW of capacity, 739 MW of which came online in 2012.
Although 2012 was another year with little concrete congressional action on what are seemingly
among the wind power industry’s two highest priorities—a longer-term extension of federal tax
(or cash) incentives and passage of a federal renewable or clean energy portfolio standard—the
near-term extension of the PTC/ITC has already helped restart the domestic wind market and
should enable moderate growth in capacity additions at least through 2014. Moreover, although
the lack of long-term federal incentives for wind energy has been a drag on the industry, the
prospective impacts of more-stringent EPA regulations on fossil plant retirements in future years
may create new markets for wind energy. Additionally, continued federal activity in wind project
siting and permitting has been viewed as a net positive; for example, progress continued
throughout 2012 on developing wind power projects on public lands.
State Policies Help Direct the Location and Amount of Wind Power
Development, but Current Policies Cannot Support Continued Growth at
Recent Levels
From 1999 through 2012, 69% of the wind power capacity built in the United States was located
in states with RPS policies; in 2012, this proportion was 83%.
66
As of June 2013, mandatory
RPS programs existed in 29 states and Washington D.C. (Figure 36).
67
Although no new state
RPS policies were passed in 2012, a number of states strengthened previously established RPS
programs. Attempts to weaken RPS programs also have been initiated increasingly in some
states, although those efforts have not—with few exceptions—led to meaningful changes in RPS
design thus far. In aggregate, existing state RPS policies are estimated to require roughly 110
GW of renewable capacity by 2035, including 95 GW of new renewable capacity beyond what
was already installed in each RPS state at the time that its RPS policy was established.
68
This
required additional renewable capacity is equivalent to roughly 7% of total projected U.S. retail
electricity sales in 2035 and 32% of projected load growth between 2000 and 2035.
Given the size of the RPS targets and the amount of new renewable energy capacity that has
been built since enactment of these policies, existing state RPS programs are projected by
Berkeley Lab to require average annual renewable energy additions of roughly 3–5 GW/year
(not all of which will be wind) between 2013 and 2020.
69
This is well below the 13 GW of wind
66
Such statistics provide only a rough indication of the impact of RPS policies on wind power development and
could either overstate or understate the actual policy effect to date.
67
Mandatory RPS policies and non-binding renewable energy goals also exist in a number of U.S. territories; these
are not shown in Figure 36.
68
Berkeley Lab’s projections of new renewable capacity required to meet each state’s RPS requirements assume
different combinations of renewable resource types for each RPS state, although they do not assume any biomass
co-firing at existing thermal plants. To the extent that RPS requirements are met with a larger proportion of high-
capacity-factor resources than assumed in this analysis or with biomass co-firing at existing thermal plants, the
required new renewable capacity would be lower than the projected amount presented here.
69
Again, varying combinations of renewable resource types for each RPS state were assumed in estimating the 3–5
GW/year of average annual renewable capacity additions required to meet RPS obligations through 2020. As one
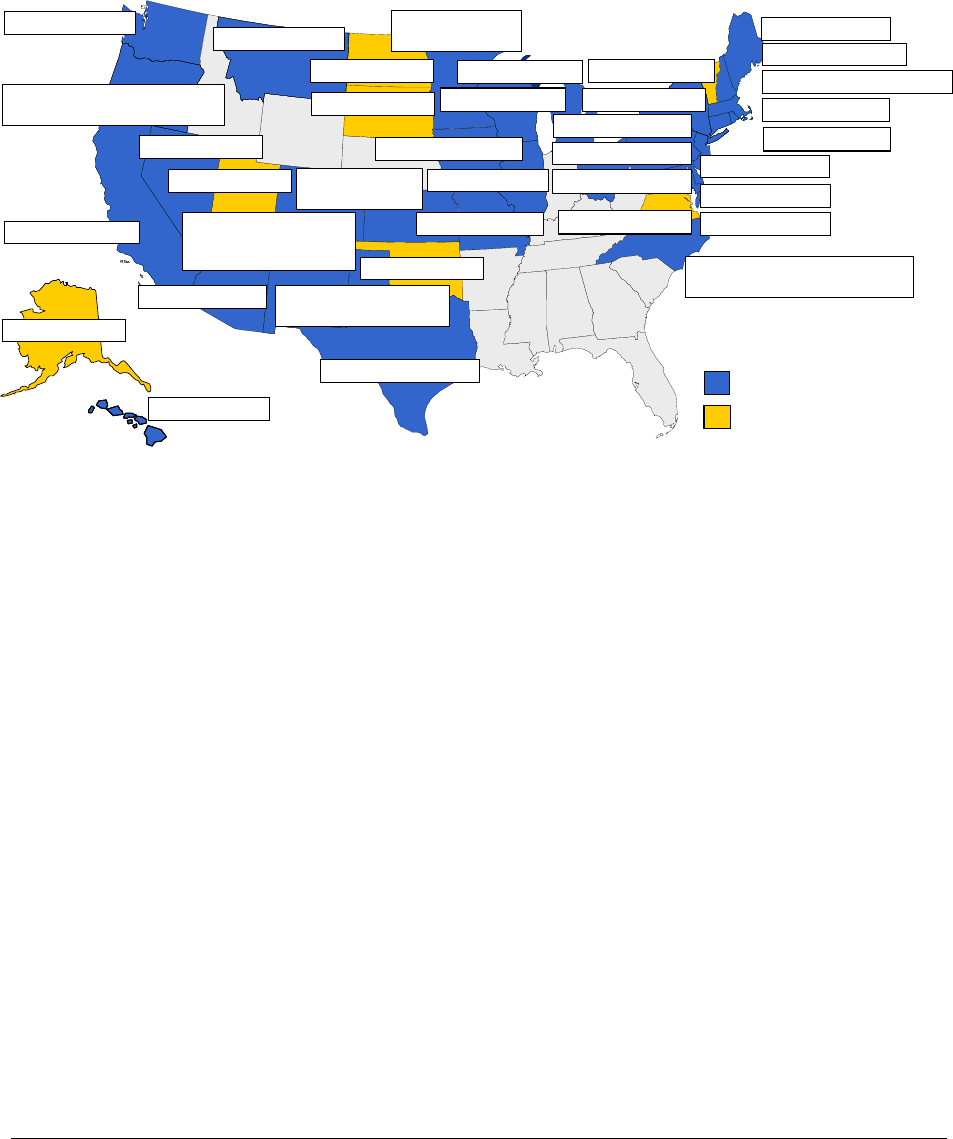
2012 Wind Technologies Market Report
57
power capacity added in 2012 and even further below the roughly 16 GW of total renewable
capacity added in 2012, demonstrating the limitations of relying exclusively on state RPS
programs to drive future wind power development.
Note: The figure does not include West Virginia's mandatory “alternative and renewable energy portfolio standard” or Indiana's
voluntary "clean energy standard." Under these two states' policies, both renewable and non-renewable energy resources may
qualify, but neither state specifies any minimum contribution from renewable energy. Thus, for the purposes of the present report,
these two states are not considered to have enacted mandatory RPS policies or non-binding renewable energy goals. Also not
included in the figure are the mandatory RPS and non-binding renewable energy goals established in U.S. territories.
Figure 36. State RPS Policies and Non-Binding Renewable Energy Goals (as of June
2013)
In addition to state RPS policies, utility resource planning requirements, principally in Western
and Midwestern states, have also helped spur wind power additions in recent years, as has
voluntary customer demand for “green” power. State renewable energy funds provide support for
wind power projects (both financial and technical) in some jurisdictions, as do a variety of state
tax incentives. Finally, concerns about the possible impacts of global climate change continue to
fuel interest in some states and regions to implement and enforce carbon-reduction policies. The
Northeast’s Regional Greenhouse Gas Initiative (RGGI) cap-and-trade policy, for example, has
been operational for several years, and California’s greenhouse gas cap-and-trade program
commenced operation in 2012, although carbon pricing seen to date under RGGI has been too
low to drive significant wind energy growth. At the same time, other states have expressed
growing skepticism about these efforts, and a number of states have withdrawn, or undertaken
steps toward withdrawal, from regional greenhouse gas reduction initiatives, including RGGI
and the Western Climate Initiative.
point of comparison, Bloomberg NEF (2013a) projects annual incremental RPS demand of 3.1 GW/year on average
through 2020, with 2 GW/year of this growth expected to come from wind power.
Non-Binding Goal
Source: Berkeley Lab
WI: 10% by 2015
NV: 25% by 2025
TX: 5,880 MW by 2015
PA: 8.5% by 2020
NJ: 22.5% by 2020
CT: 23% by 2020
MA: 11.1% by 2009 +1%/yr
ME: 40% by 2017
NM: 20% by 2020 (IOUs)
10% by 2020 (co-ops)
CA: 33% by 2020
MN: 25% by 2025
Xcel: 30% by 2020
IA: 105 MW by 1999
MD: 20% by 2022
RI: 16% by 2019
HI: 40% by 2030
AZ: 15% by 2025
NY: 30% by 2015
CO: 30% by 2020 (IOUs)
20% by 2020 (co-ops)
10% by 2020 (munis)
MT: 15% by 2015
DE: 25% by 2025
DC: 20% by 2020
WA: 15% by 2020
NH: 24.8% by 2025
OR: 25% by 2025 (large utilities)
5-10% by 2025 (smaller utilities)
NC: 12.5% by 2021 (IOUs)
10% by 2018 (co-ops and munis)
IL: 25% by 2025
Mandatory RPS
VT: 20% by 2017
ND: 10% by 2015
VA: 15% by 2025
MO: 15% by 2021
OH: 12.5% by 2024
SD: 10% by 2015
UT: 20% by 2025
MI: 10% by 2015
KS: 20% of peak
demand by 2020
OK: 15% by 2015
AK: 50% by 2025

2012 Wind Technologies Market Report
58
Solid Progress on Overcoming Transmission Barriers Continued
Transmission development has gained traction in recent years. The North American Electric
Reliability Corporation (NERC) reported that during the last 5 years, more than 2,300 circuit
miles of new transmission additions were constructed per year, with an additional 18,700 circuit
miles planned over the next 5 years.
70
By comparison, transmission was being constructed at a
rate of about 1,000 circuit miles per year as recently as 5 years ago (NERC 2012). According to
the Edison Electric Institute (EEI), total transmission investment by IOUs reached $11.1 billion
in 2011, and increases are expected to continue into 2013 ($15.1 billion are anticipated). After
2013, EEI forecasts a decrease in transmission investment, primarily attributable to recent
economic conditions and the resulting projected continuance of slow electric demand growth as
well as demand-side management and energy-efficiency measures. Nonetheless, EEI identified
more than 150 transmission projects representing a total of $51.1 billion in investments, about
76% of which would support the integration of renewable energy (EEI 2013). AWEA,
meanwhile, has identified near-term transmission projects that—if all were completed—could
carry almost 70 GW of additional wind power capacity (AWEA 2013a).
Lack of transmission can be a barrier to new wind power development, and insufficient
transmission capacity in areas where wind projects are already built can lead to curtailment, as
illustrated earlier. New transmission is particularly important for wind energy because wind
power projects are constrained to areas with adequate wind speeds, which are often located at a
distance from load centers. There is also a mismatch between the relatively short timeframe often
needed to develop a wind power project compared to the longer timeframe typically required to
build new transmission. Uncertainty over transmission siting and cost allocation, particularly for
multi-state transmission lines, further complicates transmission development.
FERC continued to implement Order 1000 in 2012, which requires public utility transmission
providers to improve intra- and inter-regional transmission planning processes and to determine
cost-allocation methodologies for new transmission facilities. The transmission-planning
requirements established in Order 1000 include the development of regional transmission plans,
mandatory participation in regional transmission planning, consideration of transmission needs
driven by state and federal policy requirements (such as state RPS policies), and transmission
planning coordination between neighboring balancing authorities (FERC 2011). Initial
compliance filings under Order 1000, which describe how FERC-regulated transmission
providers would comply with the regional transmission-planning and regional cost-allocation
requirements, were filed in October 2012.
71
FERC also requires a second set of compliance
70
A circuit mile is the total length in miles of separate circuits, regardless of the number of conductors used per
circuit.
71
In March 2013, FERC conditionally approved the Order 1000 compliance plans of PJM, MISO, and
WestConnect. As one example, among other changes, PJM proposed to allocate 50% of the cost of high-voltage
transmission projects to the beneficiaries (i.e., zones that benefit from the project through decreased load payments),
while assigning the remaining costs to all market participants in the RTO. FERC concluded that PJM and MISO
largely complied with the Order 1000 requirements but directed them to clarify and refine certain aspects of their
proposals. FERC also concluded that the WestConnect transmission planning region partially complied with the
requirements of Order 1000 and offered guidance to public utility transmission providers in the WestConnect region
for further compliance filings.
2012 Wind Technologies Market Report
59
filings, due in July 2013, to describe how transmission providers will comply with the inter-
regional planning coordination and inter-regional cost-allocation requirements.
States, grid operators, utilities, regional organizations, and DOE continue to take proactive steps
to encourage transmission investment and improve access to remote renewable resources. A
non-exhaustive list of some of these initiatives and their developments in 2012 is presented
below:
• Midcontinent Independent System Operator (MISO): In December 2012, MISO
approved its Transmission Expansion Plan 2012 (MTEP12). Together with previously
approved transmission projects, the total number of MISO-approved transmission projects
included in MTEP12 is 598, representing 6,463 circuit miles of new or upgraded
transmission lines and about $10.8 billion in potential transmission investment through 2022.
This includes 17 Multi Value Projects that represent over $5 billion in transmission
investment, which could connect as much as 14,000 MW of wind power capacity (AWEA
2013a). Elsewhere, progress on the $1.9 billion CapX2020 regional transmission project
continued in 2012, with the 230-kV Bemidji-Grand Rapids line energized in September
2012. Meanwhile, construction began on the 240-mile Brookings County-Hampton line in
April 2012, the first segment of which is expected to be completed in 2013, and construction
began on the 125-mile Hampton-Rochester-La Crosse line in 2013. Both 345-kV
transmission line projects have a targeted completion date of 2015.
• Electric Reliability Council of Texas (ERCOT): The Texas Competitive Renewable
Energy Zone (CREZ) program, which includes almost 3,600 circuit miles of new
transmission lines, is still on track to be largely completed by the end of 2013. The CREZ
program is expected to accommodate a total of 18,500 MW of wind power capacity.
Separately, in its 2012 Five-Year Transmission Plan, ERCOT identified $8.9 billion in
transmission improvement projects that it expects transmission providers to complete by the
end of 2017. Of the 66 projects identified in the plan, 63 are needed to maintain reliability,
and three are justified by projected economic benefits.
• New York State: In October 2012, a task force launched by Governor Andrew Cuomo
published the New York State Energy Highway Blueprint, which aims to spur $5.7 billion in
private investment in 3,200 MW of new energy and transmission capacity. This includes
$1 billion for 1,000 MW of new transmission capacity and $1.3 billion for existing
transmission and distribution projects, designed to enhance reliability, improve safety, reduce
cost to customers, and reduce emissions.
• California ISO (CAISO): As in past years, CAISO’s most recent transmission plan, issued
in March 2013, found that no new major transmission upgrades (beyond those already in
development) are necessary to meet California’s 33% RPS, although some smaller
transmission projects are justified. In November 2012, FERC approved a tariff change that
allows economic- or policy-driven transmission projects costing less than $50 million to be
approved without permission from the CAISO Board of Governors.
Several RTOs continue to reform their interconnection queue procedures. In April 2012, FERC
accepted PJM’s petition to modify its Open Access Transmission Tariff. Among PJM’s reforms
are replacing the 3-month queue cycle with a 6-month cycle, allowing a project to decrease in
size during the study process, and establishing an alternate queue for projects smaller than 20

2012 Wind Technologies Market Report
60
MW that connect to distribution facilities and do not cause a need for transmission upgrades. In
June 2012, FERC approved a proposal from MISO that addresses backlogs and late-stage
termination of interconnection agreements. In addition to revised timelines and new study
procedures, MISO requires interconnection customers to put more money at risk earlier in the
process. In July 2012, FERC accepted CAISO’s proposal to integrate its transmission planning and
generator interconnection processes. Rather than having a “generation-leads-transmission” approach,
the new method involves greater up-front coordination between generation and transmission. In
particular, by aligning interconnection procedures and transmission planning, CAISO’s queue is
based on a “first-ready, first-served” approach, instead of “first-come, first-served.” Finally, in
February 2013,
FERC accepted a proposal by NYISO to modify its interconnection queue
process. Among other changes, the reforms modify the procedures for granting extensions of a
project’s projected on-line date, prevent a new study class year from starting until the previous
one is finished being studied, and allow projects to drop out of their study class year.
Progress was also made with the interconnection-wide planning supported by previous grants
from DOE under the Recovery Act. The Eastern Interconnection Planning Collaborative
submitted the final draft of its phase 2 report to DOE in December 2012. Phase 2 focused on
conducting transmission studies based on three scenarios and includes reliability studies as well
as various options for transmission expansion.
72
The Texas Interconnection’s Long-Term Study
Task Force planned to submit its final Long-Term Transmission Analysis report to DOE by mid-
2013. In September 2013, the Western Electricity Coordinating Council is expected to complete
its first Twenty-Year Regional Transmission Plan and to update the initial 10-year plan that was
completed in 2011.
Numerous transmission projects have been planned, in part, to accommodate the growth of wind
energy throughout the country. Examples of some of these projects are described below:
• The 500-kV, 110-mile Sunrise Powerlink transmission line was completed in June 2012. San
Diego Gas & Electric has signed eight PPAs for more than 1,000 MW of wind and solar
power from projects in Imperial County, in part because of the new transmission.
• In late 2012, ITC Great Plains energized the 345-kV, 227-mile Spearville-to-Axtell
transmission line, which runs from southern Kansas to southern Nebraska.
• Construction began on the first segment of the Michigan Thumb Loop Transmission Project
in early 2012. Once fully completed in 2015, the 140-mile transmission project will transport
wind energy to load centers in Michigan.
• Central Maine Power plans to install 5,000 transmission structures by 2015 for its Maine
Power Reliability Program. The project, which commenced in September 2010 and has
already completed 2,000 of the planned 5,000 structures, includes the construction of five
new 345-kV substations and approximately 440 miles of new transmission lines.
• The Tehachapi Transmission Project, which is being developed by Southern California
Edison, is expected to accommodate up to 4,500 MW of new generation, much of it
potentially wind, when completed in 2015. Segments 1, 2, and 3a (out of a total of 11
segments) are already completed.
• The Los Angeles Department of Water and Power’s proposed $416-million Barren Ridge
72
The three scenarios included a nationally implemented federal carbon constraint with increased energy efficiency
and demand response scenario, a regionally implemented national RPS scenario, and a business as usual scenario.
2012 Wind Technologies Market Report
61
Transmission Project is expected to provide 1,100 MW of capacity to transport wind and
solar from the Tehachapi Mountains and Mojave Desert to the San Fernando Valley.
Construction is scheduled to begin in spring 2013, with a target in-service date of 2016.
• Clean Line Energy Partners is proposing to develop four high-voltage, direct-current
transmission lines, each capable of transporting up to 3,500 MW of renewable energy from
renewable-rich regions in the Midwest to load centers in the Eastern and Western United
States. Clean Line also agreed to buy the Power Network New Mexico, a proposed 345-kV
transmission line aimed at transferring 1,500 MW of renewable generation from New
Mexico to other Western states.
Other transmission projects have been delayed, dropped, or scaled back:
• The Potomac-Appalachian Transmission Highline (PATH) and the Mid-Atlantic Power
Pathway (MAPP) lines were removed from PJM’s Regional Transmission Expansion Plan in
2012. PJM approved both PATH and MAPP in 2007; however, PJM’s recent analysis
indicated that there is no longer a need for the projects due to reduced load, recent generation
additions, upgrades to existing lines, and the growth of demand response.
• The Arizona Corporation Commission’s Biennial Transmission Assessment, released in
December 2012, found that, since the last assessment was completed, Arizona utilities have
cancelled six high-voltage transmission projects, and 37 have been delayed by 5 years on
average.
• NV Energy’s One Nevada transmission project was delayed due to windstorms damaging
transmission towers, cost overruns, and accusations of hoarding transmission capacity on the
line. The scheduled completion date was pushed back by 1 year, but the project is expected to
be operational by the end of 2013.
• In June 2013, Portland General Electric (PGE) suspended permitting and development of the
215-mile Cascade Crossing Transmission Project, a project PGE was undertaking jointly
with Bonneville Power Administration (BPA). Instead, PGE and BPA will consider whether
PGE could purchase 1,500 MW of transmission over several years, plus an additional 1,100
MW through transmission upgrades or expansion that are not expected to be needed before
2020.
• BPA announced a delay for a separate transmission project, the 28-mile Big Eddy Knight
project, to winter 2014. BPA also indicated that future Network Open Season initiatives,
whereby potential generation projects could place deposits to indicate interest in planned
transmission projects, will be on hold for a second consecutive year.
System Operators Are Implementing Methods to Accommodate Increased
Penetration of Wind Energy
There has been considerable attention paid to the potential impacts of wind energy on power
systems in recent years. Concerns about, and solutions to, these issues have affected, and
continue to impact, the pace of wind power deployment in the United States. Experience in
operating power systems with wind energy is also increasing worldwide, leading to an emerging
set of best practices (Exeter and GE 2012, WGA 2012). Additionally, system operators are

2012 Wind Technologies Market Report
62
increasingly reviewing past operations and historical data to estimate the actual impacts and
costs associated with wind energy integration (i.e., “backcasting”).
Figure 37 provides a selective listing of estimated wind integration costs,
73
and Figure 38
summarizes the estimated increase in balancing reserves
74
associated with increased wind energy
from integration studies completed from 2003 through 2012 at various levels of wind power
capacity penetration.
75,76
System operators use reserves to balance variability and uncertainty
between scheduling periods, and scheduling periods vary, so Figure 38 separates balancing
reserves by the duration of the scheduling period assumed in the study. Regions with fast energy
markets, for example, might change the schedule of dispatchable generators over 5-minute
periods, while other regions often use hourly schedules.
77
Because methods vary and a consistent set of operational impacts has not been included in each
study, results from the different analyses of integration costs (Figure 37) and balancing reserves
(Figure 38) are not fully comparable. Porter et al. (2013) provide additional details summarizing
many of the studies included here. Note also that the rigor with which the various studies have
been conducted varies, as does the degree of peer review. Finally, there has been some recent
literature questioning the methods used to estimate wind integration costs and the ability to
disentangle those costs explicitly, while also highlighting the fact that other generating options
also impose integration challenges and costs to electricity systems (Milligan et al. 2011).
73
The integration costs considered in these studies typically refer to the costs associated with accommodating the
variability and uncertainty associated with wind energy. Generally, these costs are associated with three different
time frames: regulation—from seconds to a few minutes; load-following—tens of minutes to a few hours; and unit
commitment—out to the next day or two. Studies often, but not always, estimate these costs as the difference in
overall electric system production costs between a scenario that captures the variability and unpredictability of wind
energy and a scenario with an energy-equivalent block of power having no variability or uncertainty.
74
In general, these balancing reserves reflect the resources required to maintain system balance between schedules.
Often, studies have balancing reserve requirements that change depending on the level of wind electricity generation
or the time of day (Ela et al. 2011). The balancing reserves in the figure represent either the average reserves or the
maximum increase in reserves, depending on which statistics are reported by the study authors.
75
Wind power penetration on a capacity basis (defined as nameplate wind power capacity serving a region divided
by that region’s peak electricity demand) was frequently used in earlier integration studies. For a given amount of
wind power capacity, penetration on a capacity basis is typically higher than the comparable wind penetration in
energy terms (because, over the course of a year, wind power projects generally operate at a lower percentage of
their rated capacity, on average, than does aggregate load).
76
Some studies address capacity valuation for resource adequacy purposes; those results are not presented here.
77
Over half the load in the United States is now in regions with 5-minute scheduling: PJM, MISO, ERCOT, NYISO,
ISO-NE, and CAISO.

2012 Wind Technologies Market Report
63
[a] Costs in $/MWh assume 31% capacity factor.
[b] Costs represent 3-year average.
[c]
Highest over 3-year evaluation period.
[d] Higher-cost line adds the coal cycling costs found in Xcel Energy (2011).
Sources: Acker (2007) [APS (2007)]; EnerNex Corp. (2007) [Avista (2007)]; BPA (2009); BPA (2011); Shiu et al. (2006) [CA RPS
(2006)]; Maggio (2012) [ERCOT (2012)]; EnerNex Corp. (2010) [EWITS (2010)]; EnerNex Corp. and Idaho Power Co. (2007) [Idaho
Power (2007)]; Idaho Power (2012); EnerNex Corp. and WindLogics Inc. (2006) [MN-MISO (2006)]; EnerNex Corp. et al. (2010)
[Nebraska (2010)]; NorthWestern Energy (2012); PacifiCorp (2005); PacifiCorp (2007); PacifiCorp (2010); PacifiCorp (2012);
Portland General Electric and EnerNex Corp.(2011) [Portland GE (2011)]; Puget Sound Energy (2007); EPRI (2011) [SPP-SERC
(2011)]; Electrotek Concepts, Inc. (2003) [We Energies (2003)]; EnerNex Corp. and WindLogics Inc. (2004) [Xcel-MNDOC (2004)];
EnerNex Corp. (2006) [Xcel-PSCo (2006)]; EnerNex Corp. (2008) [Xcel-PSCo (2008)]; Xcel Energy and EnerNex Corp. (2011)
[Xcel-PSCo (2011)]; Brooks et al. (2003) [Xcel-UWIG (2003)]
Figure 37. Integration Costs at Various Levels of Wind Power Capacity Penetration

2012 Wind Technologies Market Report
64
[a] Includes some solar energy in addition to wind energy.
[b] 3-year average.
[c] Small, isolated island system.
Sources: See Figure 37; GE Energy (2007) [CA IAP (2007)] ; CAISO (2007); CAISO (2010); GE Energy (2008) [ERCOT (2008)]; GE
Energy (2010a) [ISO-NE (2010)]; GE Energy (2005) [New York (2005)]; NYISO (2010); Shoucri (2011) [Northwestern (2011)]; GE
Energy (2011) [Oahu (2011)]; Charles River Associates (2010) [SPP (2010)]; GE Energy (2010b) [WWSIS (2010)]
Figure 38. Incremental Balancing Reserves at Various Levels of Wind Power Capacity
Penetration
In addition to balancing reserve requirements and wind integration costs, a growing number of
studies have focused on identifying the required changes to existing practices in power system
operations, the role of forecasting, and the capability of supply- and demand-side technologies in
providing the needed flexibility to integrate wind power. A sizable portion of these types of
studies has been conducted by or commissioned by RTOs and ISOs (e.g., CAISO, ERCOT, SPP,
NYISO, and ISO-NE; PJM is currently conducting an integration study that is expected to be
completed in 2013). Key conclusions that continue to emerge from the growing body of
integration literature include the following:
• With one exception,
78
wind integration costs estimated by the studies reviewed are below
$12/MWh—and often below $5/MWh—for wind power capacity penetrations up to and even
exceeding 40% of the peak load of the system in which the wind power is delivered.
79
78
The Idaho Power (2012) study is the exception. Its significantly higher integration costs with high wind power
penetration may be due to the study’s assumptions that balancing reserves must be large enough to accommodate
day-ahead wind forecast errors and that load and wind forecast errors are perfectly correlated. These assumptions
appear to result in significantly greater estimated reserve requirements than previous studies by the same utility and
other nearby utilities.
79
These integration cost estimates compare to levelized wind PPA prices that averaged $40/MWh for contracts
signed in 2011 and 2012 (as shown in Figure 33). The relatively low integration cost estimates in some studies (e.g.,
the 2010 Nebraska study), despite aggressive levels of wind power penetration, are partly a result of relying on the
broader regional electricity market to accommodate certain elements of integrating wind energy into system
operations. Conversely, the higher integration costs sometimes found by Avista, Idaho Power, PacifiCorp, and PGE
are, in part, caused by the relatively smaller markets in which the wind energy is being absorbed and by those
utilities’ operating practices. Specifically, the Northwest currently uses hourly scheduling intervals rather than the

2012 Wind Technologies Market Report
65
Variations in estimated costs across studies are due, in part, to differences in methodologies,
definitions of integration costs, power system and market characteristics, wind energy
penetration levels, fuel price assumptions, and the degree to which thermal power plant
cycling costs are included.
• Larger balancing areas, such as those found in RTOs and ISOs, make it possible to integrate
wind energy more easily and at lower cost than is the case in smaller balancing areas.
Coordination among smaller balancing areas can reduce the cost of wind integration.
• The successful use of wind power forecasts by system operators can significantly reduce
integration challenges and costs.
• Intra-hour transmission scheduling and generator dispatch (e.g., 5-minute scheduling and
dispatch) provides access to flexibility in conventional power plants that, among other
benefits, lowers the costs of integrating wind energy.
• Thermal plant cycling costs are increasingly being highlighted and can contribute to the
challenges of integrating wind. Among other studies of cycling costs, the Western Wind and
Solar Integration Study Phase II and the PJM variable generation integration study, both due
to be completed in 2013, will include an assessment of cycling costs.
• The increase in balancing reserves with increased wind power penetration is projected to be
typically less—and often considerably less—than 15% of the nameplate capacity of wind
power, particularly in studies that assume intra-hour scheduling. The high balancing reserve
finding in the NorthWestern study (Shoucri 2011) is likely driven by the assumed hourly
scheduling interval layered on top of a small balancing area. The high balancing reserve
finding in the Idaho Power (2012) study reflects an assumption that balancing reserves are
required to meet day-ahead forecast errors. A number of studies indicate that the amount of
balancing reserves needed at any particular time changes with different wind and load
conditions. Setting dynamic balancing reserve requirements that respond to these changes in
conditions can lower integration costs.
As utilities and system operators gain experience with integrating increasing amounts of wind on
their systems, it has become possible to use historical data to evaluate actual (as opposed to
estimated) wind balancing reserves and integration costs. PacifiCorp (2012), for example, used
actual wind data from 2007 to 2011 to estimate the increase in balancing reserves reported in
Figure 38. These balancing reserves are notably lower than the estimates of balancing reserves
from earlier PacifCorp studies and are substantially lower than the reserves estimated by studies
from many nearby utilities. Retrospective analysis of actual wind balancing reserves and
integration costs in ERCOT, also shown in Figures 37 and 38, results in wind integration costs
on the order of $1.2/MWh (Maggio 2012), with 16% wind penetration on a capacity basis (8.5%
on an energy basis). ERCOT relies upon a 5-minute market, has a single large balancing area,
and integrates wind forecasts into system operations including a separate wind ramping forecast.
ERCOT’s transition from a zonal market with 15-minute dispatch to a nodal market with 5-
minute dispatch has allowed a decrease in regulation reserve requirements, although non-
spinning reserves have increased to some degree. Furthermore, the 5-minute dispatch in the
nodal market has largely eliminated the out-of-market requests for additional generation
resources between scheduling periods that were more common under the earlier zonal market
sub-hourly markets common in ISOs and RTOs. A sensitivity case in the Avista Utilities study demonstrates that the
use of a 10-minute transaction scheduling interval would decrease the cost of integrating wind energy by 40%–60%.
2012 Wind Technologies Market Report
66
with 15-minute dispatch. These out-of-market requests often occurred during periods with large
changes in wind generation output in the zonal market. Even with the now-greater wind ramping
associated with higher levels of wind power penetration, out-of-market requests for supplemental
energy have not yet occurred under the nodal market (Potomac Economics 2012a).
ISOs and utilities are continuing to take important steps to mitigate the challenges posed by
integrating larger quantities of wind energy:
• Centralized wind energy forecasting systems are currently in place in all ISO/RTO areas, and
a growing number of electric utilities are using centralized wind forecasting in operations
(Exeter and GE 2012).
• MISO implemented Look-Ahead Commitment beginning April 1, 2012. Look-Ahead
Commitment improves the system’s ability to economically commit fast-starting resources
by automatically evaluating the need to commit additional quick-start power plants over the
next few hours. The Look-Ahead Commitment is performed every 15-minutes based on
current conditions and near-term forecasts of load, wind, and scheduled interchanges. Similar
look-ahead commitment tools are used by other ISOs, including CAISO and PJM. MISO is
also currently evaluating Look-Ahead Dispatch, a tool that provides better positioning of
generation resources to meet forecasted variability of net load. Look-Ahead Dispatch may be
more costly to implement than Look-Ahead Commitment, but it is already in place in some
other ISOs (Potomac Economics 2012b).
• CAISO implemented a Flexible Ramp Constraint throughout 2012. With this new constraint,
CAISO commits a certain amount of additional generation capability between 15-minute
real-time pre-dispatch and the 5-minute real-time dispatch to ensure that adequate resources
are available to meet changes in system conditions. The resources used to meet the Flexible
Ramping Constraint can be, and often are, used in the 5-minute real-time dispatch. Analysis
shows that the constraint only had an impact on commitment roughly 12% of the time in
2012; in the other periods sufficient ramping capacity was already available without the
constraint. The total cost of using the Flexible Ramping Constraint was about $20 million in
2012, which is about $15 million less than the cost of spinning reserves over the same period
(CAISO 2013a). CAISO allocates 75% of these costs to load and 25% to supply based on un-
instructed deviations (CAISO 2013b).
• An increasing number of ISOs now include wind in real-time economic dispatch. MISO
introduced the dispatchable intermittent resource type in June 2011. Integration of wind into
dispatch provides timely control of wind resources and has reduced manual wind
curtailments in MISO (Potomac Economics 2012b).
• Large centralized markets have continued broader regional coordination efforts, including
sub-hourly interchange between markets. PJM, for example, has adopted sub-hourly
scheduling at certain locations with MISO and NYISO (Exeter and GE 2012).
• Intra-hour scheduling pilots have transitioned into standard business practices for a number
of balancing authorities in the West, including BPA. Intra-hour scheduling changes
(primarily half-hour changes) are increasingly being used, although practices are not yet fully
standardized among balancing areas. A platform to enable faster bilateral transactions, the
webExchange Intra-hour Transaction Accelerator Platform (I-TAP), was launched in 2011
and now has at least 18 participating utilities. Users can post bids and offers for energy or
capacity over any term, including within-hour transactions.

2012 Wind Technologies Market Report
67
• PacifiCorp and CAISO signed a memorandum of understanding to begin development of an
Energy Imbalance Market that would begin operation by October 2014. This market would
provide a sub-hourly, real-time energy imbalance market providing centralized, automated
dispatch and would be open to other participants in WECC on a voluntary basis. Similar
parallel efforts to develop a West-wide Energy Imbalance Market or regional Energy
Imbalance Markets in the Northwest and Southwest continue to be analyzed by various
regional entities.
• Effective December 1, 2011, ERCOT requires that wind generators with standard generation
interconnection agreements signed after January 1, 2010, provide primary frequency
response (Exeter and GE 2012).
Some utilities continue to charge wind power projects directly for balancing services.
80
BPA’s
wind energy balancing charge is equivalent to about $5.40/MWh unless wind submits schedules
every half-hour rather than every hour, in which case the charge is reduced to about $3.60/MWh.
Iberdrola has previously opted out of paying the BPA wind balancing charge by self-supplying
wind balancing services. In early 2013, FERC granted authority to Iberdrola to provide this wind
balancing service to other wind power projects (FERC 2013). The Westar Energy balancing area
charges a regulation and frequency response services charge to wind energy equivalent to about
$0.7/MWh; this interim tariff will be in place until it is rendered unnecessary through the
anticipated implementation of an ancillary services market and balancing authority area
consolidation in SPP, expected in March 2014. In 2012, FERC approved a similar, although
much higher, Regulation and Frequency Response Service rate for wind energy exported from
the Puget Sound Energy area. The resulting charges would be about $6.85/MWh for hourly
scheduling, $4.80/MWh for 30-minute scheduling, or $3.34/MWh for 15-minute scheduling.
These final rates were a result of a settlement and are therefore not necessarily cost based. The
Nebraska Public Power District charges a wind integration service charge of $3.31/MWh.
Similar charges to recover costs associated with regulation will continue to be evaluated on a
case-by-case basis by FERC according to the decision on integrating variable energy resources in
Order 764 (FERC 2012). The FERC decision provides guiding principles regarding the
calculation and allocation of the costs of regulation reserves. That decision also requires that
scheduling at 15-minute intervals be offered to transmission customers and that variable energy
resources provide data to be used in production forecasting should the transmission provider
implement variable generation forecasting. Public utility transmission providers have until
November 2013 to file their compliance plans at FERC for Order 764.
Aside from these challenges and progress with integrating wind energy into system operations,
the impacts of wind power on wholesale market prices are also increasingly apparent.
Supplementary payments from renewable energy credits and/or the PTC provide an incentive for
wind power projects to make negative price offers into wholesale electricity markets. In
particular, projects that receive separate REC and/or PTC benefits have an incentive to generate
80
In addition, Idaho Power, Avista, and PacifiCorp all discount their published avoided cost payments for qualifying
wind power projects in Idaho by an integration rate that ranges from 7%–9% of the avoided-cost rate, up to
$6.50/MWh (IPUC 2010). In early 2011, however, the Idaho Public Utilities Commission reduced the maximum
size of a qualifying wind power facility from 10 MW to 100 kW. Projects larger than 100 kW will need to negotiate
individual project PPA prices directly rather than obtaining the published avoided-cost rate.

2012 Wind Technologies Market Report
68
energy up to the point that the negative wholesale power price is equivalent to the value of the
supplementary payments (Monitoring Analytics 2013). Negative wholesale prices increase in
frequency during times when the share of load met by wind energy increases (Huntowski et al.
2012). For example, 10% of the hours in 2011 had negative prices in the wind-rich ERCOT West
Zone, while negative prices occurred less than 0.1% of the hours in other parts of ERCOT
(Brown 2012). Wind power plants with negative offers were marginal units 4.7% of the time in
PJM in 2012 (Monitoring Analytics 2013). In some situations, negative prices precede wind
power curtailment (data on curtailment are provided in Chapter 5): when wholesale prices fall
below the value of supplementary payments, it becomes more attractive to curtail wind energy
rather than continuing to generate power. Negative prices and curtailment may become less
frequent with increased transmission capacity and/or as electricity systems become more
flexible.
More broadly, additional wind power generation, along with factors like lower gas prices and
increased production from other low-variable-cost resources, can—at least in the short run—
reduce wholesale power prices and the profit margins earned by other forms of generation in
wholesale power markets. Lower wholesale power prices are beneficial to wholesale and,
perhaps, retail customers, but lower margins in wholesale power markets negatively affect the
attractiveness of building new generation capacity or keeping existing generation capacity
online, both of which are important factors in overall system adequacy and in providing services
such as frequency and system inertia (Newell et al. 2012, Traber and Kemfert 2011). Although it
is unclear to what degree these concerns are temporary versus enduring, system operators are
beginning to explore the issues, including consideration of possible market design changes.

2012 Wind Technologies Market Report
69
8. Future Outlook
The 13,131 MW of wind power capacity additions in 2012 exceeded all forecasts presented in
last year’s edition of the Wind Technologies Market Report. Key factors driving the record
growth included the then-planned expiration of federal tax incentives at the end of 2012,
improvements in the cost and performance of wind power technology, and continued state
policies supporting wind energy.
Although federal tax incentives for wind energy are now available for projects that initiate
construction by the end of 2013, it will take time to recharge the project pipeline. Bloomberg
NEF (2013a) reported in March that 2013 had the smallest pipeline of in-development wind
projects since 2004. As a result, while many projects will certainly aim to meet the “start
construction” deadline by the end of the year, 2013 is expected to be a slow year for new
capacity additions, lowering not only U.S. but global growth forecasts. Among the forecasts for
the domestic market presented in Table 6, anticipated capacity additions range from 2,000 to
5,000 MW. With AWEA (2013b) reporting just 1.6 MW were installed in the first quarter of
2013, and another 537 MW were under construction at the end of the first quarter, the industry
will need to accelerate construction activity to fall within even the low forecasted range of
annual capacity additions in 2013.
The year 2014, on the other hand, is expected to be strong as developers commission projects
that began construction in 2013. A forecasted range of wind power capacity additions of 6,000 to
10,100 MW is shown in Table 6. Still, the upper end of the forecast range does not approach the
record build level achieved in 2012.
Table 6. Forecasts for Annual U.S. Wind Capacity Additions (MW)
Source 2013 2014 2015
Bloomberg NEF (2013a, 2013c)
2,800
8,000
3,200
IHS EER (2013)
2,000
6,000
7,300
Navigant (2013)
5,000
9,000
3,500
MAKE Consulting (2013)
3,500
7,700
4,500
EIA (2013b)
3,600
10,100
N/A
Projections for 2015 and beyond are much less certain. Lack of clarity about the fate of federal
tax incentives for wind energy is a primary source of this uncertainty. Expectations for continued
low natural gas prices, modest electricity demand growth, and limited near-term renewable
energy demand from state RPS policies also put a damper on industry growth expectations, as do
inadequate transmission infrastructure and growing competition from solar energy in certain
regions of the country. Industry hopes for a federal renewable or clean energy standard, or
climate legislation, have also dimmed in the near term. At the same time, recent declines in the
price of wind energy have been substantial, helping to improve the economic position of wind
even in the face of lower natural gas prices and boosting the prospects for future growth even if
state and federal incentives decline. The prospects for fossil plant retirements due to more-
stringent EPA regulations may also create new markets for wind energy. Bloomberg NEF
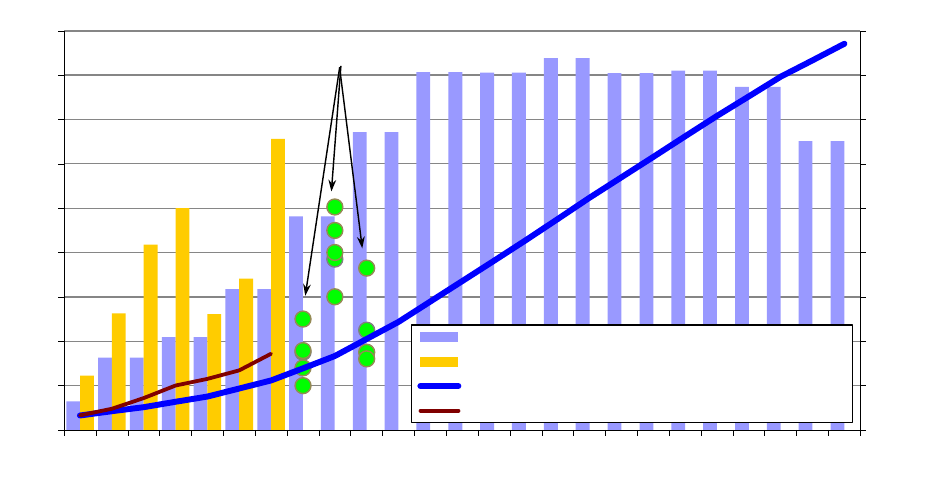
2012 Wind Technologies Market Report
70
(2013a) projects that, even without an extension of the PTC, the U.S. wind market may be able
to support approximately 6.2 GW/year of incremental wind power additions from 2017 through
2030, with the bulk of those additions coming from economic builds (3.5 GW/year) and lower
amounts from state RPS programs (1.4 GW/year) and discretionary builds (1.1 GW/year). IHS
EER (2013), meanwhile, projects roughly 4–5 GW/year of wind additions from 2018 to 2025 in
the absence of the PTC.
Regardless of future uncertainties, wind power capacity additions over the past several years
have put the United States on an early trajectory that may lead to 20% of the nation’s electricity
demand coming from wind energy by 2030 (Figure 39). In May 2008, DOE published a report
that analyzed the technical and economic feasibility of achieving 20% wind energy penetration
by 2030 (DOE 2008). In addition to finding no insurmountable barriers to reaching 20% wind
energy penetration, the report laid out a potential wind power deployment path that started at 3.3
GW/year in 2007, increasing to 4.2 GW/year by 2009, 6.4 GW/year by 2011, 9.6 GW/year by
2013, 13.4 GW/year by 2015, and roughly 16 GW/year by 2017 and thereafter, yielding
cumulative wind power capacity of 305 GW by 2030. Historical growth over the last 7 years puts
the United States on a trajectory exceeding this deployment path. Nonetheless, projections for
annual capacity additions in 2013 through 2015 fall short of the annual growth envisioned in the
20% wind energy report for those years, suggesting that there is a real risk that the market will
not grow rapidly enough to maintain a long-term trajectory consistent with a 20% wind energy
penetration level by 2030.
Source: DOE 2008 (20% wind scenario), AWEA (historical additions), Table 6 (projected additions)
Figure 39. Wind Power Capacity Growth: 20% Wind Report, Actual Installations,
Projected Growth
Achieving the annual installation rate of roughly 16 GW/year needed for wind power to
contribute 20% of the nation’s electricity by 2030, and maintaining that rate for a decade, would
be a challenging task. This rate of deployment has not yet been witnessed in the U.S. market and
is not expected to be approached in the near term. In addition to stable long-term promotional
0
35
70
105
140
175
210
245
280
315
0
2
4
6
8
10
12
14
16
18
2006
2007
2008
2009
2010
2011
2012
2013
2014
2015
2016
2017
2018
2019
2020
2021
2022
2023
2024
2025
2026
2027
2028
2029
2030
Deployment Path in 20% Wind Report (annual)
Actual Wind Installations (annual)
Deployment Path in 20% Wind Report (cumulative)
Actual Wind Installations (cumulative)
Annual Capacity (GW)
range of annual projections
Cumulative Capacity (GW)
2012 Wind Technologies Market Report
71
policies, the DOE (2008) report suggests four other areas where supportive actions may be
needed in order to reach such annual installation rates. First, the nation will need to invest in
significant amounts of new transmission infrastructure designed to access remote wind resources.
Second, to integrate wind power into electricity markets more effectively, larger power control
regions, better wind forecasting, and increased investment in fast-responding generating plants
will be required. Third, siting and permitting procedures will need to be designed to allow wind
power developers to identify appropriate project locations and move from wind resource
prospecting to construction quickly. Finally, enhanced research and development efforts in both
the public and private sectors will be required to lower the cost of offshore wind power and
incrementally improve conventional land-based wind energy technology.
2012 Wind Technologies Market Report
72
Appendix: Sources of Data Presented in this Report
Installation Trends
Data on wind power additions in the United States (as well as certain details on the underlying
wind power projects) come from AWEA, although methodological differences noted throughout
this report result in some discrepancies in the data presented here relative to AWEA (2013a). We
thank AWEA for the use of their comprehensive wind project database. Annual wind power
capital investment estimates derive from multiplying these wind power capacity data by
weighted-average capital cost data, provided elsewhere in the report. Data on non-wind electric
capacity additions come primarily from EIA (for years prior to 2012) and Ventyx’s Velocity
database (for 2012), except that solar data come from the Interstate Renewable Energy Council
and Solar Energy Industries Association/GTM Research. Information on offshore wind power
development activity in the United States was compiled by Navigant.
Global cumulative (and 2012 annual) wind power capacity data come from Navigant (2013) but
are revised to include the U.S. wind power capacity used in the present report. Wind energy as a
percentage of country-specific electricity consumption is based on year-end wind power capacity
data and country-specific assumed capacity factors that come from Navigant (2013), as revised
based on a review of EIA country-specific wind power data. For the United States, the
performance data presented in this report are used to estimate wind energy production. Country-
specific projected wind generation is then divided by country-specific electricity consumption;
the latter is estimated based on actual past consumption as well as forecasts for future
consumption based on recent growth trends (these data come from EIA).
The wind power project installation map was created by NREL, based in part on AWEA’s
database of projects and in part on data from Ventyx’s Velocity database on the location of
individual projects. Estimated wind energy as a percentage contribution to statewide electricity
generation is based on AWEA installed capacity data for the end of 2012 and the underlying
wind power project performance data presented in this report. Where necessary, judgment was
used to estimate state-specific capacity factors. The resulting state wind generation is then
divided by in-state total electricity generation in 2012, based on EIA data. Actual state-level
wind energy penetration figures for 2012 are derived from EIA data.
Data on wind power capacity in various interconnection queues come from a review of publicly
available data provided by each ISO, RTO, or utility. Only projects that were active in the queue
at the end of 2012, but that had not yet been built, are included. Suspended projects are not
included in these listings. Data on projects that are in the nearer-term development pipeline come
from Ventyx (2013) and other sources.
Industry Trends
Turbine manufacturer market share and average turbine size are derived from the AWEA wind
power project database, with some processing by Berkeley Lab. Information on turbine hub
heights and rotor diameters was compiled by Berkeley Lab based on information provided by
AWEA, turbine manufacturers, standard turbine specifications, Federal Aviation Administration
data, web searches, and other sources.

2012 Wind Technologies Market Report
73
Information on wind turbine and component manufacturing comes from NREL, AWEA, and
Berkeley Lab, based on a review of press reports, personal communications, and other sources.
Data on U.S. nacelle assembly capacity come from Bloomberg NEF (2013a). The listings of
manufacturing and supply-chain facilities are not intended to be exhaustive. Data on aggregate
U.S. imports and exports of wind power equipment come primarily from the U.S. International
Trade Commission (USITC) and can be obtained from the USITC’s DataWeb
(http://dataweb.usitc.gov/).
Information on wind power financing trends was compiled by Berkeley Lab. Wind project
ownership and power purchaser trends are based on a Berkeley Lab analysis of the AWEA
project database.
Cost, Performance, and Pricing Trends
Wind turbine transaction prices were compiled by Berkeley Lab. Sources of transaction price
data vary, but most derive from press releases, press reports, and Securities and Exchange
Commission filings. In part because wind turbine transactions vary in the services offered, a
good deal of intra-year variability in the cost data is apparent.
Berkeley Lab used a variety of public and some private sources of data to compile capital cost
data for a large number of U.S. wind power projects. Data sources range from pre-installation
corporate press releases to verified post-construction cost data. Specific sources of data include
EIA Form 412, FERC Form 1, various Securities and Exchange Commission filings, various
filings with state public utilities commissions, Windpower Monthly magazine, AWEA’s Wind
Energy Weekly, the DOE and Electric Power Research Institute Turbine Verification Program,
Project Finance magazine, various analytic case studies, and general web searches for news
stories, presentations, or information from project developers. For 2009–2012 projects, data from
the Section 1603 Treasury Grant program are used extensively. Some data points are suppressed
in the figures to protect data confidentiality. Because the data sources are not equally credible,
little emphasis should be placed on individual project-level data; instead, the trends in those
underlying data offer insight. Only wind power cost data from the contiguous lower-48 states are
included.
Wind project O&M costs come primarily from two sources: EIA Form 412 data from 2001–2003
for private power projects and projects owned by POUs, and FERC Form 1 data for IOU-owned
projects. Some data points are suppressed in the figures to protect data confidentiality.
Wind power project performance data are compiled overwhelmingly from two main sources:
FERC’s Electronic Quarterly Reports and EIA Form 923. Additional data come from FERC
Form 1 filings and, in several instances, other sources. Where discrepancies exist among the data
sources, those discrepancies are handled based on the judgment of Berkeley Lab staff. Data on
curtailment are from ERCOT (for Texas), MISO (for the Midwest), Xcel Energy (for its
Northern States Power Company, Public Service Company of Colorado, and Southwestern
Public Service Company subsidiaries), PJM, and BPA (for the Northwest).
The following procedure was used to estimate the quality of the wind resource in which wind
projects are located. First, the location of individual wind turbines and the year in which those
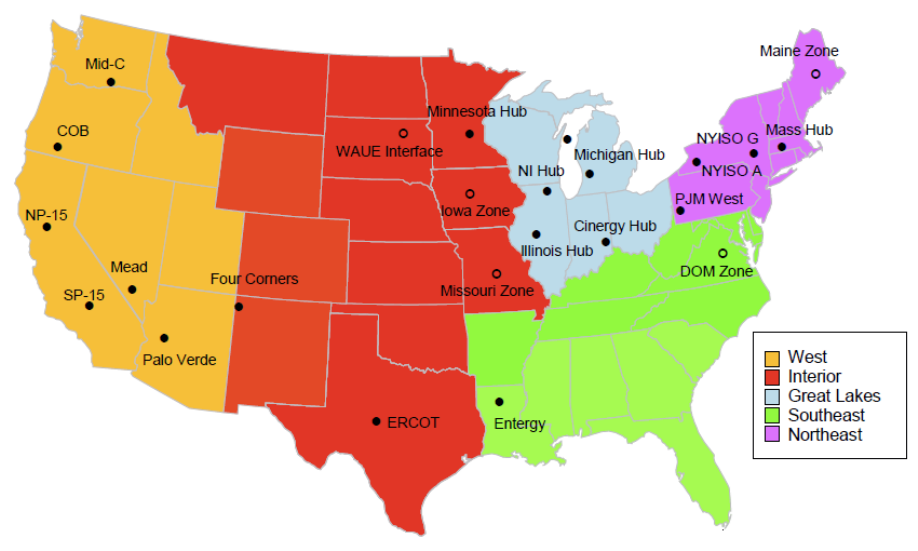
2012 Wind Technologies Market Report
74
turbines were installed were identified using Federal Aviation Administration Digital Obstacle
(i.e., obstruction) files (accessed via Ventyx’ Intelligent Map) and Berkeley Lab data on
individual wind projects. Second, NREL used data from AWS Truepower—specifically, gross
capacity factor estimates with a 200-meter resolution—to estimate the quality of the local wind
resource at an 80-meter hub height for each of those turbines. These gross capacity factors are
derived from average mapped wind speed estimates, wind speed distribution estimates, and site
elevation data, all of which are run through a standard wind turbine power curve (common to all
sites). Third, using the resultant average wind resource quality (i.e., gross capacity factor)
estimate for turbines installed in the 1998–1999 period as the benchmark, and assigning that
period an index value of 100%, comparative percentage changes in average wind resource
quality for turbines installed after 1998–1999 are calculated. Not all turbines could be mapped by
Berkeley Lab for this purpose; the final sample included 30,586 turbines representing 53,009
MW of capacity installed from 1998 through 2012, or 88% of all wind power capacity installed
in the continental United States over that period.
Wind PPA price data are based on multiple sources, including prices reported in FERC’s
Electronic Quarterly Reports, FERC Form 1, avoided-cost data filed by utilities, pre-offering
research conducted by bond rating agencies, and a Berkeley Lab collection of PPAs. Wholesale
electricity price data were compiled by Berkeley Lab from the IntercontinentalExchange (ICE)
as well as Ventyx’s Velocity database (which itself derives wholesale price data from the ICE
and the various ISOs). Earlier years’ wholesale electricity price data come from FERC (2007,
2005). Pricing hubs included in the analysis, and within each region, are identified in the map
below. REC price data were compiled by Berkeley Lab based on information provided by
Evolution Markets and Spectron.
Note: The pricing nodes represented by an open, rather than closed, bullet do not have complete pricing history back through 2003.
Map of Regions and Wholesale Electricity Price Hubs Used in Analysis
2012 Wind Technologies Market Report
75
Policy and Market Drivers
The wind energy integration, transmission, and policy sections were written by staff at Berkeley
Lab and Exeter Associates, based on publicly available information.
Future Outlook
This chapter was written by staff at Berkeley Lab, based largely on publicly available
information.
2012 Wind Technologies Market Report
76
References
Acker, T. 2007. Arizona Public Service Wind Integration Cost Impact Study. Prepared for
Arizona Public Service Company. Flagstaff, Arizona: Northern Arizona University.
American Wind Energy Association (AWEA). 2013a. AWEA U.S. Wind Industry Annual Market
Report: Year Ending 2012. Washington, D.C.: American Wind Energy Association.
American Wind Energy Association (AWEA). 2013b. AWEA U.S. Wind Industry First Quarter
2013 Market Report. Washington, D.C.: American Wind Energy Association.
Bloomberg New Energy Finance (Bloomberg NEF). 2013a. Q1 2013 North America Wind
Market Outlook. March 11, 2013.
Bloomberg New Energy Finance (Bloomberg NEF). 2013b. Wind Turbine Price Index: Issue
VIII. February 11, 2013.
Bloomberg New Energy Finance (Bloomberg NEF). 2013c. Q1 2013 Wind Market Outlook.
February 22, 2013.
Bloomberg New Energy Finance (Bloomberg NEF). 2013d. Operations and Maintenance
(O&M) Price Index, Issue II. April 4, 2013.
Bolinger, M. and R. Wiser. 2011. Understanding Trends in Wind Turbine Prices Over the Past
Decade. LBNL-5119E. Berkeley, California: Lawrence Berkeley National Laboratory.
Bonneville Power Administration (BPA). 2011. 2012 Wholesale Power and Transmission Rate
Adjustment Proceeding: Administrator’s Final Record of Decision. Portland, Oregon:
Bonneville Power Administration.
Bonneville Power Administration (BPA). 2009. 2010 Wholesale Power and Transmission Rate
Adjustment Proceeding (BPA-10) Administrators Final Record of Decision. Portland,
Oregon: Bonneville Power Administration.
Brooks, D., E. Lo, R. Zavadil, S. Santoso, and J. Smith. 2003. Characterizing the Impact of
Significant Wind Generation Facilities on Bulk Power System Operations Planning: Xcel
Energy – North Case Study. Prepared for the Utility Wind Integration Group. Arlington,
Virginia: Electrotek Concepts.
Brown, P. 2012. US Renewable Electricity: How Does Wind Generation Impact Competitive
Power Markets? Washington D.C.: Congressional Research Service (CRS).
California Independent System Operator (CAISO). 2013a. Q4 2012 Report on Market Issues and
Performance. Department of Market Monitoring. Folsom, California: California
Independent System Operator.
California Independent System Operator (CAISO). 2013b. Fifth Replacement FERC Electric
Tariff: Section 11.25 Flexible Ramping Constraint Compensation. Folsom, California:
California Independent System Operator.
California Independent System Operator (CAISO). 2010. Integration of Renewable Resources at
20% RPS. Folsom, California: California Independent System Operator.
California Independent System Operator (CAISO). 2007. Integration of Renewable Resources.
Folsom, California: California Independent System Operator.
2012 Wind Technologies Market Report
77
Chadbourne & Parke. 2013. “Cost of Capital: 2013 Outlook.” Project Finance Newswire.
February 2013. pp. 1-11.
Charles River Associates. 2010. SPP WITF Wind Integration Study. Little Rock, Arkansas:
Southwest Power Pool.
David, A. 2011. U.S. Wind Turbine Trade in a Changing Environment. WINDPOWER 2011.
Poster Presentation. Anaheim, California. May 23–25, 2011.
David, A. 2010. Impact of Wind Energy Installations on Domestic Manufacturing and Trade.
ID-25. Washington, D.C.: U.S. International Trade Commission.
David, A. 2009. Wind Turbines: Industry and Trade Summary. ITX-02. Washington, D.C.: U.S.
International Trade Commission.
Department of Energy (DOE). 2008. 20% Wind Energy by 2030: Increasing Wind Energy’s
Contribution to U.S. Electricity Supply. DOE/GO-102008-2567. Washington, D.C.: U.S.
Department of Energy.
Department of Energy (DOE). 2013. Factsheet: 2012 Distributed Wind Market Report. PNNL-
SA-94583. Washington, D.C.: U.S. Department of Energy.
Edison Electric Institute (EEI). 2013. Transmission Projects: At A Glance. March 2013.
Washington, D.C.: Edison Electric Institute.
EDP Renováveis (EDPR). 2013. EDP Renováveis, 2012 Results. 26 February.
EDP Renováveis (EDPR). 2012. EDP Renováveis, FY2011 Results. 29 February.
Ela, E., M. Milligan, and B. Kirby. 2011. Operating Reserves and Variable Generation.
NREL/TP-5500-51978. Golden, Colorado: National Renewable Energy Laboratory.
Electric Power Research Institute (EPRI). 2011. DOE: Integrating Midwest Wind Energy into
Southeast Electricity Markets. Knoxville, Tennessee: Electric Power Research Institute.
Electrotek Concepts, Inc. 2003. Systems Operations Impacts of Wind Generation Integration
Study. Prepared for We Energies. Knoxville, Tennessee: Electrotek Concepts.
Energy Information Administration (EIA). 2013a. Annual Energy Outlook 2013. DOE/EIA-
0383(2013). Washington D.C.: Energy Information Administration.
Energy Information Administration (EIA). 2013b. Short-Term Energy Outlook. 11 June.
Washington D.C.: Energy Information Administration.
EnerNex Corp. 2010. Eastern Wind Integration and Transmission Study. NREL/SR-550-47078.
Golden, Colorado: National Renewable Energy Laboratory.
EnerNex Corp. 2008. Wind Integration Study for Public Service of Colorado, Addendum,
Detailed Analysis of 20% Wind Penetration. Prepared for Xcel Energy. Denver, Colorado:
Xcel Energy.
EnerNex Corp. 2007. Final Report Avista Corporation Wind Integration Study. Knoxville,
Tennessee: EnerNex Corporation.
EnerNex Corp. 2006. Wind Integration Study for Public Service Company of Colorado. Prepared
for Xcel Energy. Denver, Colorado: Xcel Energy.
EnerNex Corp. and Idaho Power Co. 2007. Operational Impacts of Integrating Wind Generation
into Idaho Power's Existing Resource Portfolio: Report Addendum. Boise, Idaho: Idaho
Power Company.
2012 Wind Technologies Market Report
78
EnerNex Corp., Ventyx, Nebraska Power Association. 2010. Nebraska Statewide Wind
Integration Study. NREL/SR-550-47519. Golden, CO: National Renewable Energy Lab.
EnerNex Corp. and WindLogics Inc. 2006. Final Report – 2006 Minnesota Wind Integration
Study, Volume I. Prepared for the Minnesota Public Utilities Commission. Knoxville,
Tennessee: EnerNex Corporation.
EnerNex Corp. and WindLogics Inc. 2004. Wind Integration Study—Final Report. Prepared for
Xcel Energy and Minnesota Department of Commerce. Knoxville, Tennessee: EnerNex
Corporation.
Exeter Associates, Inc., and GE Energy (Exeter and GE). 2012. Review of Industry Practice and
Experience in the Integration of Wind and Solar Generation. Norristown, Pennsylvania:
PJM Interconnection, LLC.
Federal Energy Regulatory Commission (FERC). 2013. Order Accepting Tariff Re the Iberdrola
Renewables, LLC Under ER13-1058. 142 FERC ¶ 61,243. Docket No. ER13-1058. March
28, 2013.Washington D.C.: Federal Energy Regulatory Commission.
Federal Energy Regulatory Commission (FERC). 2012. Integration of Variable Energy
Resources. 139 FERC ¶ 61,246. Docket No. RM10-11; Order No.764. June 22, 2012.
Washington D.C.: Federal Energy Regulatory Commission.
Federal Energy Regulatory Commission (FERC). 2011. Transmission Planning and Cost
Allocation by Transmission Owning and Operating Public Utilities. 136 FERC ¶ 61,051.
Docket No. RM10-23; Order No.1000. July 21, 2011. Washington D.C.: Federal Energy
Regulatory Commission.
Federal Energy Regulatory Commission (FERC). 2007. 2006 State of the Markets Report.
Washington, D.C.: Federal Energy Regulatory Commission.
Federal Energy Regulatory Commission (FERC). 2005. 2004 State of the Markets Report.
Washington, D.C.: Federal Energy Regulatory Commission.
Fox, K. 2013. Remarks of Kerri Fox (BBVA) during the “Market Landscape for Project
Finance” panel at the WINDPOWER 2013 conference, May 7, 2013.
GE Energy. 2011. Oahu Wind Integration Study Final Report. Honolulu, Hawaii: University of
Hawaii.
GE Energy. 2010a. New England Wind Integration Study. Holyoke, Massachusetts: ISO New
England Inc.
GE Energy. 2010b. Western Wind and Solar Integration Study. NREL/SR-550-47434. Golden,
Colorado: National Renewable Energy Laboratory.
GE Energy. 2008. Analysis of Wind Generation Impact on ERCOT Ancillary Services
Requirements. Prepared for the Electricity Reliability Council of Texas. Schenectady, New
York: GE Energy.
GE Energy. 2007. Intermittency Analysis Project Appendix B: Impact of Intermittent Generation
on Operation of California Power Grid. Sacramento, California: California Energy
Commission, PIER Research Development & Demonstration Program.
GE Energy. 2005. The Effects of Integrating Wind Power on Transmission System Planning,
Reliability, and Operations: Report on Phase 2. Prepared for the New York State Energy
Research & Development Authority. Schenectady, New York: GE Energy.
2012 Wind Technologies Market Report
79
Global Wind Energy Council (GWEC). 2013. Global Wind Report: Annual Market Update
2012. Brussels, Belgium: Global Wind Energy Council.
Huntowski, F., A. Patterson, and M. Schnitzer, 2012. Negative Electricity Prices and the
Production Tax Credit. Concord, Massachusetts: The Northbridge Group, 14 September.
Idaho Power. 2012. Wind Integration Study Report. Boise, ID: Idaho Power.
Idaho Public Utilities Commission (IPUC). 2010. In the Matter of the Petition of Pacificorp dba
Rocky Mountain Power for an Order Revising the Wind Integration Rate for Wind Powered
Small Power Generation Qualifying Facilities. PAC-E-09-07 Order No. 31021. March 12,
2010.
IHS Emerging Energy Research (IHS EER). 2013. The Changing Landscape of US Wind
Opportunities. Presentation to WINDPOWER 2013. 6 May. Chicago, Illinois.
Infigen. 2013. Infigen Energy, Interim Results: 6 months ended 31 December 2012. 21 February.
Infigen. 2012. Infigen Energy, Interim Results: 6 months ended 31 December 2011. 28 February.
Infigen. 2011. Infigen Energy, Full Year Result: 12 months ended 30 June 2011. 30 August.
International Trade Commission (ITC). 2012. Utility Scale Wind Towers from China and
Vietnam. Investigation Nos. 701-TA-486 and 731-TA-1195-1196 (Preliminary).
Publication 4304. Washington, D.C.: U.S. International Trade Commission.
International Trade Commission (ITC). 2013. Utility Scale Wind Towers from China and
Vietnam. Investigation Nos. 701-TA-486 and 731-TA-1195-1196 (Final). Publication 4372.
Washington, D.C.: U.S. International Trade Commission.
Lantz, E. 2013. Operations Expenditures: Historical Trends and Continuing Challenges.
Presentation to WINDPOWER 2013. 7 May. Chicago, Illinois.
Maggio, D.J. 2012. “Impacts of Wind-powered Generation Resource Integration on Prices in the
ERCOT Nodal Market.” Proceedings of 2012 IEEE Power and Energy Society General
Meeting. 22–26 July. San Diego, CA.
MAKE Consulting. 2013. North American Wind Market Review. Presentation to WINDPOWER
2013. 6 May. Chicago, Illinois.
Milligan, M., E. Ela, B.M. Hodge, B. Kirby, D. Lew, C. Clark, J. DeCesaro, and K. Lynn. 2011.
“Integration of Variable Generation, Cost-Causation, and Integration Costs.” The
Electricity Journal 24 (9): 51–63.
Monitoring Analytics. 2013. 2012 State of the Market Report for PJM. Norristown,
Pennsylvania: PJM Interconnection.
Navigant. 2013. World Market Update 2012: International Wind Energy Development, Forecast
2013-2017. ISBN: 978-87-994438-4-0. A BTM Wind Report.
New York Independent System Operator (NYISO). 2010. Growing Wind: Final Report of the
NYISO 2010 Wind Generation Study. Rensselaer, New York: New York Independent
System Operator.
Newell, S., K. Spees, J. Pfeifenberger, R. Mudge, M. DeLucia, and R. Carlton. 2012. ERCOT
Investment Incentives and Resource Adequacy. Cambridge, Massachusetts: The Brattle
Group, Prepared for the Electric Reliability Council of Texas.
2012 Wind Technologies Market Report
80
North American Electric Reliability Corporation (NERC). 2012. 2012 Long-Term Reliability
Assessment. November 2012.
NorthWestern Energy. 2012. Electric Supply Resource Planning and Procurement Plan: Volume
2 Description of Resources. Butte, Montana: NorthWestern Energy.
PacifiCorp. 2012. 2012 Wind Integration Resource Study – DRAFT. Portland, Oregon:
PacifiCorp.
PacifiCorp. 2010. 2010 Wind Integration Study. Portland, Oregon: PacifiCorp.
PacifiCorp. 2007. Technical Appendix for the 2007 Integrated Resource Plan. Portland, Oregon:
PacifiCorp.
PacifiCorp. 2005. Technical Appendix for the 2004 Integrated Resource Plan. Portland, Oregon:
PacifiCorp.
Porter, K., S. Fink, M. Buckley, J. Rogers, and B.M. Hodge. 2013. A Review of Variable
Generation Integration Charges. NREL/TP-5500-57583. Golden, Colorado: National
Renewable Energy Laboratory.
Portland General Electric and EnerNex Corp. 2011. PGE Wind Integration Study Phase II.
Portland, Oregon: Portland General Electric.
Potomac Economics, Ltd. 2012a. 2011 State of the Market Report for the ERCOT Wholesale
Electricity Markets. Fairfax, Virginia: Potomac Economics, Ltd.
Potomac Economics, Ltd. 2012b. 2011 State of the Market Report for the MISO Electricity
Markets. Fairfax, Virginia: Potomac Economics, Ltd.
Puget Sound Energy. 2007. 2007 Integrated Resource Plan, Appendix G-Wind Integration
Studies. Bellevue, Washington: Puget Sound Energy.
Shiu, H., M. Milligan, B. Kirby, and K. Jackson. 2006. California Renewables Portfolio
Standard Renewable Generation Cost Analysis: Multi-Year Analysis Results and
Recommendations. Consultant report prepared by the California Wind Energy
Collaborative. Sacramento, California: California Energy Commission.
Shoucri, A. 2011. NorthWestern Energy Montana Wind Integration Study. Calgary, Alberta:
GENIVAR.
Traber, T. and C. Kemfert. 2011. “Gone with the Wind? Electricity Market Prices and Incentives
to Invest in Thermal Power Plants Under Increasing Wind Energy Supply.” Energy
Economics 33 (2) (March): 249–256.
Ventyx. 2013. Velocity Suite Data Product. Accessed June 2013.
Western Governors’ Association (WGA). 2012. Meeting Renewable Energy Targets in the West
at Least Cost: The Integration Challenge. Denver, Colorado: Western Governors’
Association.
Xcel Energy. 2011. Wind Induced Coal Plant Cycling Costs and the Implications of Wind
Curtailment for Public Service of Colorado. Denver, Colorado: Xcel Energy.
Xcel Energy and EnerNex Corp. 2011. Public Service Company of Colorado 2 GW and 3 GW
Wind Integration Cost Study. Denver, Colorado: Xcel Energy.

Printed with a renewable-source ink on paper containing at
least 50% wastepaper, including 10% post consumer waste.
Wind Energy Web Sites
U.S. Department of Energy Wind Program
wind.energy.gov
Lawrence Berkeley National Laboratory
emp.lbl.gov/research-areas/renewable-energy
National Renewable Energy Laboratory
nrel.gov/wind
Sandia National Laboratories
sandia.gov/wind
Pacific Northwest National Laboratory
energyenvironment.pnnl.gov/eere/
Lawrence Livermore National Laboratory
missions.llnl.gov/energy/technologies/
wind-forecasting
Oak Ridge National Laboratory
ornl.gov/sci/eere/sustainable_electricity.shtml
Argonne National Laboratory
web.anl.gov/renewables/
For more information on
this report, contact:
Ryan Wiser, Lawrence Berkeley National Laboratory
510-486-5474; [email protected]v
Mark Bolinger, Lawrence Berkeley National Laboratory
603-795-4937; MABolinger@lbl.gov
On the Cover
The Campo Band of Mission Indians of the Kumeyaay Nation
Wind Farm in Campo, California, produces enough electricity to
power about 30,000 homes and helps San Diego Gas & Electric
meet its target of supplying at least 20% of its customer’s
electricity from renewable sources.
Photo from Campo Band, NREL 16550
Idaho National Laboratory
https://inlportal.inl.gov/portal/server.pt?open=512&objID=
424&parentname=CommunityPage&parentid=5&mode=2&
in_hi_userid=200&cached=true
Savannah River National Laboratory
srnl.doe.gov/energy-secure.htm
American Wind Energy Association
awea.org
Database of State Incentives for
Renewables & Eciency
dsireusa.org
International Energy Agency – Wind Agreement
ieawind.org
National Wind Coordinating Collaborative
nationalwind.org
Utility Variable-Generation Integration Group
variablegen.org/newsroom/
For more information, visit:
eere.energy.gov |
wind.energy.gov
DOE/GO-102013-3948 • August 2013
