
Solar Energy Technologies Office
Multi-Year Program Plan
May 2021

SETO Multi-Year Program Plan
ii
Disclaimer
This work was prepared as an account of work sponsored by an agency of the United States
Government. Neither the United States Government nor any agency thereof, nor any of their employees,
nor any of their contractors, subcontractors or their employees, makes any warranty, express or implied,
or assumes any legal liability or responsibility for the accuracy, completeness, or any third party’s use or
the results of such use of any information, apparatus, product, or process disclosed, or represents that its
use would not infringe privately owned rights. Reference herein to any specific commercial product,
process, or service by trade name, trademark, manufacturer, or otherwise, does not necessarily constitute
or imply its endorsement, recommendation, or favoring by the United States Government or any agency
thereof or its contractors or subcontractors. The views and opinions of authors expressed herein do not
necessarily state or reflect those of the United States Government or any agency thereof, its contractors
or subcontractors.

SETO Multi-Year Program Plan
iii
Authors
Main author:
Timothy J Silverman*, National Renewable Energy Laboratory (NREL)
Contributing author for Systems Integration:
Henry Huang, Pacific Northwest National Laboratory (PNNL)
Acknowledgments
The authors gratefully acknowledge major contributions from:
Robert Margolis, NREL
Becca Jones-Albertus, Solar Energy Technologies Office (SETO)
Contributions from these NREL staff:
Paul Denholm, David Feldman, Brittany Smith
Additional contributions from these current and former SETO staff:
Ketan Ahuja, Paul Basore, Matt Bauer, Brion Bob, Michelle Boyd, Shamara Collins, Andrew
Dawson, Megan Decesar, Zachary Eldredge, Kyle Fricker, Tassos Golnas, Susan Huang, Victor
Kane, Inna Kozinsky, Hariharan Krishnaswami, Susanna Murley, Garrett Nilsen, Emanuele
Pecora, Ammar Qusaibaty, Avi Shultz, Nicole Steele, Lenny Tinker, Elaine Ulrich, Chani Vines,
Allan Ward, Dawn Washelesky, Guohui Yuan, Leah Zibulsky
And support from everyone on the SETO team. Thank you.
* Timothy J Silverman was on assignment to SETO in 2020, when much of this document was written.
This work was authored in part by the National Renewable Energy Laboratory, operated by Alliance for
Sustainable Energy, LLC, for the U.S. Department of Energy (DOE) under Contract No. DE-AC36-
08GO28308. Funding provided by U.S. Department of Energy Office of Energy Efficiency and
Renewable Energy Solar Energy Technologies Office.

SETO Multi-Year Program Plan
iv
Letter from the Director
The past decade has been one of tremendous change and innovation in the solar
industry and, indeed, the whole electricity sector. The share of electricity produced
by renewables and natural gas has almost doubled, with solar’s share increasing
more than 30-fold to reach 3% today. Yet an even greater rate of change and
innovation is needed to reach President Biden’s ambitious goal to decarbonize our
electricity grid by 2035. For solar technology, this likely means providing 30%–
50% of electricity, with as much as a terawatt of solar capacity by 2035.
Solar technology has advanced rapidly over the past decade — for example, solar panel efficiencies increased by
30%, trackers became cost-effective, and solar power electronics developed capabilities to provide a broad array
of grid services — and the costs of solar electricity have fallen by roughly 80%. These advances provide
confidence in our ability to rapidly innovate to meet the Nation’s climate goals. At the same time, it is critical that
we bring increased focus to reducing soft costs and ensuring equitable access to the environmental, economic, and
societal benefits of increased solar deployment.
The U.S. Department of Energy Solar Energy Technologies Office (SETO) plays an important role in setting the
agenda for solar energy research, development, demonstration, and deployment, from advancing next-generation
technology to tackling sticky market barriers. This Multi-Year Program Plan describes our strategy for the next
five years to accelerate the advancement and equitable deployment of solar energy technologies in the United
States. This plan lays out goals for 2025 that will support low-cost, reliable solar electricity, rapid solar
deployment, and enable solar technology to meet energy needs beyond electricity.
I would like to thank the lead author of this plan, Tim Silverman, who worked with SETO’s staff to collect input
and draft these goals. This plan reflects the collective expertise of SETO’s talented teams, representing countless
hours of conversations and analysis. Most of the goals in this plan were presented at the 2020 SETO Peer Review,
where we received feedback from solar industry experts, business leaders, researchers, and other stakeholders
who will be instrumental in achieving these goals.
Just as the solar industry met and exceeded ambitious targets we set in the past, we know that the creativity and
ingenuity of the solar community will enable us to meet these goals and inspire us to be even more ambitious in
the years to come.
Thank you for taking the time to read our multi-year plan.
Becca Jones-Albertus
Director, U.S. Department of Energy Solar Energy Technologies Office

SETO Multi-Year Program Plan
v
Table of Contents
Executive Summary.................................................................................................................................................... 1
Office Overview ......................................................................................................................................................... 3
Vision and Mission ................................................................................................................................................3
Vision .................................................................................................................................................................3
Shared Challenges .............................................................................................................................................3
Mission ..............................................................................................................................................................4
Federal Role of the Office ......................................................................................................................................4
Scope..................................................................................................................................................................4
Types of Projects ...............................................................................................................................................5
Maturity Level ...................................................................................................................................................5
Energy Justice and Equity..................................................................................................................................5
Technology and Market Overview .........................................................................................................................5
Office Structure ......................................................................................................................................................7
Priorities and Strategic Goals .................................................................................................................................8
Low-cost Electricity ...........................................................................................................................................8
Reliable Electricity ............................................................................................................................................9
Rapid Deployment ...........................................................................................................................................10
Energy Beyond Electricity ...............................................................................................................................10
Plan ........................................................................................................................................................................... 11
Photovoltaics ........................................................................................................................................................11
Background ......................................................................................................................................................11
Goals ................................................................................................................................................................12
Approach ..........................................................................................................................................................12
Concentrating Solar-Thermal Power ....................................................................................................................16
Background ......................................................................................................................................................16
Goals ................................................................................................................................................................17
Approach ..........................................................................................................................................................17
Systems Integration ..............................................................................................................................................22
Background ......................................................................................................................................................22
Goals ................................................................................................................................................................24
Approach ..........................................................................................................................................................24
Soft Cost Reduction .............................................................................................................................................28

SETO Multi-Year Program Plan
vi
Background ......................................................................................................................................................28
Goals ................................................................................................................................................................29
Approach ..........................................................................................................................................................29
Manufacturing and Competitiveness ....................................................................................................................33
Background ......................................................................................................................................................33
Goals ................................................................................................................................................................34
Approach ..........................................................................................................................................................34
Analysis .................................................................................................................................................................... 35
Program Evaluation .................................................................................................................................................. 36
Statutory Authority ................................................................................................................................................... 37
References ................................................................................................................................................................ 39

SETO Multi-Year Program Plan
1
Executive Summary
The U.S. Department of Energy (DOE) Solar Energy Technologies Office (SETO) does research, development,
demonstration, and deployment assistance for solar energy. We advance national progress on climate action, clean
energy job creation, and energy justice.
Our vision is for solar energy to play a fundamental role in reaching the Nation’s clean energy goals and resolving
the climate crisis. Our mission is to accelerate the advancement and deployment of solar technology. Everything
we do advances solar technology’s ability to provide low-cost and reliable electricity, rapid deployment, and
energy beyond electricity.
Our program of research, development, demonstration, and deployment assistance is organized into five budget
areas: photovoltaics (PV), concentrating solar-thermal power (CSP), systems integration (SI), soft cost reduction
(SC), and manufacturing and competitiveness (MC).
The program’s activities and specific goals for 2025, and relevant budget areas, are summarized in the tables that
follow.
Low-cost electricity
Lowering the cost of electricity from PV
Goal · Levelized cost of energy (LCOE) is less than $0.03/kWh in utility-scale PV systems (PV, SC, MC)
Goal · LCOE is less than $0.08/kWh for commercial PV systems and $0.10/kWh for residential PV
systems (SC)
Increasing flexibility to reduce grid integration costs
Goal · Utility-scale PV plus energy storage systems cost less than $1.36/W
DC
(SI)
Lowering the cost of electricity from CSP
Goal · Solar-thermal electricity with a ≥50% efficiency power cycle is demonstrated (CSP)
Reliable electricity
Supporting the reliability of the power system
Goal · Reliable operation is demonstrated at scale in a power system with 75% power contribution from
inverter-based sources (solar, wind, and battery storage) (SI)
Goal · Specific long duration thermal energy storage (TES) system configurations with positive NPV are
identified (CSP)
Goal · A pumped TES system has a round-trip efficiency of >50% (CSP)
Enhancing the resilience and security of the grid
Goal · A power system uses PV and storage to demonstrate rapid recovery of critical electricity services
after a cyberattack or physical event (SI)
SETO Multi-Year Program Plan
2
Rapid deployment
Growing the U.S. solar industry
Goal · A well-supported and diverse solar workforce meets the needs of the industry and of
disadvantaged communities and grows to employ at least 300,000 workers (SC)
Goal · 1 GW/year of new U.S. PV manufacturing capacity is based on technology that was not yet
commercialized in 2020 (MC)
Goal · The solar hardware installed in the United States has at least 40% domestic value (MC)
Reducing the life cycle impacts of solar energy
Goal · New materials, designs, and practices are demonstrated for reducing the environmental impact of
PV technology, prioritized based on a life cycle impacts benchmark (PV, SC)
Opening new markets
Goal · 1 GW
AC
of PV installed in 2025 is combined with another use, such as agriculture or building
surfaces (SC, MC)
Ensuring that solar energy benefits all
Goal · 100% of U.S. energy consumers can choose residential solar or community solar that does not
increase their electricity cost (SC)
Energy beyond electricity
Reducing industrial emissions using solar thermal technology
Goal · System concepts are defined and key components are validated for solar process heat in carbon-
emissions-intensive, high-heat-demand industries (CSP)
Finding the best ways to make solar fuels
Goal · System concepts are defined and key components are validated for producing fuels from
concentrated solar energy (CSP)
SETO Multi-Year Program Plan
3
Office Overview
The U.S. Department of Energy (DOE) Solar Energy
Technologies Office (SETO) is part of the Office of
Energy Efficiency and Renewable Energy (EERE).
We advance national progress on climate action,
clean energy job creation, and energy justice.
This is SETO’s Multi-Year Program Plan for fiscal
years 2021 through 2025. The Multi-Year Program
Plan explains the purpose and the priorities of the
office and sets goals for solar energy for 2025. This
plan explains how we will accelerate progress
toward these goals.
Vision and Mission
Vision
Resolving the climate crisis requires reducing
climate pollution in every sector of the economy.
Most of the Nation’s greenhouse gas emissions
come from burning fossil fuels [EPA 2020]. Solar
energy is an inexhaustible and climate pollution-free
alternative to fossil fuel combustion. Our office
advances the technology to use sunlight as a source
of clean energy.
The Biden administration is working to put the
United States on an irreversible path to a 100%
clean-energy economy, reaching net-zero emissions
no later than 2050. A first step toward this goal is
decarbonizing the electricity sector by 2035. Solar
energy will play a fundamental role in reaching these
national goals.
Solar electricity is often already cost competitive
with conventional power plants. And solar
technology is predicted to frequently be the lowest-
cost zero-emissions generation option for decades to
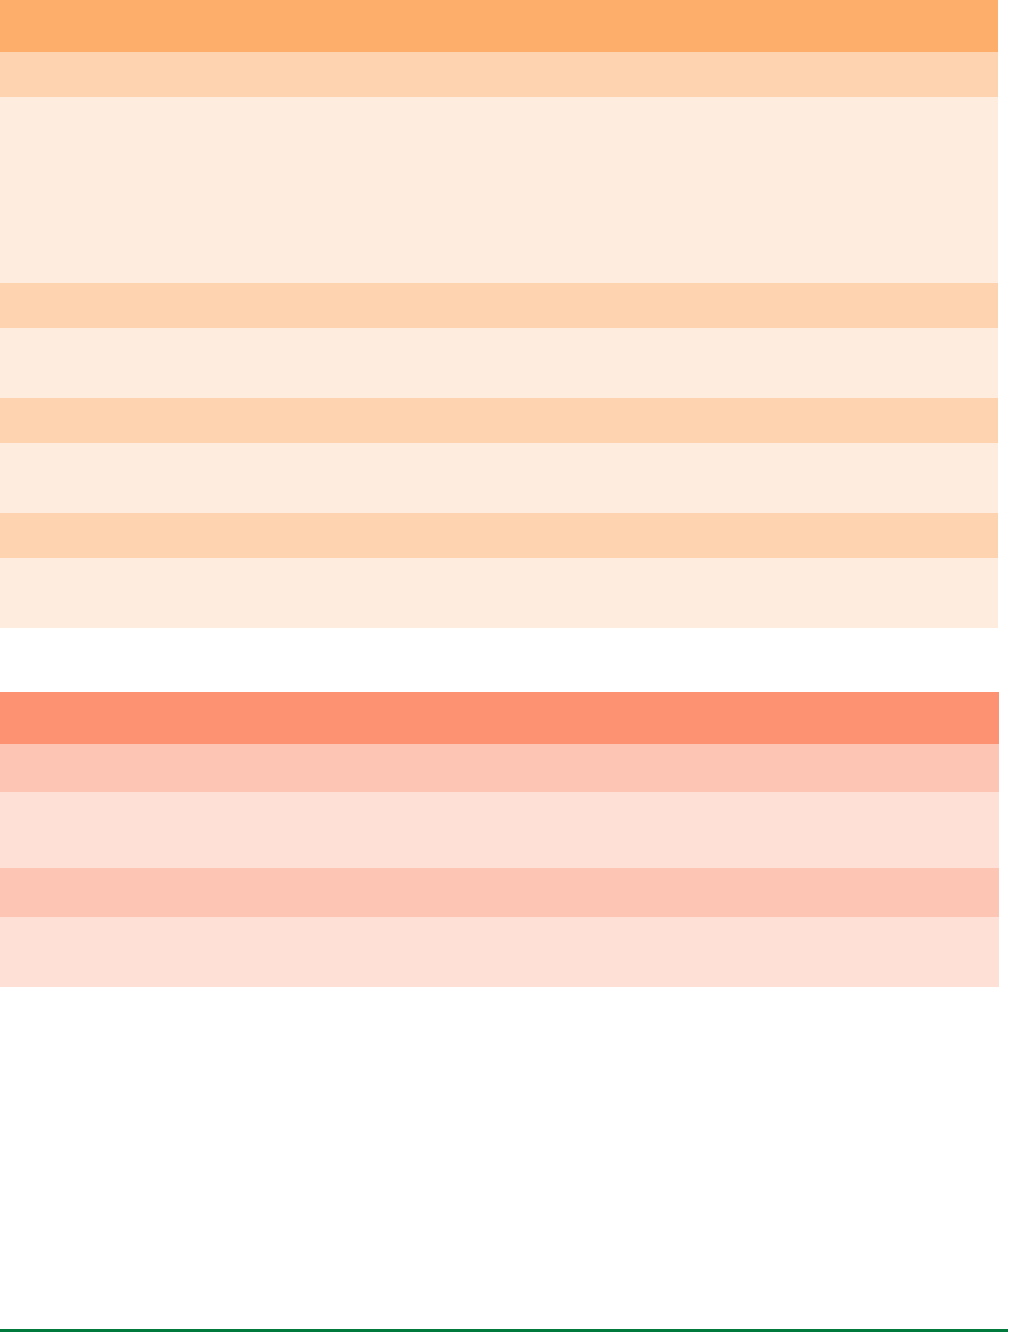
come. Analysts project that decarbonizing the grid
will probably lead to a U.S. electricity generation
mix that is 30% to 50% solar [SFS 2021,
Phadke 2020, Larson 2020]. An example scenario is
shown in Figure 1. Producing this much clean
electricity will require us to deploy as much as
1 TW
AC
, a trillion watts, of alternating-current solar
capacity. While about 15 GW
AC
were installed in
2020 alone, annual deployment must increase by a
factor of 2–5 to reach 1 TW
AC
in 2035
[EIA EPM 2021, SFS 2021].
Figure 1. Projections for the electricity generation mix
from the U.S. Energy Information Administration (EIA)
2021 Annual Energy Outlook (AEO) and the National
Renewable Energy Laboratory (NREL) Solar Futures
Study (SFS) show that solar energy will make a major
contribution in 2050 [EIA AEO 2021, SFS 2021]. The
reference case from the EIA AEO and the
decarbonization and electrification SFS scenario are
shown. This SFS scenario is 95% decarbonized in
2035 and 100% decarbonized in 2050. A petawatt-
hour (PWh) is a trillion kilowatt-hours (kWh).
Shared Challenges
Realizing our vision in a responsible and equitable
way means confronting shared national challenges.
We must reduce climate pollution in every sector of
the economy; increase resilience to the impacts of
climate change; protect public health; conserve our
lands, waters, and biodiversity; deliver
environmental justice; and spur well-paying union
jobs and economic growth. We are committed to
tackling these challenges.
Solar energy reduces climate pollution and protects
public health by replacing fossil fuel combustion
with an emissions-free energy source. Reducing
natural resource extraction for fuel helps conserve
our lands, waters, and biodiversity. Solar power
plants can have environmental impacts and we work
to understand and minimize these impacts. We are
committed to resolving the disproportionate
environmental burden that the energy system has
placed on communities of color and low-income

SETO Multi-Year Program Plan
4
communities. The U.S. solar industry already
employs hundreds of thousands of Americans.
Substantial growth in solar jobs is expected as the
Nation accelerates solar energy deployment to meet
climate targets. We work to make the benefits of
these jobs available to disadvantaged communities.
Mission
Our mission is to accelerate the advancement and
deployment of solar technology.
We execute our mission by:
• Funding projects,
• Supporting facilities, primarily at the
National Laboratories,
• Sponsoring prize competitions,
• Convening experts, and
• Providing relevant and high-quality
information to decision-makers and
interested parties.
We provide funds through a variety of mechanisms,
including:
• Competitive financial assistance, typically
cooperative agreements,
• Prize challenges,
• National Laboratory funding calls, and
• Other funding programs.
Our work is a collaboration with:
• National Laboratories,
• Universities,
• The energy industry and adjacent industries,
• Entrepreneurs,
• Investors,
• Nonprofit organizations,
• Federal agencies, and
• State, local, and tribal governments.
Each of these groups has unique capabilities and
needs, so specific funding opportunities may target
different groups. For example, funding to develop
unique facilities for testing and measurement or
strategic analysis is focused at national laboratories.
Funding aimed at developing leading-edge, high-risk
technologies is often focused at universities.
Funding opportunities advancing emerging solar
technologies are typically open to all stakeholder
groups and coordinated through project partnerships
to enable a transition to the private sector.
Whenever possible, we make our results available to
the public. We encourage awardees to make
software tools and data freely available online when
this does not compete with the private sector. Our
awardees also commit to disseminating their
findings, including results and recommendations, to
the appropriate audience.
Our mission drives us toward our vision. We are
taking the first step toward our vision for 2050
through a set of specific goals for 2025. These goals,
and the priorities they embody, are described in
detail below.
Federal Role of the Office
Scope
SETO funds projects that advance and deploy
technology for converting sunlight into electricity or
industrial process heat.
Advancing solar technology means improving cost,
performance, and fundamental understanding. It
includes:
• Developing new materials, components,
devices, processes, and systems,
• Improving existing materials, components,
devices, processes, and systems,
• Validating technology improvements,
• Building tools to improve understanding of
new and existing technology,
• Analyzing and improving solar energy’s
contribution to the grid, and
• Studying ways for solar technology to
complement other technology.

SETO Multi-Year Program Plan
5
Deploying solar technology means supporting solar
technology’s practical use in the Nation’s energy
system. It includes:
• Supporting domestic economic activity and
employment,
• Improving the non-hardware “soft costs” of
solar energy,
• Expanding access to the benefits of solar
energy, and
• Increasing solar technology adoption in
support of climate action.
Our work on the electricity grid includes only topics
where solar energy integration has a major effect and
is carried out in coordination with the DOE Office of
Electricity, and other offices across DOE through the
Grid Modernization Initiative.
Types of Projects
SETO funds projects that do technology research,
development, and demonstration and projects that
provide analysis and technical assistance. These
project types include different contributions in
different parts of the program. For example,
demonstration projects are especially important in
CSP and systems integration, two technology areas
that rely on full-scale validation for advancement.
Analysis and technical assistance projects are
important for soft costs reduction and for advancing
domestic manufacturing.
Our projects last one to five years, and each year of
funding may focus on a slightly different set of
priorities.
Maturity Level
The earliest-stage work we fund is applied research
that solves practical problems. While funding
decisions are technology-agnostic, we prioritize
projects that can improve solar technology’s delivery
of our priorities in time to help resolve the climate
crisis.
We choose projects at a stage or with a scope that
the private sector cannot support fast enough on its
own. Our portfolio covers a range, from risky with
revolutionary potential to lower-risk with
evolutionary potential. Some projects cover all or
part of this range. We fund demonstration projects
and provide commercialization and deployment
assistance.
Energy Justice and Equity
Communities of color and low-income communities
have incurred disproportionate environmental and
health impacts due to pollution from our Nation’s
energy system. These communities also have
disproportionately high energy burdens and face
barriers to accessing the benefits of solar electricity.
Solar technology produces energy without fuel cost
or emissions and is a key component of delivering
energy justice. We work to make the benefits of
solar energy available to all. We support efforts to
deliver 40% of federal climate investment benefits to
disadvantaged communities.
Our office operations prioritize improvements to
diversity, equity, and inclusion (DEI). For example,
we publicize new employment and funding
opportunities in cooperation with minority-serving
groups. Our staff cultivate an inclusive atmosphere,
with formal training and recognition for DEI work.
We promote DEI in our external interactions. For
example, SETO events seek to include diverse and
equitable representation of speakers and participants.
Our funding opportunities encourage leadership and
participation from underrepresented groups.
We include an emphasis on equity in all our funding
announcements. We also provide funding for
workforce development projects to promote a more
equitable solar industry. We sponsor workforce
training efforts and fellowships that specifically
target underserved groups.
Technology and Market Overview
SETO focuses on solar energy technology that uses
sunlight to directly produce electricity using
photovoltaics (PV) or to produce heat that drives a

SETO Multi-Year Program Plan
6
thermal power plant or an industrial process using
concentrating solar-thermal power (CSP).
The amount of U.S. electricity that is generated by
solar technology is increasing. In 2010, less than
0.1% of U.S. electricity generation came from solar
energy. Figure 2 shows that in 2020 this fraction
was more than 3%. There is considerable variation
in solar energy contribution across states. In
California, the state with the most solar capacity,
solar technology produced roughly 20% of all
electricity generated in the state in 2019. During
certain times of the year in California, solar
contribution has been even higher, meeting 30% of
daily demand a few times per year and 40% of
hourly demand more than 5% of the time [CAISO
2020].
Figure 2. The fraction of annual U.S. electricity
generation from solar generation has increased rapidly
[EIA EPM 2021].
The cost of solar electricity is decreasing, driven by
global economies of scale, technology innovation,
and greater confidence in PV technology. Figure 3
illustrates that levelized cost of energy (LCOE)
benchmarks and actual power purchase agreement
(PPA) prices for utility-scale PV (UPV) systems
have decreased more than 80% since 2010. We
produce annual PV cost benchmarks for different
1
The ITC provided a 30% tax credit for PV systems from
2006 through 2019, stepping down to 26% in 2020 and
22% in 2023. In 2024, the credit is 10% for commercial-
and utility-scale systems and is eliminated for residential
systems.
locations, both with and without incentives. Our cost
targets refer to the benchmark for systems built
without incentives in Kansas City, Missouri, a
location with average sunlight for the U.S. However,
utility-scale PV systems are most often installed in
places with high solar resource and with incentives
such as the investment tax credit (ITC)
1
. This means
that realized energy costs are usually even lower
than the LCOE from our average-resource, no-
incentive benchmark, shown in red in Figure 3.
These low costs have driven the deployment of over
95 gigawatts direct current (GW
DC
) or 76 GW
alternating current (GW
AC
) of PV capacity in the
United States as of the end of 2020 [WM 2021, EIA
EPM 2021]. About half of this capacity was installed
after 2017 [WM 2021] and virtually all of it is
connected to the power grid. An additional 2 GW
AC
of CSP capacity is operational in the United States.
Figure 3. The modeled cost (lines) and actual
contracted energy price in power purchase
agreements (PPA, circles) for utility-scale PV electricity
have declined more than 80% since 2010. PPA prices
include incentives such as the investment tax credit
[Bolinger 2019].
The solar industry employed about 250,000 people
in the United States in 2019. Most of these jobs were
in installation, project development, wholesale trade,
and distribution. Most of these functions are

SETO Multi-Year Program Plan
7
inherently local and cannot be moved offshore. Solar
workers are in high demand and their wages are
above the national median wage. The solar
workforce approaches, and in some cases exceeds,
the ethnic and racial diversity of the U.S. workforce.
Solar jobs are available for workers with a range of
educational backgrounds and many jobs do not
require previous experience. Domestic solar
manufacturing, including manufacturing of
mounting structures, PV modules, monitoring
systems, and inverters, employed over 34,000 people
in 2019 [Solar Foundation 2020].
Operating the power system becomes more difficult
with increasing contributions from solar power. The
power system reacts faster to interruptions owing to
the power electronics that connect it to solar
generation [AEMO 2019]; the power system needs
more flexible resources to accommodate the diurnal
and uncertain nature of solar generation [CAISO
2016]; and widespread rooftop PV and other
distributed energy resources (DER) are mostly not
visible to power system operators and have the
potential to cause two-way power flow [EIA AEO
2020]. New operational strategies need to be
developed to tackle these challenges and maximize
the value of solar generation beyond just providing
energy to the power system [Mills 2012]. This
fundamental need has led to increased interest in
combining solar technology with sensing and
communication, analytics and control, and energy
storage, and in enhancing the capabilities of PV
power electronics.
Technology advancements provide opportunities to
increase the value of solar energy as deployment
grows. Sensing and communication have advanced
to provide higher temporal resolutions and wider
spatial coverage [NASPI 2017, EIA 2018, IEEE
2018]. Analytics and control have been improving
the fast dynamics of the power-electronics-heavy
system [Isik 2018, Kirby 2019, Johnson 2014] and
the visibility of DER [Quint 2019]. Battery storage
is increasingly being installed alongside PV systems
to mitigate the variability of solar energy and
provide fast-responding control capabilities
[Rudnick 2017, CPUC 2020]. This allows PV
systems to increase their support of the reliability
and resilience of the grid while delivering affordable
energy. CSP systems, which use traditional thermal
power generators, can also support the reliability of
power system and can provide stored solar energy at
the times of day when it is most needed.
Distributed PV systems offer individual energy
choice and opportunities for household and
community resilience that utility-scale PV cannot
provide. These advantages may also extend to local
pollution and cost benefits in some cases [Denholm
2014]. Americans who install PV on their homes
spend about 70% of the system’s cost on non-
hardware expenses called soft costs, such as
customer acquisition, permitting, and installation
labor. Although hardware costs have plummeted
over the past decade, soft costs have been slower to
decline in the commercial and residential sectors.
Not all households have access to residential solar
energy due to unaffordability of financing or lack of
a suitable roof [Feldman 2015, GTM 2016].
Reducing soft costs is key to making the benefits of
solar energy available to all.
Some new uses of solar energy require additional
research. Co-locating PV with agriculture or
integrating PV into building materials may address
land-use concerns in rural areas and land constraints
in urban areas [Gross 2020, Horowitz 2020, Adeh
2019]. Applying CSP to industrial processes, like
desalination, fuels synthesis, chemicals synthesis,
and food processing can extend the benefits of solar
energy beyond electricity. Data and analysis, and
sometimes new technologies, are needed to test these
new uses.
Office Structure
The office has six teams: The PV team is responsible
for photovoltaic technology, which converts sunlight
directly into electricity. The CSP team is responsible
for concentrating solar-thermal power technology,
which converts sunlight into heat and then into

SETO Multi-Year Program Plan
8
electricity or industrial process heat. The SI team
works on integrating solar energy technology with
other energy technologies and the grid. The strategic
analysis and institutional support (SAIS) team
supports the program’s soft cost reduction area, does
cross-cutting analysis in support of the office and
external stakeholders, and works to expand access to
the benefits of solar energy to all. The
manufacturing and competitiveness (MC) team
supports entrepreneurs and businesses in developing
and commercializing innovative solar products. The
operations team provides organizational support for
the entire office.
Priorities and Strategic Goals
We organize our goals according to our priorities. Everything we do advances solar technology’s ability to
provide low-cost and reliable electricity, rapid deployment, and energy beyond electricity.
Low-cost Electricity
We advance solar technology’s ability to deliver electricity to all at a cost that is low and predictable. In parts of
the country, solar electricity is already the lowest-cost form of new electricity generation capacity, but solar
electricity is not yet cost-effective everywhere. As solar energy makes an increasing contribution to the grid, it
becomes more difficult to cost-effectively integrate it. For solar technology to continue delivering low-cost
energy, it must not create undue increases in costs for the electricity system. We advance the low cost of solar
technology through these activities
2
:
Low-cost electricity
Lowering the cost of electricity from PV
Goal · Levelized cost of energy (LCOE) is less than $0.03/kWh in utility-scale PV systems (PV, SC, MC)
Goal · LCOE is less than $0.08/kWh for commercial PV systems and $0.10/kWh for residential PV
systems (SC)
Increasing flexibility to reduce grid integration cost
Goal · Utility-scale PV plus energy storage systems cost less than $1.36/W
DC
(SI)
Lowering the cost of electricity from CSP
Goal · Solar-thermal electricity with a ≥50% efficiency power cycle is demonstrated (CSP)
2
The budget areas are shown in parentheses. PV stands
for photovoltaics, CSP for concentrating solar-thermal
power, SI for systems integration, SC for soft cost
reduction, and MC for manufacturing and
competitiveness.

SETO Multi-Year Program Plan
9
Reliable Electricity
For solar technology to provide a reliable source of electricity, solar power plants must support power quality,
stability, and cybersecurity. Enhancing reliability also includes harnessing opportunities for solar technologies to
couple with energy storage and other distributed energy resources to enhance resilience.
3
Because modern CSP
plants have built-in inertia and thermal energy storage, they can also directly contribute to a reliable energy
system.
We advance reliable electricity through these activities:
Reliability can also refer to hardware with long and predictable service life. Because long-lasting hardware
contributes substantially to affordability, our work in this area is listed under the low cost priority, above.
3
Resilience is the ability to prepare for and adapt to changing conditions and withstand and recover rapidly from disruptions.
It is related to, but not the same as, reliability.
Reliable electricity
Supporting the reliability of the power system
Goal · Reliable operation is demonstrated at scale in a power system with 75% power contribution from
inverter-based sources (solar, wind, and battery storage) (SI)
Goal · Specific long duration thermal energy storage (TES) system configurations with positive NPV are
identified (CSP)
Goal · A pumped TES system has a round-trip efficiency of >50% (CSP)
Enhancing the resilience and security of the grid
Goal · A power system uses PV and storage to demonstrate rapid recovery of critical electricity services
after a cyberattack or physical event (SI)

SETO Multi-Year Program Plan
10
Rapid Deployment
Meeting the Nation’s emissions targets will require clean energy technology that can be deployed quickly. We
support this growing deployment in a way that is responsive to the needs of disadvantaged communities, workers,
the U.S. solar industry, and the environment.
We support rapid deployment through these activities:
Rapid deployment
Growing the U.S. solar industry
Goal · A well-supported and diverse solar workforce meets the needs of the industry and of disadvantaged
communities and grows to employ at least 300,000 workers (SC)
Goal · 1 GW/year of new U.S. PV manufacturing capacity is based on technology that was not yet
commercialized in 2020 (MC)
Goal · The solar hardware installed in the United States has at least 40% domestic value (MC)
Reducing the life cycle impacts of solar energy
Goal · New materials, designs, and practices are demonstrated for reducing the environmental impact of
PV technology, prioritized based on a life cycle impacts benchmark (PV, SC)
Opening new markets
Goal · 1 GW
AC
of PV installed in 2025 is combined with another use, such as agriculture or building
surfaces (SC, MC)
Ensuring that solar energy benefits all
Goal · 100% of U.S. energy consumers can choose residential solar or community solar that does not
increase their electricity cost (SC)
Energy Beyond Electricity
Reducing climate pollution in parts of the energy system beyond the electric power sector is a long-term
endeavor. Solar technology could decarbonize industrial process heat, which is currently supplied almost entirely
by fossil fuel combustion. And there may be ways to economically produce chemical fuels that can offset or
replace fossil fuels.
Mainstream use of solar energy beyond electricity requires progress in these areas:
Energy beyond electricity
Reducing industrial emissions using solar thermal technology
Goal · System concepts are defined and key components are validated for solar process heat in carbon-
emissions-intensive, high-heat-demand industries (CSP)
Finding the best ways to make solar fuels
Goal · System concepts are defined and key components are validated for producing fuels from
concentrated solar energy (CSP)

Report Title
11
Plan
In 2010, solar electricity cost four to five times more
than electricity from conventional generation. Cost
reduction was critical for solar technology to
succeed. Accordingly, until recently, reducing the
levelized cost of solar electricity was SETO’s main
objective. Now that solar electricity is often cost-
competitive with conventional generation, the
program adds three new priorities: reliable
electricity, rapid deployment, and energy beyond
electricity. We use a more comprehensive set of
targets than cost alone to track progress on these
priorities.
We have set goals that go beyond cost reduction to
prioritize reliability, rapid deployment, and energy
beyond electricity. Several of these goals deal with
the integration of solar technology with adjacent
domains, such as the power system, energy storage,
land use, structures, the economy, and the
environment. We still maintain cost reduction goals
so that solar energy can be affordable across the
country.
These goals are target outcomes for the entire solar
community. Many participants will contribute to
realizing these goals. Our program is designed to
accelerate progress toward these goals using the
specific actions and priorities listed here.
SETO’s work is funded in five budget areas: PV,
CSP, systems integration, soft cost reduction, and
manufacturing and competitiveness. Our work in
each budget area is relevant to different but
overlapping sets of stakeholders. Below, the goals
are organized according to the budget area with
primary responsibility for the goal, but in practice,
some of the goals are pursued across multiple parts
of the program.
Photovoltaics
Background
PV technology converts sunlight directly into
electricity. This conversion happens in a solar cell,
which is typically a semiconductor device. Multiple
solar cells are packaged into weatherproof PV
modules, and multiple PV modules are connected
with other equipment, such as inverters and
transformers, to form a PV power plant or system.
Virtually all PV electricity produced in the nation is
made in PV systems that are connected to the
electricity grid. Utility-scale power plants, roughly 5
megawatts (MW) and larger, provide about 60% of
the nation’s PV capacity [EIA EPM 2021]. The
remaining capacity is split between commercial
systems, up to hundreds of kilowatts (kW), and
small residential systems, up to about 10 kW.
Adding a new PV-only power plant to the grid is
often straightforward and economical. But in parts of
the grid that already have a lot of solar generation, it
is increasingly common to combine PV power plants
with battery storage to better match solar generation
with electricity demand. In 2019 about 2% of all
UPV systems were paired with storage. Over 30% of
new UPV projects proposed for construction in 2022
and 2023 are paired with storage [Feldman 2020b].
Crystalline silicon (c-Si) PV made up 94% of the
global PV market in 2019. Of this, about two-thirds
was monocrystalline silicon and one-third was
multicrystalline. The remaining 6% of the market
was served by cadmium telluride (CdTe, 5%) and
copper indium gallium diselenide (CIGS, 1%)
[SPV 2020]. In the United States, 74% of the utility-
scale PV installed through 2019 was c-Si
technology, and the remaining 26% was CdTe
[EIA‑860 2020]. Commercial and residential PV are
virtually all c-Si [Barbose 2019].
While the market is dominated by crystalline silicon,
the same material that the first practical solar cells
were made from, major shifts in mainstream
technology have occurred since 2010. Median
module efficiency increased steadily, climbing 30%

SETO Multi-Year Program Plan
12
in non-utility systems, from 14.1% to 18.4%, from
2010 to 2018 [Barbose 2019]. Passivated emitter and
rear cell (PERC) replaced aluminum back surface
field as the most common solar cell type: 79% of
2019 c-Si cell manufacturing was PERC
[SPV 2020]. Single-axis trackers were used in 76%
of utility-scale PV systems in 2019 and are
particularly prominent in sunny areas
[EIA‑860 2020]. The changes contributed to a
reduction in the PV module price of 85%, from
$2.51/watt (W) in 2010 to $0.38/W in 2020, and a
reduction in the LCOE of 80% over the same time
period [Feldman 2021].
Planned improvements continue: Cells and modules
may keep getting larger, c-Si cells may move from
PERC to double-sided passivated contact or
heterojunction designs, and the extra energy
produced by bifacial PV systems, which can collect
sunlight from both sides of the PV module, may
continue to increase. However, mainstream solar cell
materials are advancing toward their single-junction
efficiency limits. While high-efficiency tandem
cells, which stack more than one solar cell in the
same device to increase efficiency, have long been
in use in space and in concentrating PV, the
mainstream PV industry is exploring low-cost
tandem cells for non-concentrating terrestrial
applications. Low-cost, high-performance materials
and processes, some of which do not yet exist, are
critical to the commercial success of these tandem
products.
On average, PV project developers now expect PV
projects to last over 32 years, up from 22 years in
2007 [Wiser 2020]. The fast pace of PV installations
is building confidence in the technology’s longevity.
New products pass the same or harsher accelerated
tests compared with old products that have proved to
be reliable. But most PV systems are less than three
years old. Reliability testing does not always keep
up with the frequent product changes that drive cost
and performance improvements. PV system health
monitoring is growing in sophistication and is
beginning to include advanced electrical
performance data analysis, aerial thermography, and
in-field electroluminescence imaging, but this
monitoring needs further correlation with long-term
performance data.
SETO addresses PV challenges in cost reduction,
performance improvement, and life cycle impacts.
Specific technical goals for these efforts are
explained in detail below.
Reaching our goals depends on cooperation among
academic and National Laboratory researchers, the
PV industry, and the energy financing and
investment communities. Our awardees make new
technology and new practices available to the
industry, which is responsible for adopting,
financing, and implementing them to reduce the cost
of solar electricity.
Goals
Low-cost electricity
Lowering the cost of electricity from PV
Goal · Levelized cost of energy (LCOE) is less
than $0.03/kWh in utility-scale PV systems
(PV, SC, MC)
Rapid deployment
Reducing the life cycle impacts of solar
energy
Goal · New materials, designs, and practices
are demonstrated for reducing the
environmental impact of PV technology,
prioritized based on a life cycle impacts
benchmark (PV, SC)
Approach
Lowering the Cost of Energy from PV
Need for continued cost reduction · For solar
energy to continue increasing its support of U.S.
energy system affordability, PV cost reductions must
continue. Today the unsubsidized LCOE of utility-
scale PV systems without battery storage is
competitive with the LCOE of conventional power
plants [Lazard 2020]. But a PV-only system cannot
SETO Multi-Year Program Plan
13
deliver electricity on demand. In areas with a lot of
solar power plants, additional solar electricity has
less value. In these areas, new PV systems are
increasingly combined with energy storage.
Decreasing PV-only LCOE mitigates the decrease in
value and leaves more room for these additional
costs. Many of the mechanisms for decreasing
utility-scale PV LCOE can also apply to residential
and commercial PV systems.
Goal · Levelized cost of energy (LCOE) is
<$0.03/kWh in utility-scale PV systems
• This goal moves the SunShot goal for
utility-scale PV LCOE from 2030 to 2025.
The goal is reached when a bottom-up cost
model shows that unsubsidized LCOE has
reached the target. This model describes a
100-MW utility-scale PV system in Kansas
City, Missouri, a location with solar
resource near the national average.
Competitiveness with other sources · While LCOE
is not a measure of electricity value, reducing LCOE
to less than $0.03 per kilowatt-hour (kWh) would
make the electricity cost from new PV generation
similar to a conventional power plant’s variable
costs, like fuel and maintenance [Lazard 2020]. In
cases where PV generation coincides with load
demand, this makes new PV power plants directly
competitive with existing conventional power plants.
But the coincidence of generation with demand
changes as more solar and wind power are added to
the grid. In areas where a lot of PV generation is
already present, PV may need to be combined with
low-cost battery storage or other mechanisms for
increasing power system flexibility, such as load
flexibility or new transmission, to be competitive
with new conventional power plants.
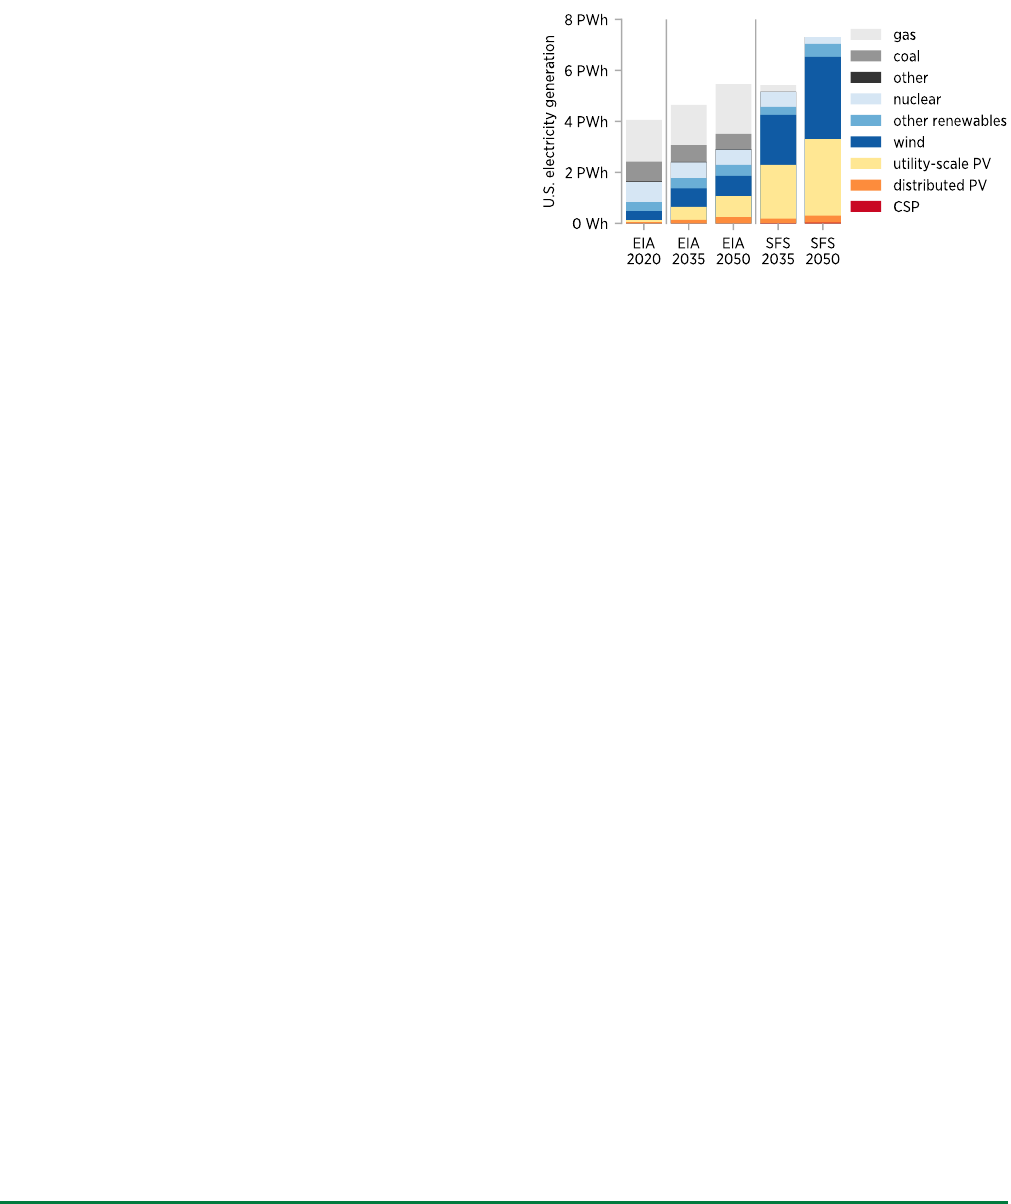
Figure 4. Several performance and cost improvements
may contribute to reaching the utility-scale PV LCOE
target. LCOE is shown in 2018 real U.S. cents per kWh.
More energy and lower hardware costs · We reduce
the cost of PV electricity by increasing the energy a
PV system produces over its service life and by
reducing the costs to build and operate a PV system.
Energy production can be improved through
increases in cell and module energy yield and
improvements to PV hardware reliability and
durability. Costs can be reduced by reducing
materials, manufacturing, and operations and
maintenance costs. We also support the
measurements, characterization, and analysis that
translate these results into real-world LCOE
reductions. Our work delivers advances that will
reach the PV industry in three or more years,
covering topics that are outside the focus and reach
of industrial R&D alone. Our awardees include the
National Laboratories, universities, and the private
sector.
One of the most effective ways to increase energy
production and decrease LCOE is by improving the
efficiency of solar cells and modules. Higher
efficiency makes the same amount of electricity
available from a smaller, cheaper power plant.
Efficiency increases have come from evolutionary
improvements to existing technologies,
revolutionary shifts to new materials or

SETO Multi-Year Program Plan
14
architectures, and everything in between. Our
portfolio delivers progress in affordability by
balancing these approaches. Based on the
progression of LCOE from 2010 to 2020, we
anticipate that the combination of numerous
improvements will enable us to reach the 2025 goal.
Figure 4 shows one possible set of improvements.
Absorber materials · Only two PV absorber
technologies—c-Si and CdTe—are mature enough
to directly deliver very-low-cost electricity in 2025,
but the 2025 goal is just the first step toward our
long-term vision. We support continued
improvements to these mainstream products because
they can build on the full-scale industry that is
already in place. But we also explore emerging
technologies, such as perovskite PV, and
technologies serving as models that advance long-
term scientific understanding of PV, such as III-V
materials, made of Group III and V elements in the
periodic table. In some cases, these emerging or
model technologies may become successors to
today’s mainstream technology.
Module efficiency and new architectures · In c-Si
and CdTe PV absorbers, the gap between actual
efficiency and theoretical maximum efficiency is
closing, and successor technologies are not yet
identified. We work to narrow the gap between cell
and module efficiency to extract the maximum value
from a cell. And we support the development of
tandem architectures that can exceed the mainstream
efficiency limits by combining multiple solar cell
types into one cell or module.
A cell or module with a given indoor-measured
efficiency might deliver different amounts of annual
energy depending on cell design, module design,
system configuration, and system operation. We
support continued increases in energy yield through
innovations in each of these areas.
Reliability and durability · Minimizing LCOE
requires making the entire PV system’s service life
long and predictable, even as product improvements
occur multiple times per year. We support
improvements to PV reliability through new
materials and designs, test and measurement
methods, and computer simulations. We also work
to identify emerging reliability concerns and
quantify and reduce uncertainty in PV system
service life with science-based reliability testing and
by collecting and analyzing field data on degradation
and failure. These improvements reduce uncertainty
in the modeled energy output of proposed power
plants, reducing the risk associated with investment.
Our awardees integrate their findings into the
international standards that affect virtually all grid-
connected PV globally.
Balance of system costs · Over 20% of the hardware
cost in a utility-scale PV system is spent on
components other than modules and inverters. These
balance of system (BOS) components include
connectors, wiring, combiners, racks, and trackers.
We pursue hardware cost reductions such as new
materials, designs, and manufacturing techniques
that use less material or less expensive material.
BOS innovation can also help PV deliver more
energy, longer system life, better durability, and
improved safety.
Operating costs · Operations and maintenance
(O&M) for PV power plants includes monitoring
system performance, managing vegetation, cleaning
modules, and repairing equipment. We fund work to
minimize these costs by studying technologies that
can reduce O&M requirements and to perform
related activities more cost-effectively.
Reducing the Environmental Impacts of Solar
Energy
Quantifying environmental impacts · For PV to
deliver clean electricity, it must be produced in a
way that minimizes waste, energy use, negative
effects on human health, and pollution. These
consequences of the manufacture and use of PV are
not yet routinely tracked. New technology can
reduce PV’s environmental impact. The information
needed to properly prioritize this R&D is not always
available.

SETO Multi-Year Program Plan
15
Publishing a new benchmark · We will support an
effort to establish a life cycle benchmark for PV.
The benchmark will include selected typical and
emerging products, such as c-Si PERC, c-Si
heterojunction, CdTe, and perovskite, and selected
system configurations, such as utility-scale single-
axis tracking and rooftop residential.
Building on the success of PV cost benchmarks, a
DOE-published life cycle benchmark will effectively
disseminate expert analysis to build awareness and
acceptance of priorities for reducing impacts. Details
of the analysis will be publicly available so others
can assess candidate improvements. Because PV is
an energy generation technology, energy payback
time (EPBT) and energy return on energy invested
(EROI) are relevant metrics to assess its net benefit
to society. The life cycle benchmark will include
metrics like EPBT and EROI alongside more
conventional LCA metrics. Producing a benchmark,
which includes setting a recommended system
boundary and specifying inputs, will give
researchers the information they need to tackle the
most important life cycle projects.
Technology to reduce environmental impacts · In
parallel to developing a life cycle benchmark, we
pursue technology that is already known to have
promise for reducing environmental impacts. This
includes new materials, designs, and practices.
Choosing new materials and designs upfront can
make PV products longer-lasting, less energy-
intensive to produce, easier to recycle, and less
polluting at the end of life. In some cases, the use of
rare, critical, or energy-intensive materials can be
reduced, as with reducing kerf loss in silicon, or
replaced entirely, as with the replacement of silver
with copper. New practices can improve our
understanding of environmental impacts to prevent
unintended pollution or human health effects, as
with improved planning and testing for toxic content
in end-of-life PV modules.
Goal · New materials, designs, and practices are
demonstrated for reducing the environmental impact
of PV technology, prioritized based on a life cycle
impacts benchmark
• The goal is reached when a life cycle
benchmark has been performed and
published and technology has been
developed according to the priorities
identified in the benchmark. The benchmark
covers selected typical and emerging
products in selected system configurations.
The benchmark recommends and rigorously
specifies a system boundary that includes
manufacture, operation, and
decommissioning. The benchmark helps
users identify high-priority ways of
improving LCA metrics and, similar to the
PV LCOE benchmark, is updated annually
as technology changes.

SETO Multi-Year Program Plan
16
Concentrating Solar-Thermal Power
Background
CSP uses a collector field of mirrors to concentrate
sunlight onto a receiver. The receiver converts the
sunlight to heat and, via a heat-transfer medium, this
heat is either converted to electricity, used in an
industrial process, or stored for later use. Specially
designed industrial processes may someday use
concentrated sunlight directly, without an
intermediate heat transfer medium, to replace fossil
fuels in emissions-intensive industries.
Storing thermal energy is less complicated and less
expensive than storing electrical energy. It is
straightforward to scale a CSP system’s collector
field and thermal energy reservoir to provide
electricity or process heat for many hours after
sunset. Depending on how many hours of stored
energy are implemented, CSP plants can act as
“peaker” power plants, providing solar electricity
when it is most needed; as “baseload” power plants,
providing solar electricity at virtually all times of
day; or as continuous sources of solar industrial
process heat (SIPH), offsetting or replacing the
combustion of conventional fuels. Thermal energy
storage (TES) technology originally designed for
CSP can also be deployed separately in electro-
thermal energy storage (ETES) systems in which
heat is produced with electricity. ETES plants can
store energy produced elsewhere and return it to the
grid later as electricity.
CSP plants use a turbine to generate electricity. For
grid integration purposes, CSP turbines have the
same physical properties as the turbines in a
conventional power plant. Combined with their
dispatchability, this clears the way for CSP to
integrate easily with the power grid.
CSP has not achieved widespread adoption in the
U.S. Only direct sunlight can be effectively
concentrated using mirrors, so CSP is best suited for
the Nation’s sunniest areas such as the Southwest.
About 2 GW of American CSP plants are
operational. Since 2015, an additional 2 GW of CSP
capacity has been deployed in the Middle East,
North Africa, and China, but no new CSP plant has
been built domestically [Feldman 2020]. The
minimum practical size for a CSP plant, to optimize
LCOE, is currently about 100 MW, requiring
hundreds of millions of dollars to build. To see
further adoption, CSP technology needs to reach
lower costs through technology advancements and
increase private-sector investment by reducing the
financial risk associated with emerging technology.
Some of this technology exists at various stages of
maturity but still must be integrated and
demonstrated in the field.
There is a path for dispatchable solar electricity and
process heat from a CSP plant to be cost-competitive
with conventional fuels [Murphy 2019, Kurup 2019,
Lazard 2020]. Today the unsubsidized LCOE of a
CSP plant with 14 hours of thermal storage is
$0.10/kWh, according to detailed cost models.
Through technology improvements, component
integration, demonstration, and achieving economies
of scale, this cost can continue to be driven down.
Industrial process heat from CSP technology can
also be competitive with process heat from
conventional fuels [Kurup 2015].
Some parts of the energy system are challenging to
electrify, making them difficult to decarbonize using
renewable electricity. CSP could address this
challenge using specifically designed plants that
drive processes, such as cement production, metals
refining, and fuels production, directly from
sunlight.
We fund R&D and demonstration to support
advancements toward low-cost CSP electricity and
industrial process heat. Our R&D efforts include
materials and fabrication methods, equipment design
and component integration, methods of operation,
and analysis of application of CSP toward multiple
different applications, such as the electricity grid,
water desalination and other industrial processes.
Specific technical goals for these efforts are
explained in detail below.
SETO Multi-Year Program Plan
17
Reaching our goals depends on cooperation among
academic and National Laboratory researchers, the
CSP and adjacent industries, and the energy
financing and investment communities. A major
asset of CSP is its ability to store energy for later
use, so our CSP program is coordinated with the
DOE Energy Storage Grand Challenge (ESGC). Our
R&D establishes new technologies and reduces
investment risk through demonstration. However,
private-sector investments are necessary to bring
CSP electricity and SIPH technology to scale.
Goals
Low-cost electricity
Lowering the cost of electricity from CSP
Goal · Solar-thermal electricity with a ≥50%
efficiency power cycle is demonstrated (CSP)
Reliable electricity
Supporting the reliability of the power system
Goal · Specific long duration thermal energy
storage (TES) system configurations with
positive NPV are identified (CSP)
Goal · A pumped TES system has a round-trip
efficiency of >50% (CSP)
Energy beyond electricity
Reducing industrial emissions using solar
thermal technology
Goal · System concepts are defined and key
components are validated for solar process
heat in carbon-emissions-intensive, high-heat-
demand industries (CSP)
Finding the best ways to make solar fuels
Goal · System concepts are defined and key
components are validated for producing fuels
from concentrated solar energy (CSP)
Approach
Lowering the Cost of Electricity from CSP
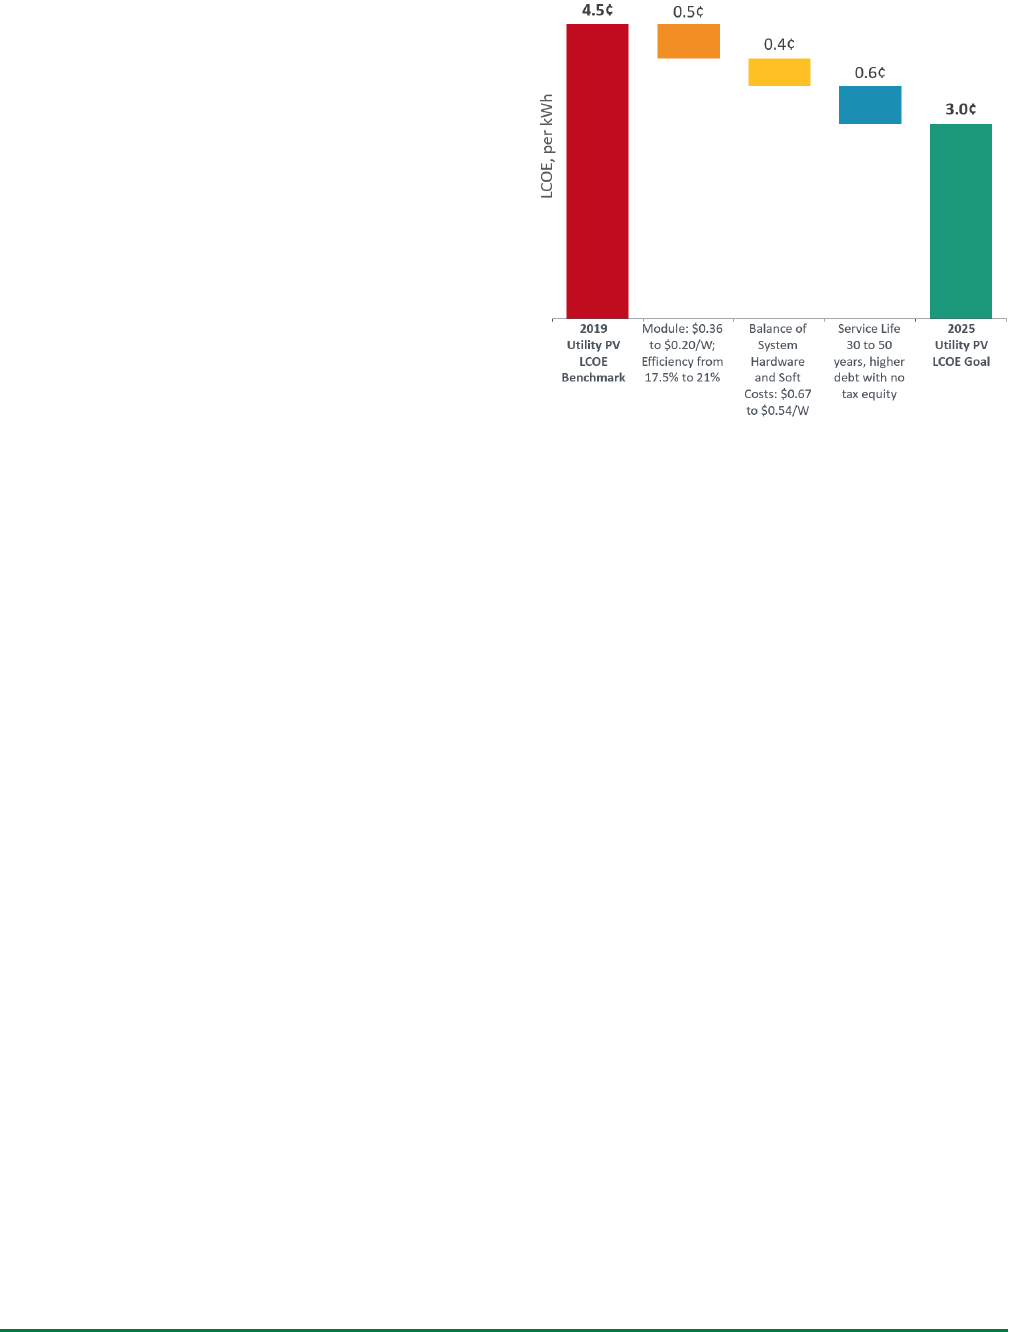
Reducing cost with higher temperatures · In 2016,
SETO set a goal for CSP with 14 hours of thermal
energy storage to provide electricity at an LCOE of
$0.05/kWh by 2030. Reaching this target could
unlock CSP deployment in the U.S. Our 2025 goal
for CSP LCOE at $0.065/kWh represents partial
progress toward the 2030 goal. Both of these targets
are for systems without subsidies in the American
southwest with high direct solar resource. As shown
in Figure 5, multiple performance and cost
improvements will be needed to reach the 2030 goal.
These include cost reductions for the collector field,
receiver, energy storage, and operations and
maintenance. The performance improvement shown
in the figure is a power cycle net efficiency of at
least 50%. The most promising pathway to achieve
this is with a high-temperature power cycle such as a
supercritical carbon dioxide (sCO
2
) Brayton cycle.
The cost reductions must be achieved while
simultaneously introducing heat-transfer media and
components that are compatible with this high-
temperature power cycle.
Figure 5. Several performance and cost improvements
may combine to reach the 2030 target for CSP LCOE.
LCOE is shown in 2018 real U.S. cents per kWh.
Our work developing and demonstrating a high-
temperature power cycle aims to realize the third
generation of commercial CSP technology, known
SETO Multi-Year Program Plan
18
as Gen3 [Mehos 2017]. Gen3 is the class of
technologies that enable solar heat to be collected,
stored, and used at temperatures exceeding 565°
Celsius, the maximum temperature of conventional
molten nitrate salt technology. The goal is for Gen3
technology to deliver heat to an sCO
2
cycle at 700°C
or higher. In the example scenario in Figure 5, Gen3
technology is responsible for about half the LCOE
reduction toward our target.
A major Gen3 CSP technology effort is already
underway. The Gen3 program has completed
technology development, component validation, and
system design projects for receiver, storage, and heat
exchanger technology using solid, liquid, and
supercritical fluid heat-transfer media. In early 2021,
solid particle technology was selected as the most
promising heat transfer medium to achieve SETO
goals. Efforts are now focused on a megawatt-scale
demonstration of this technology before 2025.
High-temperature materials · Developing and
integrating high-temperature components will
require new materials to withstand the demanding
thermal and chemical environment of a CSP system.
These materials include heat-transfer and storage
media and the materials for system components. Our
awardees characterize these materials
thermophysically, thermomechanically, and
thermochemically to ensure their performance,
durability, and corrosion resistance. Our awardees
also study new manufacturing techniques to enable
cost-effective mass production for new parts and
special materials.
Power block · Our work also reduces power block
costs. Supercritical CO
2
turbines can be applied in
solar, fossil, and nuclear plants and we collaborate
with DOE’s Offices of Fossil and Nuclear Energy to
advance sCO
2
technology. We also work to realize
efficient integration between sCO
2
turbines and a
thermal energy storage system, an opportunity that is
currently specific to CSP.
Collector fields · Low-cost, high efficiency “power
tower” CSP systems require solar collector, or
heliostat, fields with low cost and high performance.
High-temperature solar industrial processes will also
rely on high-performance heliostat fields. Nearly
half the LCOE reduction in the example scenario in
Figure 5 comes from lower collector field costs.
Power tower systems include those to be used in
Gen3 power plants and for high-temperature SIPH.
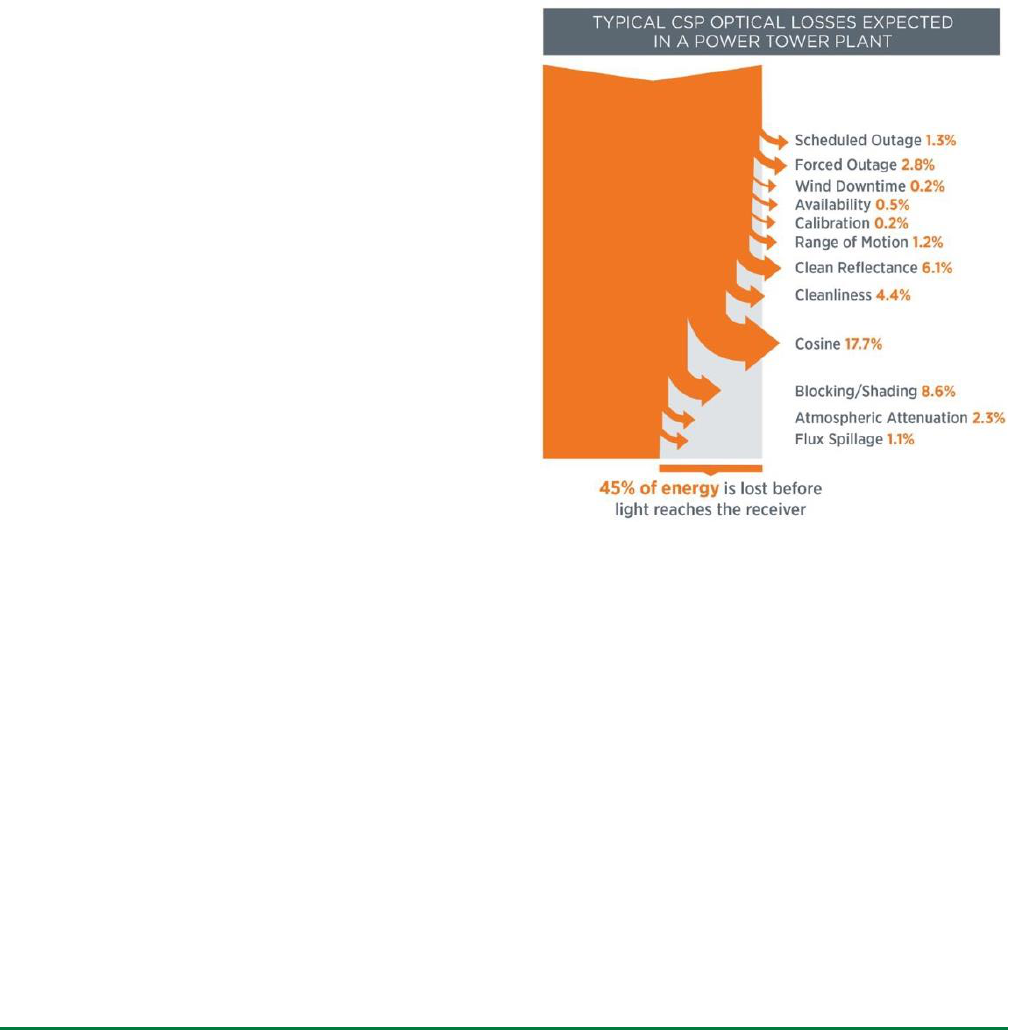
Currently, about 45% of incoming solar energy is
lost between the collector and the receiver, as
illustrated in Figure 6Error! Reference source not
found..
Figure 6. Losses between the collector and the
receiver in a CSP system account for 45% of incoming
energy.
The heliostat field is an expensive and performance-
critical component of a CSP system. Improving the
field’s cost and performance means less capital is
needed to deliver the same energy output. A large
collector area (high solar multiple) is a key attribute
of a CSP system that has, and effectively uses, long-
duration thermal storage.
We pursue heliostat field improvements through
better materials, better hardware, and better
operational characteristics. Structural cost can be
reduced by replacing steel with lower-cost materials
or by using lighter-weight reflectors. Improved

SETO Multi-Year Program Plan
19
hardware designs can reduce canting error, tracking
error, and soiling losses, all of which reduce
efficiency. Operational improvements, such as
autonomous control of heliostats, may also help
address calibration and tracking issues.
As the industry shifts to higher receiver
temperatures, controlling the flux and flux
uniformity at the receiver becomes increasingly
important. Improvements to these aspects of the
heliostat field performance deliver benefits to overall
system efficiency.
Integration and demonstration · We reduce the
risks associated with investing in new CSP
technology by supporting integration and
demonstration. Switching to sCO
2
power cycles also
substantially reduces the minimum practical size of a
plant. Reduced risk and reduced minimum
investment lower financing costs and should
increase the capital available to invest in CSP
technology.
Goal · Solar-thermal electricity with a ≥50%
efficiency power cycle is demonstrated
• The goal is met when a prototype of an
integrated receiver, storage, and delivery
system generating 1 MW or more has been
demonstrated. This system must deliver
thermal energy to a power cycle’s working
fluid at more than 700°C, but the turbine is
not included in the prototype. The goal
applies to any power cycle with a net
efficiency exceeding 50%. The sCO
2
Brayton cycle is currently the most
promising way to achieve this.
Supporting the Reliability of the Power System
Shifting energy supply and demand · The grid uses
stored energy to enhance reliability. Today, batteries
supply peaking capacity, energy time-shifting, and
operating reserves. As the grid integrates more
variable renewable energy, the need for peaking
capacity will increase and new needs will arise for
daily, multi-day, and seasonal capacity and energy
time-shifting [Denholm 2021]. We support work on
thermal energy storage systems, which can easily
scale to long durations, independently of their peak
capacity. These systems could have lower cost than
batteries when storing energy for longer than a few
hours. We also support work on thermochemical
storage concepts that can store energy for many days
without loss.
Thermal energy storage · TES allows the amount of
stored energy to be adjusted independently of the
equipment that uses the energy. Plants using TES
can add storage capacity as demand increases,
without upgrading the plant itself. Our work in
thermal energy storage takes full advantage of
technology developed in the Gen3 CSP program,
described above. Higher temperatures lead to higher
thermodynamic efficiencies and we push the limits
of new and existing materials, components, and
system designs. Reaching high temperatures requires
advanced storage media, component materials, heat
exchangers, pumps, and tanks. We support the
development and demonstration of these
technologies.
Goal · Specific long duration thermal energy storage
(TES) system configurations with positive NPV are
identified
• The goal is reached when detailed
technoeconomic analysis shows that specific
thermal energy storage systems attached to
power plants or industrial processes have
economic benefits that outweigh their costs
(positive net present value).
Electro-thermal energy storage · Core TES
technology that originated with CSP has a promising
application in ETES, where electrical energy is
stored as heat and later converted to electricity and
returned. ETES plants use many of the same
components developed for Gen3 CSP and ETES can
be deployed alone or hybridized with CSP plants. As
more variable renewable energy is deployed on the
grid, demand for storing more than a few hours’
electricity may increase. We support the component
and system developments necessary to demonstrate

SETO Multi-Year Program Plan
20
pumped thermal energy storage (PTES), a version of
ETES that uses a heat pump and heat engine to
convert between electrical and thermal energy. Heat
pumps raise the temperature of waste heat so it can
be stored as useful energy, unlocking round-trip
efficiency of >50% in PTES systems.
Goal · A pumped TES system has a round-trip
efficiency of >50%
• The goal is reached when more than 50% of
the electrical energy put into a PTES system
is available as electrical output later. We
may use a full-scale demonstration or a
combination of component-level validation
studies to meet this target.
Reducing Industrial Emissions Using Solar
Thermal Technology
Moving beyond electricity · The office works to
make solar energy a cost-effective alternative to
conventional fuels for industrial process heat. We
pursue cost reductions and process integration
improvements to SIPH. Our awardees study a range
of temperatures and industrial applications.
Developing scalable, low-cost solutions for this
variety of applications is a key challenge. High-
priority applications include water desalination and
synthesis of fuels and chemicals.
Process heat accounts for about 70% of the energy
used in U.S. manufacturing and 8% of the nation’s
total energy consumption [EIA MECS 2014]. Solar
energy can provide a clean source of industrial
process heat that is free of fuel costs.
New industries may expand to take advantage of
low-cost SIPH. These include water desalination and
fuels synthesis. Solar desalination replaces
electricity or fuel use to address clean water
shortages and increasing quantities of specialized
wastewater. Solar fuels synthesis represents an
opportunity to expand the role of solar energy in the
American energy system, offsetting the use of fossil
fuels.
Figure 7. Cumulative process heating energy demand
in the United States in 2015 is shown as a function of
process temperature [Schoeneberger 2020].
Matching technology to applications ·
Implementing cost-effective SIPH requires
analyzing the energy and temperature ranges of
industrial demand, summarized in Figure 7. These
processes range from heating water at 70°C to
melting steel scrap at 1,800°C. About half of process
heat energy demand is below 260°C and half is
above. Candidate applications for SIPH include both
low-temperature processes, such as enhanced oil
recovery, food processing, and water desalination,
and high-temperature processes, such as calcination
to produce cement, thermochemical water splitting
for producing solar fuels, and ammonia synthesis for
producing fertilizer.
We will support the analysis needed to match solar-
thermal collection, conversion, and storage
technology to industrial processes at different
temperatures. We anticipate that systems that are
scalable in temperature, thermal power, and storage
duration will most cost-effectively meet a range of
applications. The technology needed for low-cost
SIPH also includes very-low-cost solar collectors
and innovative methods of integration with
industrial processes.
Goal · System concepts are defined and key
components are validated for solar process heat in
carbon-emissions-intensive, high-heat-demand
industries

SETO Multi-Year Program Plan
21
• The goal is reached when experimental
component validation has shown how a
suitable industrial process can be driven
using concentrated sunlight and a full
system concept defines a roadmap for
realizing an economically viable version of
the process.
Solar thermal fuels · Making chemical fuels using
concentrated sunlight is not yet commercially viable.
Many thermochemical pathways are available and
there is not yet a consensus on what fuel and what
method is most promising. Renewable hydrogen is a
desirable fuel and chemical feedstock. Hydrogen can
be produced directly through solar thermochemical
mechanisms, although existing catalysts require very
high temperatures and operate at low efficiency.
High-temperature electrolysis (HTE) of water is
another method for producing hydrogen with higher
efficiency than ordinary electrolysis. HTE can be
hybridized with CSP as a source of heat, electricity,
or both. Alternate fuels can also be produced using
thermal processes. These include metal oxides,
sulfur, ammonia, and versions of fossil fuels or
biofuels that have been refined to have higher energy
content.
We support solar fuel concepts that can use existing
or Gen3 CSP technology. In the coming years, we
will support analysis to identify promising
thermochemical pathways, development of
component technologies, and validation of key
components for the most promising pathways. Key
components include catalysts and reactors that are
specific to solar fuels and cannot be borrowed from
CSP.
Goal · System concepts are defined and key
components are validated for producing fuels from
concentrated solar energy
• The goal is reached when experimental
component validation has shown how a
suitable fuel synthesis process can be driven
using concentrated sunlight and a full
system concept defines a roadmap for
realizing an economically viable version of
the process.

SETO Multi-Year Program Plan
22
Systems Integration
Background
The electric power system is evolving toward a new
mix of generation resources, delivery networks, and
consumption devices. Inverter-based resources,
including solar, wind, and battery storage technology
[Ren21 2019] are steadily increasing in deployment,
but these resources are much more prevalent in some
regions than in others. The electricity network is also
evolving, adding sensors and communications, direct
current (DC) power lines, flexible alternating current
(AC) transmission systems, and solid-state
transformers [Burkes 2017, GMLC 2020]. Load
consumption types and profiles are being
transformed because of deeper electrification of end
uses such as electric vehicles [EIA AEO 2020].
Finally, new technologies such as energy storage are
advancing for practical applications at different
scales [Rudnick 2017]. At the same time, studies
show the power system infrastructure runs closer to
its operational limits with diminishing thermal and
stability margins [NERC 2018]. These trends are
fundamentally changing the characteristics of the
electric power system: It is experiencing lower
inertia and more uncertainty, and it is using more
distributed energy resources.
Lower inertia is a result of more inverter-connected
generation. The mechanical inertia in the power
system is decreasing as conventional synchronous
generation is retired and displaced
[Matevosyan 2020]. Reduced system inertia has
caused concerns about power system
reliability [NERC 2017a]. However, with further
research and development, the high-speed control
capabilities of power electronic devices, such as PV
inverters, could enable a more responsive power
system, reducing the need for mechanical inertia.
Uncertainties in the power system are increasing
because of variable generation, active loads, electric
vehicles, system contingencies, and unforeseen and
uncontrolled external events [Quint 2019]. Though
these uncertainties create major challenges for solar
integration, better situational awareness and more
flexible controls will also make the grid more
adaptive. This can enable generation to meet larger
and faster ramps when the solar power contribution
is high, while enforcing reliability requirements in a
continuously changing environment.
Adoption of distributed energy resources such as
rooftop solar generation is increasing. There are over
2.7 million solar generators on the U.S. distribution
system today, representing about 40% of total PV
capacity, with steady growth expected into the future
[WM 2021, Feldman 2020]. This is a shift from the
few, large, central resources of the past. Managing
many small resources embedded in the power
system is a fundamental challenge. But distributed
solar generation can also make the power system
more scalable, thus more resilient and secure against
cyberattack and physical disturbances.
Lower inertia, more uncertainty, and more
distributed resources present an opportunity to
transition the power system to a new paradigm: a
responsive, adaptive, and scalable power system.
Solar generation, as a fast-growing resource, can
play an essential role in this paradigm shift.
SETO systems integration (SI) research addresses
system-level issues in integrating solar generation
and other energy technologies into the electric power
system to meet customer needs. The technical
challenges of solar SI increase with the amount of
solar energy and solar power being produced.
Energy is measured as a total contribution over a
period of time, and power is measured at a specific
moment. Because of their capacity factors
[EIA EPM 2020], inverter-based solar and wind
resources delivering 20% of a region’s annual
energy may sometimes supply over 50% of the
region’s instantaneous power [CAISO 2020]. Table
1 shows the peak power and annual energy
contributed by solar and wind resources for power
systems of different sizes in some areas with the
highest wind and solar contributions to date. Wind
generation is usually not distributed but solar and
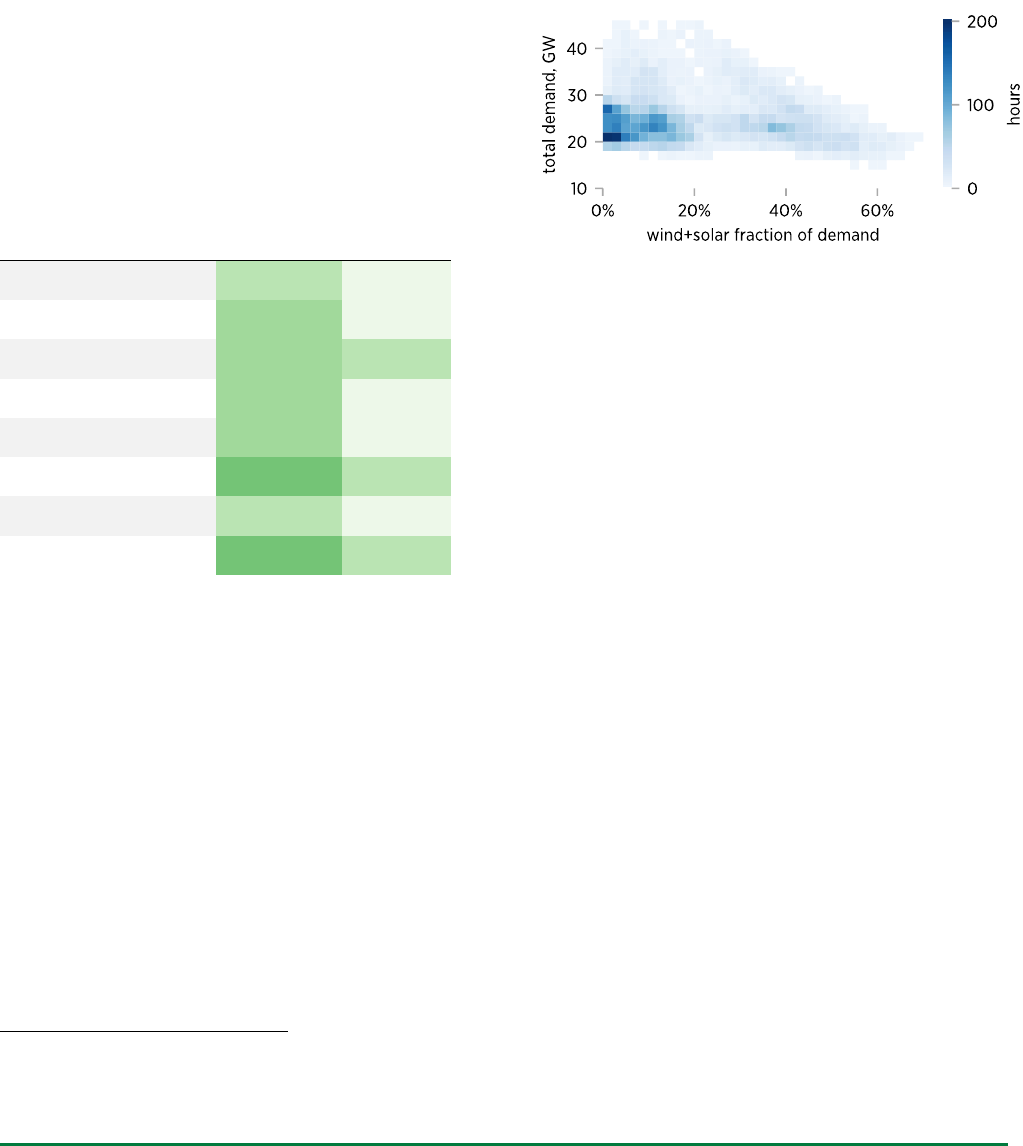
SETO Multi-Year Program Plan
23
wind generation both have lower inertia and more
uncertainty compared with conventional generation.
Table 1. Wind and solar technology now make major
power and energy contributions to power systems
around the world. Contributions for 2019 are shown
for the Western Electricity Coordinating Council
(WECC), the Electric Reliability Council of Texas
(ERCOT), the Southwest Power Pool (SPP), the
California Independent System Operator (CAISO), the
Australia National Electricity Market (NEM), Ireland,
and two islands in the state of Hawaii. [CAISO 2020,
ERCOT 2020, SPP 2020, CAISO 2019, AEMO 2019,
EirGrid 2019, HECO 2019]
Power system
System size
Peak
solar + wind
power
contribution
Annual
solar + wind
energy
contribution
U.S. WECC
163 GW
36%
13%
U.S. ERCOT
80 GW
58%
20%
U.S. SPP
51 GW
69%
28%
U.S. CAISO
4
44 GW
70%
20%
Australia NEM
35 GW
50%
21%
Ireland
7 GW
84%
36%
Oahu
4 GW
58%
22%
Maui
0.5 GW
80%
37%
High solar and wind power contributions have
already been achieved in some of the systems shown
in Table 1. But scaling up these successes is not
always easy because of the complex
interconnectedness of large power grids and the
unique challenges of island power grids. These high
solar and wind power contributions usually occurred
during low-demand periods (see the California
example in Figure 8), giving them the benefit of
additional backup from conventional power
generation. The current strategies are not scalable or
cost-effective for future scenarios with system-wide
high solar and wind power contributions and
4
In 2019, 35% of the solar energy in California was
produced “behind the meter” and is excluded from these
numbers.
diminishing conventional generation. Excessively
relying on energy storage is not currently cost-
effective, either. Developing scalable and cost-
effective approaches for 50% to 75% wind and solar
power contribution during medium- and high-
demand periods remains a fundamental challenge.
Figure 8. The frequency of occurrence of solar and
wind power contributions at different demand levels in
CAISO for 2020. Solar and wind make the maximum
contribution when demand is low [EIA OpenData].
SETO addresses solar energy SI challenges related
to grid system planning, system operation, resilience
design, and power electronics and control. These
challenges are addressed through research,
development, and demonstration of data, analytics,
control, and hardware. Specific technical goals for
these efforts are explained in detail below.
Our SI work is integrated with related work in other
DOE offices. We collaborate with these offices on
power system modeling and simulation, power
electronics, hybrid systems, sensing and
communications, energy storage, and cybersecurity.
These activities are organized through DOE
initiatives such as Grid Modernization Initiative
(GMI) and Energy Storage Grand Challenge
(ESGC), and through EERE crosscut activities such
as task forces for cybersecurity and hybrid systems.
The GMI is a DOE collaborative effort of multiple
offices—Office of Electricity (OE), EERE, Office of
Cybersecurity, Energy Security, and Emergency

SETO Multi-Year Program Plan
24
Response (CESER), Office of Fossil Energy (FE),
and Office of Nuclear Energy (NE)—on
modernizing the reliability, resilience, flexibility,
sustainability, affordability, and security of the
national electric infrastructure. The initiative
integrates the technical capabilities of 14 National
Laboratories and more than 100 industry partners
[GMI 2015].
The ESGC coordinates energy storage technology
development, adoption, manufacturing, supply
chains, and relevant policies and workforce
development [ESGC 2020]. Energy storage is a
crucial complementary technology for solar energy
because it addresses short-term uncertainty and daily
and annual variability in solar generation.
Goals
Low-cost electricity
Increasing flexibility to reduce grid integration
cost
Goal · Utility-scale PV plus energy storage
systems cost less than $1.36/W
DC
(SI)
Reliable electricity
Supporting the reliability of the power system
Goal · Reliable operation is demonstrated at
scale in a power system with 75% power
contribution from inverter-based sources (i.e.,
solar, wind, and battery storage) (SI)
Enhancing the resilience and security of the
grid
Goal · A power system uses PV and storage to
demonstrate rapid recovery of critical
electricity services after a cyberattack or
physical event (SI)
5
While solar and wind technology share some system
integration challenges, our work emphasizes the
challenges that are specific to solar technology.
Approach
Supporting the Reliability of the Power System
Supporting a changing grid · As solar and wind
5
generation become key contributors to the power
system, they must actively support the operation of
the power system [AEMO 2019, NERC 2020].
Conventional methods of ensuring reliability do not
directly apply to a low-inertia power system with
high uncertainties and highly distributed resources.
With decreasing mechanical inertia and stability
support, inverter-based resources and other new
technologies must provide these functions using
their inherent responsiveness. Uncertainties must be
mitigated by flexibility in generation, transmission,
and consumption to continue meeting demand and
maintaining reliability. Coordinated monitoring and
control become essential as distributed resources
such as rooftop PV begin to make major
contributions.
Advancing inverter capabilities · Inverters and
energy storage are key to supporting the reliable
operation of power systems with high solar power
contribution. Inverters need new capabilities beyond
feeding solar DC power to the AC power system
[Matevosyan 2019, Zhong 2016]. Inverters must be
reliable and long-lasting, and data regarding their
degradation and failure must be available. Stability
control and grid-forming capability in stand-alone
and interconnected configurations are also essential.
And inverters must work in control hierarchies that
can support adaptive reconfiguration of the power
system to support emergency load balancing,
islanding, and the system-wide restoration of service
known as blackstart. In an inverter-rich power
system, fault currents are limited, and thus adaptive
protection schemes will need to be redesigned,
modeled, and simulated to understand how they can
protect both the equipment and the power system as
a whole. All these capabilities must be delivered

SETO Multi-Year Program Plan
25
cost-effectively and without compromising
cybersecurity.
Advancing communications and sensing · Reliable
grid operation with high solar power contribution
also needs advancements in data and communication
technologies. New sensing technologies are needed
to measure voltage and current waveforms in order
to capture fast inverter dynamics [IEEE 2018].
These sensors may be integrated with smart
inverters. Infrastructure needs to be developed for
communication between devices and system-level
communication. Collecting wide-area system data is
necessary for estimating system inertia and power
oscillations, and for increasing visibility and
controllability of behind-the-meter solar and DER.
Comprehensive solar data repositories can be
developed to collect and make available power
system models, measurements, event information,
and tools for solar research and deployment
[DR POWER, BetterGrids].
Understanding dynamics and
uncertainty · Achieving high reliability with
inverter-based generation requires new insights into
the dynamics and uncertainty of solar integration
with the power system. This requires accurate
dynamic modeling and simulation of inverters,
energy storage devices, PV, and other DER
[Green 2019]. These models need to be integrated
with bulk power system models for large-scale
analysis and uncertainty assessment of solar plants
as well as millions of distributed PV systems.
Inverters’ effects on power quality, including
harmonics, flicker, and voltage sag or swell, must be
simulated to understand and mitigate their effects on
other equipment in the power system. Advanced
signal processing or machine learning techniques are
needed for identifying and characterizing
unexpected energization, low current, high
impedance, or incipient faults and cyberattacks.
Goal · Reliable operation is demonstrated at scale in
a power system with 75% power contribution from
inverter-based solar and wind generation and energy
storage
• Reliable operation means that frequency and
voltage stay within accepted ranges,
including during failures of important
generation or transmission assets or during
simultaneous outages of many DER assets.
This demonstration can use an actual power
system or a test bed. The demonstration
must include solar power plants and
elements such as inverters, energy storage,
and the transmission and distribution
networks. This demonstration is valid when
the power system does not rely on import or
export with neighbors. The target is reached
when the power generation from inverter-
based solar and wind generation and energy
storage exceeds 75% or more of the system
demand. The scale of the demonstration is a
gradual progression during the MYPP
period from a small scale such as 1 MW to a
utility scale such as 20 MW or higher.
Existing and expected SI-funded projects
already have field demonstration plans to
reach these scales. This would lay solid
foundation towards the larger scales in
Table 1 as the ultimate long-term goal for
reliable operation of grids with a lot of solar
generation.
Increasing Flexibility to Reduce Grid Integration
Cost
Adding flexibility through storage · Implementing a
grid that supports large, fast generation and load
ramps requires building flexibility into resource
planning, operation, and control. Increased
flexibility of generation, load, and network will all
be necessary, and this flexibility must be provided at
low cost. Energy storage is becoming an important
resource for increased flexibility [Rudnick 2017].
Future technology development can support the
expanding role of low-cost energy storage. Energy
storage can contribute both fast-responding grid
services and long-term clean energy supply in
tandem with solar generation.

SETO Multi-Year Program Plan
26
Planning for solar integration · Long-term resource
planning relies on cost modeling and contingency
modeling of the integration of solar generation with
energy storage and with the transmission and
distribution systems. We support this modeling and
the large-scale optimization it makes possible. The
result will be integrated resource planning for larger
and more cost-effective solar contributions to the
electricity generation mix.
Forecasting, analysis, and uncertainty · Operation
and control of a power system with major solar
energy contributions will require improved
forecasting, data collection, and analysis
[Golnas 2019]. Solar forecasting needs higher spatial
resolution and wider temporal coverage, ranging
from minutes to days. This enhanced forecasting
enables the power system to more effectively adapt
to changing conditions, meeting changes in demand
at optimal cost. Less forecast uncertainty and better
quantification of this uncertainty are essential to
increasing flexibility without unnecessary expense.
Adequate grid flexibility also depends on real-time
collection of data from distributed load and
generation over a wide area. Combined with scalable
analysis, these data can increase the visibility and
controllability of behind-the-meter solar and DER.
More solar generation added to the power system
adds more uncertainty in generation. This is
especially true at sunset, when a fast increase in load
sometimes coincides with a fast decrease in solar
generation [CAISO 2020]. The reverse can occur at
sunrise. In both cases, the power system needs
greater flexibility to balance generation and load.
Today’s power systems meet this challenge using a
combination of fast-ramping conventional
generation, energy import or export with neighbors,
and curtailment of excess renewable energy. But as
solar technology supplies more of the nation’s
energy, existing practices can become more difficult
and expensive to implement. Demonstrating the
optimization of solutions to large, fast ramps will
show that new practices are in place that enable
increasing solar energy contributions.
Goal · Utility-scale PV plus energy storage systems
cost less than $1.36/W
DC
• The goal is reached when the cost of a
utility-scale PV system with four hours of
battery storage reaches $1.36/W
DC
. The cost
is evaluated using a similar bottom-up cost
model to the one used for tracking PV-only
LCOE, with 100 MW of PV and 60 MW of
battery storage. For battery storage, we will
incorporate a levelized cost of storage
(LCOS), which includes the lifetime cost
and benefit of energy storage in addition to
the initial installation cost. This effort will
be coordinated with the ongoing ESGC
initiative [ESGC 2020].
One of the major benefits of energy storage is
providing the flexibility necessary for higher solar
power contribution. There are also opportunities to
improve flexibility from other elements in the power
system through integrated resource planning.
Enhancing the Resilience and Security of the Grid
Responding to hazards · As the power system relies
more on networked communication and distributed
generation, and as natural disasters such as
hurricanes, flooding, and wildfires increase in
severity and frequency, the power system’s exposure
to cyberattacks and physical hazards increases
[NERC 2017b, Robles 2019]. While the power
system must continue minimizing outages resulting
from these threats, solar technology can help the
power system be more resilient when a disruption
does occur.
During hazards, the power system can be
reconfigured into independent segments that each
contain load and generation. With enough DER such
as PV systems, there are more opportunities for
reconfiguration to enhance grid resilience. The fast-
responding power electronics in solar generation and
energy storage systems can provide blackstart
capabilities to bring new segments more quickly
back online. Close coordination between DER and
bulk and distribution power systems can be

SETO Multi-Year Program Plan
27
developed to ensure smooth transition between
normal and recovery operations.
Realizing fast, adaptive response to physical
disruptions or cyberattacks requires new modeling
and simulation, new analysis, new inverter
capabilities, and field demonstration in partnership
with the private sector. We support modeling the
effects of all hazards on power system performance
arising from and affecting solar systems. These
models will be used to test and optimize the grid’s
response to cyberattacks and physical disruptions,
supporting new adaptive protection schemes, grid
reconfiguration, emergency load balancing,
islanding, and blackstart. An adaptive grid also
requires technology to identify faults, attacks, and
unexpected energization. Our awardees develop
advanced signal processing and machine learning
techniques to detect, identify, and mitigate these
conditions.
Advancing inverter capabilities · Grid-forming
inverters are promising technologies that support fast
stability control and automatic switching between
networked and standalone modes
[Matevosyan 2019]. These inverters must also be
cost-effective and support the functions needed to
reach the preceding goals: working in control
hierarchies with equipment from other vendors and
sensing and communicating about their power
quality.
To resist cyberattacks, inverters must be inherently
cybersecure, implement defense in depth, and
support the cyberdefense of the power system they
are connected to, following the National Institute of
Standards and Technology’s (NIST) cybersecurity
framework [NIST 2018]. Building a trustworthy,
cyber-resilient power system requires developing
innovative, dynamic cybersecurity survival
strategies for solar generation systems, especially
distributed rooftop PV. This system will be able to
recognize and reject a cyberattack automatically and
autonomously adjust to maintain electric power
supply.
Goal · A power system uses PV and storage to
demonstrate rapid recovery of critical electricity
services after a cyberattack or physical event
• Rapid recovery means that after a
cyberattack or physical interruption,
electricity service is restored in much less
than one day for critical loads in a region
with enough solar energy. Cyberattack
includes deliberate attempts to disrupt
service through an information network or
from within a piece of equipment connected
to the power system. Natural physical
hazards include storms, wildfires, or
earthquakes. Manmade physical hazards
include human errors or terrorist attacks.
The demonstration can occur during a real
event, but these are rare and not repeatable.
An alternative way of demonstrating this
capability is by combining simulation of the
power system and emulation of
communication and control systems using
multi-site federated emulation capabilities.
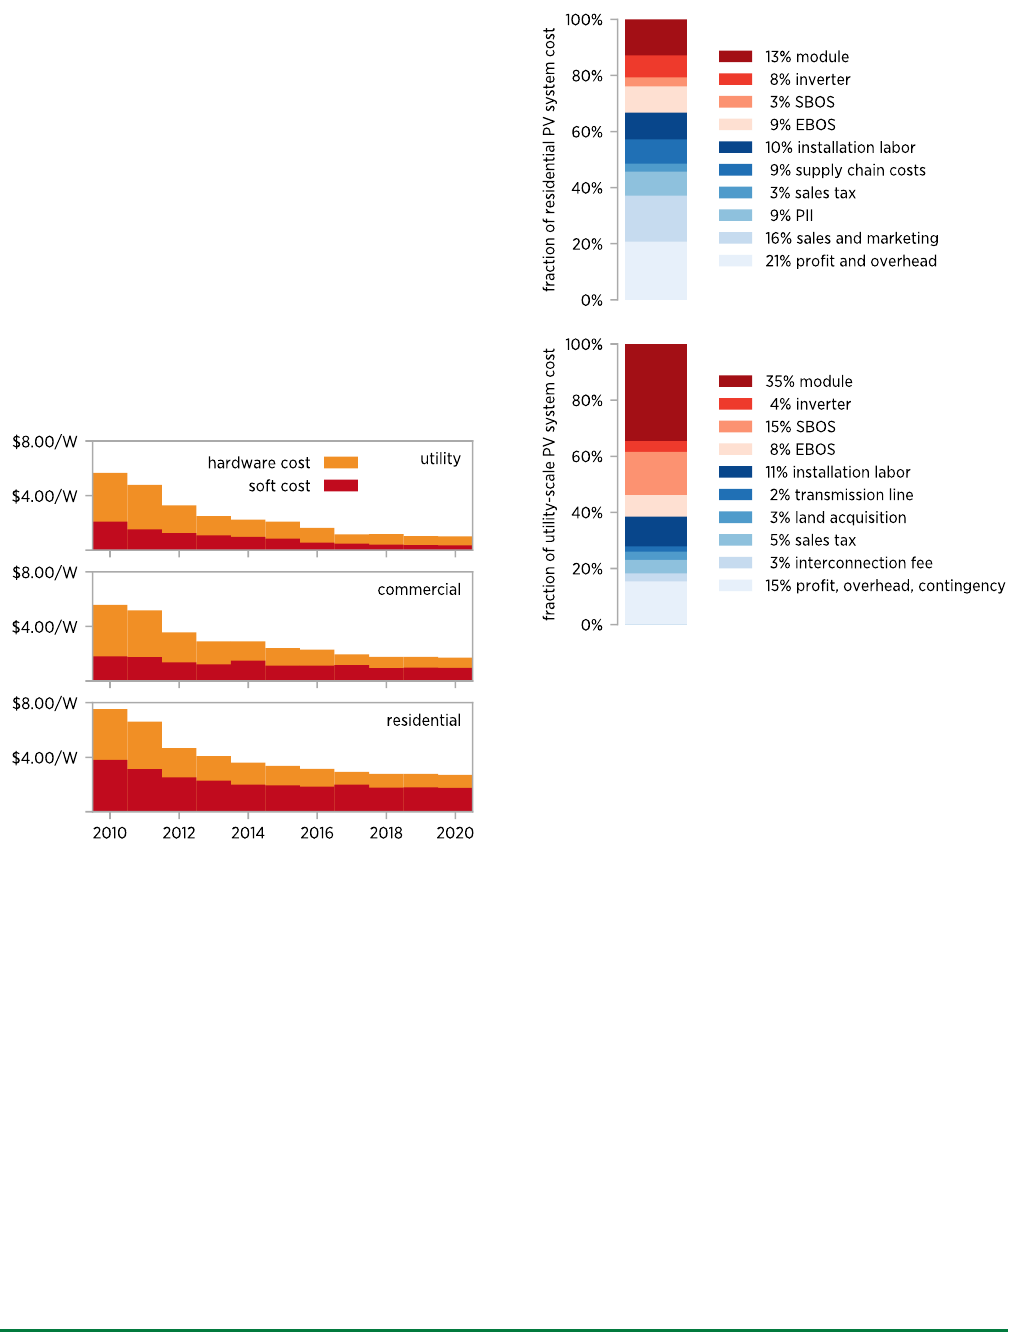
SETO Multi-Year Program Plan
28
Soft Cost Reduction
Background
Soft costs are the non-hardware costs of solar
electricity. These costs relate to project
development; financing; siting; customer
acquisition; permitting, inspection, and
interconnection (PII); installation labor; and business
overhead and profit. Figure 9 shows how hardware
and soft costs have changed. Approximately 35% of
utility-scale PV system costs and over 60% of
commercial and residential PV system costs are soft
costs [Feldman 2021].
Figure 9. The modeled hardware and soft cost
breakdown for different system types.
The components of residential PV soft costs are
shown in Figure 10. PII and installation labor
together account for more than a quarter of
residential soft costs. Financing cost, which does not
appear in Figure 10 because it is not part of upfront
solar system costs, is about 40% of the LCOE of a
residential PV system [Feldman 2021].
Figure 10. The cost breakdown of a residential PV
system (top) and a utility-scale PV system (bottom)
show the contributions of soft costs [Feldman 2020].
Hardware costs are shown in red and soft costs in
blue. EBOS is electrical balance of system; SBOS is
structural balance of system; PII is permitting,
inspection, and interconnection.
In conventional commercial and residential PV
systems, soft costs have stopped declining and are
limiting further PV electricity cost reductions.
Further reductions in the cost of PV electricity will
depend on new reductions in both hardware and soft
costs [O’Shaughnessy 2019].
Residential PV system cost is over two times higher
in the U.S. than in Germany and over three times
higher in the U.S. than in Australia, mainly due to
soft costs [WM GSPSP 2021]. In those countries,
permitting and inspection are streamlined and
governed by national rules. U.S. regulations and
business practices lead to more complex and labor-
intensive installation practices. And customer
acquisition costs are much higher in the U.S.
SETO Multi-Year Program Plan
29
[Birch 2018]. Relatively low soft costs abroad
suggest that, despite the stalled progress shown in
Figure 9, it is still possible to reduce U.S. soft costs
further.
Location-specific requirements and practices
contribute to soft costs. In the United States, there
are thousands of local jurisdictions and over 3,400
utilities. Each of these may have different
permitting, inspection, and interconnection processes
and requirements [Burkhardt 2015]. In PV systems
that are combined with storage or other DER, soft
costs are higher than in solar-only systems
[Feldman 2021].
Deploying PV at large scale may bring increased
attention to the optimal use of land. A total of about
1 GW to 2 GW of PV capacity has been deployed
with grazing animals or pollinator habitat
underneath, on buildings, and floating on artificial
bodies of water. These dual-use systems can yield
mutual benefits for PV and the other use.
Preliminary studies suggest that combining PV with
agriculture can increase crop yield, improve
efficiency by reducing PV module temperature, and
reduce water use [Barron‑Gafford 2019]. But dual-
use systems are not common, and the benefits are
not yet fully understood or quantified.
In UPV systems, avoiding, minimizing, and
mitigating site impacts can increase costs. These
costs are poorly documented and understood, so are
particularly difficult to reduce [Hartmann 2019].
Goals
Low-cost electricity
Lowering the cost of electricity from PV
Goal · Levelized cost of energy (LCOE) is less
than $0.03/kWh in utility-scale PV systems (PV,
SC, MC)
Goal · LCOE is less than $0.08/kWh for
commercial PV systems and $0.10/kWh for
residential PV systems (SC)
Rapid deployment
Growing the U.S. solar industry
Goal · A well-supported and diverse solar
workforce meets the needs of the industry and
of disadvantaged communities and grows to
employ at least 300,000 workers (SC)
Reducing the Life Cycle Impacts of Solar
Energy
Goal · New materials, designs, and practices
are demonstrated for reducing the
environmental impact of PV technology,
prioritized based on a life cycle impacts
benchmark (PV, SC)
Opening new markets
Goal · 1 GW
AC
of PV installed in 2025 is
combined with another use, such as agriculture
or building surfaces (SC, MC)
Ensuring that solar energy benefits all
Goal · 100% of U.S. energy consumers can
choose residential solar or community solar
that does not increase their electricity cost (SC)
Approach
Lowering the Cost of Energy from PV
Reducing regulatory burden · Our office supports
the analysis and planning that local jurisdictions
need to cut red tape and make it easier and more
affordable for their residents to go solar. We fund
the collection of data, development of tools, and
provision of technical assistance that can help
streamline permitting, inspection, and

SETO Multi-Year Program Plan
30
interconnection processes, lowering the regulatory
burden for PV adoption.
Informing decisions · We also research and publish
market information that can support more efficient
decision-making and associated cost reductions. This
information includes, for example, how solar
installations affect residential home prices,
benchmark costs of different PV market segments,
and training materials for first responders.
Reducing soft costs of combining PV with other
DERs · Adding storage and other DER technology
to PV systems can enhance the energy resilience of
homes and critical community infrastructure, like
police stations, fire stations, and hospitals, in an
emergency. These combined PV+DER systems,
however, can have much higher soft costs than PV-
only systems. For example, adding battery storage to
a residential PV system increases soft costs by 50%
[Feldman 2021].
We research siting, PII, and operation of PV+DER
systems and identify ways to reduce these costs with
improvements to technology or information. And we
study the resilience value and monetary value of
operating such systems.
Reducing barriers to combining PV with new home
construction and re-roofing · Residential PV
systems installed on new houses during construction
or on existing houses during roof replacement
present major soft cost reduction opportunities
[Ardani 2018]. Most rooftop PV systems are
implemented as separate roofing and PV products.
Integrating PV and roofing products can reduce
supply chain and installation labor costs. Integrating
the PV and construction industries further reduces
customer acquisition, overhead, and labor costs. And
PV permitting costs can be reduced when the
permitting process is integrated with the permitting
process for a roof replacement, construction of a
new house, or construction of an entire new
neighborhood. Residential LCOE for new
construction or roof replacement has a path to
$0.05/kWh in 2030. Through collaboration with the
construction industry, we are studying the barriers
and solutions to installing PV during home
construction and re-roofing.
Reducing costs for commercial solar · Some
aspects of PV system ownership, financing, and
procurement are unique to commercial rooftops. We
work with commercial building owners to find
strategies that reduce cost and encourage adoption of
commercial PV. Our research on rate designs and
compensation mechanisms helps building owners
make informed decisions. We also study under what
conditions the colocation of energy storage and
electric vehicle charging with commercial PV
systems can provide benefits to the building owner
or tenants.
Goal · LCOE is less than $0.08/kWh for commercial
PV systems and $0.10/kWh for residential PV
systems
• This goal is reached when a bottom-up cost
model shows that unsubsidized LCOE has
reached the target. This model describes
rooftop commercial and residential PV
systems in Kansas City, Missouri, a location
with solar resource near the national
average.
Growing the U.S. Solar Industry
Building the solar workforce · A well-supported
and diverse solar workforce will ensure that the
industry can hire the range of expertise it needs to
grow, adopt updated technologies, and develop more
efficient practices. Our office funds solar workforce
training and placement for individuals, such as:
• veterans and transitioning service members,
• community college and university students,
• and people who have been incarcerated.
Our approach prioritizes workers hardest hit by
discrimination, economic exclusion, and exploitation
– including communities of color, legacy fuel
workers, and frontline communities most affected by
climate and environmental problems. We work to
make training, mentoring, placement, growth
opportunities, meaningful wages, and labor

SETO Multi-Year Program Plan
31
standards accessible to all workers in the industry. In
collaboration with other EERE offices, we also fund
solar training, job placement, tools, and resources for
professionals in adjacent fields, such as emergency
responders and building managers, who are critical
to supporting the integration of solar energy into the
power system.
Goal · A well-supported and diverse solar workforce
meets the needs of the industry and of disadvantaged
communities and grows to employ at least 300,000
workers
• The goal is reached when the solar
workforce reaches 300,000. We will monitor
the availability of jobs and training for
disadvantaged communities to ensure the
benefits of solar employment are available
to all.
Reducing the Life Cycle Impacts of Solar Energy
Improving PV management at end-of-life · Meeting
the Nation’s energy goals will require rapid solar
deployment. This deployment is expected to produce
cumulatively tens of millions of metric tons of PV
waste by 2050. Like electronic waste, PV waste can
contain materials that are rare, valuable, hazardous,
or energy-intensive to produce. But PV waste is
mostly glass and aluminum, so it is also similar to
some construction waste. Today, far more consumer
electronics waste is produced than PV waste, but this
may change as PV deployment accelerates
[EPA 2020b, SFS 2021]. In a sustainable energy
system, the materials in PV waste should be
recovered and used again. We support analysis to
understand and predict the production and handling
of PV waste. We will also convene PV stakeholders
to understand and resolve the community’s end-of-
life concerns. We work toward proactive,
responsible handling of the PV waste that today’s
accelerating deployment is producing.
Minimizing land and wildlife impacts · There are
federal, state, and local legal requirements that solar
energy projects manage the impacts they have on
their surroundings. These site impacts include a
project’s effects on stormwater runoff; wetlands and
streams; wildlife and their habitats; historic
properties; and public lands. The procedures and
costs of fulfilling the requirements to manage these
impacts may be different for each site.
[Hartmann 2019] We study the impacts of PV on
stormwater runoff and develop technologies and
methods for collecting data to better understand
wildlife interactions with PV facilities. We also are
also studying the ecological impacts of co-locating
PV with pollinator habitat, grazing, and crops.
Goal · New materials, designs, and practices are
demonstrated for reducing the environmental impact
of PV technology, prioritized based on a life cycle
impacts benchmark
• The goal can be met after a life cycle
impacts benchmark is performed and
published for commercial PV technology,
then new technology has been demonstrated
that reduces environmental impact. This
goal is shared with the PV budget area.
Opening New Markets
Resolving land-use concerns · As PV deployment
increases, some PV projects may face local
opposition due to land use conflicts, such as
replacing agricultural land [Gross 2020]. Dual-use
systems could resolve these conflicts and potentially
deliver mutual benefits [Barron-Gafford 2019]. For
example, a single piece of land can produce revenue
from grazing under PV panels and from the
electricity produced by the panels. When the benefits
of adding PV exceed the costs, a project has positive
net present value (NPV).
Goal · 1 GW
AC
of PV installed in 2025 is combined
with another use, such as agriculture or building
surfaces
• Dual use includes PV and agriculture
colocation, BIPV, and floating PV. It
excludes conventional residential and
commercial PV, where PV modules are
installed on top of conventional roof
material.

SETO Multi-Year Program Plan
32
We study new system designs, evaluate business
practices and business models, and conduct analysis
to quantify and improve the benefits of the
colocation of solar facilities and other uses for both
industries and the local community. These mutual
benefits include sources of revenue, such as
electricity generation, grid services, crop production,
and livestock production. Some benefits are more
complex, including changes to water use, the
economic and ecological benefits of pollinator
habitat, interactions with birds, and interactions with
native plants.
Ensuring That Solar Energy Benefits All
Energy consumers who do not have access to
rooftop PV can still access the benefits of solar
energy. Community solar can offer reduced energy
burden to consumers for whom a rooftop PV system
is not possible or is not affordable. Residential
rooftop PV can be made more accessible through
alternative financing or ownership models.
Removing barriers to community solar
· Community solar can make low-cost distributed
solar energy available to homes and businesses
where rooftop solar is not a practical option. This
includes about half of all homes and businesses in
the U.S. [Feldman 2015]. It is possible for many
U.S. consumers to save money on electricity by
investing in a solar generation asset through a
subscription or partial ownership of a community
solar array. We provide networking, collaboration,
and technical assistance to stakeholders to expand
access to affordable community solar to every U.S.
energy consumer by 2025 and enable community
solar to provide meaningful benefits to energy
consumers, workers, employers, and communities.
Reducing financing costs · Low- and moderate-
income households, nonprofit organizations, local
governments, and tribal governments often cannot
access conventional low-cost financing and tax
incentives for solar projects. We fund research on
alternative financing models and the development of
new tools and methods to evaluate creditworthiness
and assess risk, as well as new mechanisms such as
short-term contracts for renters, flexible credit
agreements, and alternative financing qualification
metrics.
Goal · 100% of U.S. energy consumers can choose
residential solar or community solar that does not
increase their electricity costs
• We measure progress toward this goal by
tracking the national fraction of households
that have the option to participate in
community solar programs or to install
rooftop solar that does not increase
electricity costs. We evaluate the
affordability of projects by calculating their
net present value (NPV). Projects that do not
increase energy costs have zero or positive
NPV.
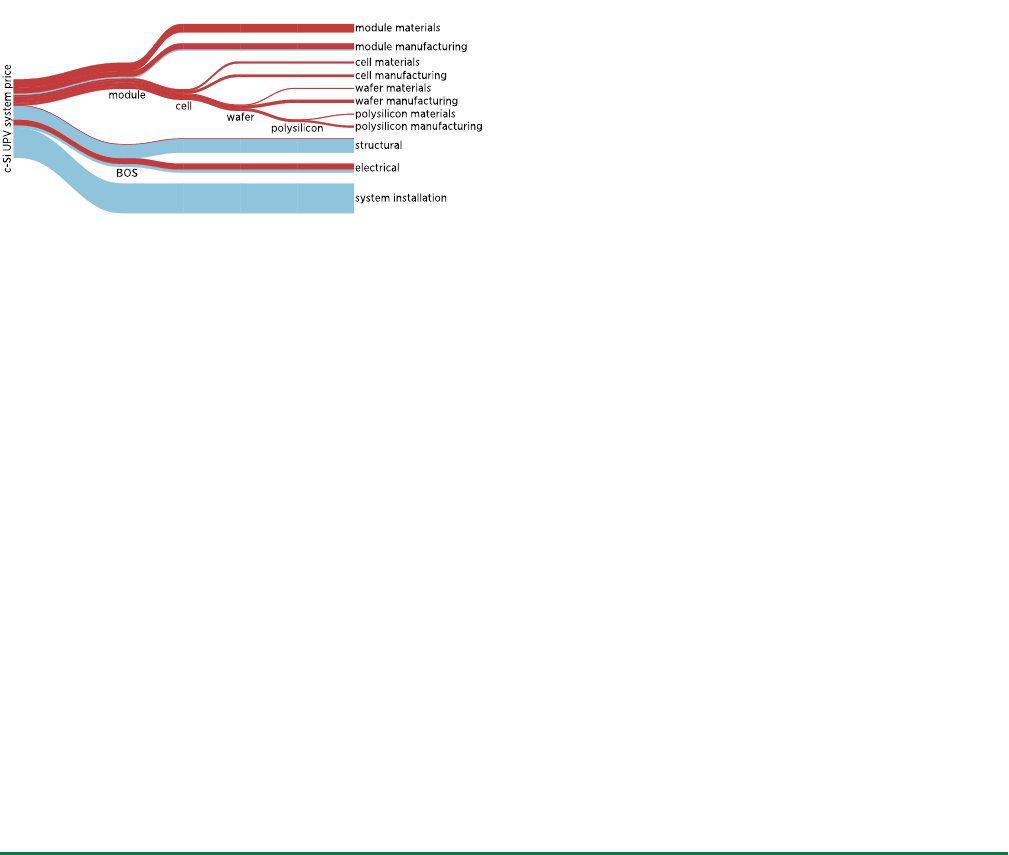
SETO Multi-Year Program Plan
33
Manufacturing and Competitiveness
Background
In 2019, about $9 billion were spent on PV hardware
in the United States. About $4 billion of this was
spent on domestic content and the balance on
imported content. Figure 11, below, shows how the
value of a typical c-Si utility-scale PV system in the
U.S. is distributed among its components, and the
proportion of domestic content in each component.
About 78% of the PV capacity installed in 2019 used
c-Si PV modules. The U.S. PV manufacturing
industry has the capacity to produce PV modules to
meet about half of today’s domestic demand
[WM USSMI 2019]. The module materials and
components are mostly imported content.
Figure 11. The value of a typical c-Si UPV system in the
United States, broken into its components
[Feldman 2021, Woodhouse 2020]. The thickness of
each line is proportional to its monetary value. “System
installation” includes all upfront system costs other
than module and BOS. Red indicates imported content,
and blue indicates domestic content.
Increasing domestic content in PV hardware will
keep more value in the U.S. economy and create
valuable manufacturing jobs. Manufacturers
consider many factors, including local costs and
incentives, when deciding where to site facilities
[Smith 2021]. For example, compared to most
locations with existing PV manufacturing industries,
labor costs are higher in the United States, but
electricity costs can be lower [Woodhouse 2020].
New technology could bring more efficient
manufacturing processes to the United States that
could cost-effectively compete with overseas
manufacturers. Reducing reliance on imported goods
also reduces cost uncertainty and sensitivity to
international supply chain disruptions. Emerging
concerns about cybersecurity may also be resolved
by using U.S.-made or -assembled hardware for
sensitive components such as power electronics.
Half of domestic hardware spending is on non-
module hardware: structural balance of system
products, including racking and trackers, and
electrical balance of system products, including
inverters, wiring, and combiner boxes
[Feldman 2020, Feldman 2020b, Feldman 2021,
WM USSMI 2019]. Most residential racking
installed domestically is made domestically. Many
of the trackers that are used in utility-scale PV
systems are American-made and some American-
made trackers are exported. While hundreds of
megawatts of domestic inverter assembly and
manufacturing exist, this meets only a fraction of
domestic demand. New PV system types, such as
those combined with agriculture or another land use,
could require new hardware that is best made
domestically.
The manufacturing and competitiveness budget area
supports the development and commercialization of
technology that can be manufactured in the U.S.,
creating jobs and producing local benefits from
energy investments. It also supports the
commercialization of technology that targets the
goals in the other budget areas and can support
growth of U.S. businesses. We work to transfer both
hardware and software technology into the
marketplace.

SETO Multi-Year Program Plan
34
Goals
Low-cost electricity
Lowering the costs of electricity from PV
Goal · Levelized cost of energy (LCOE) is less
than $0.03/kWh in utility-scale PV systems (PV,
SC, MC)
Rapid deployment
Growing the U.S. solar industry
Goal · 1 GW/year of new U.S. PV manufacturing
capacity is based on technology that was not
yet commercialized in 2020 (MC)
Goal · The solar hardware installed in the United
States has at least 40% domestic value (MC)
Opening new markets
Goal · 1 GW
AC
of PV installed in 2025 is
combined with another use, such as agriculture
or building surfaces (SC, MC)
Approach
Lowering the Cost of Energy from PV
Helping develop and commercialize products · We
support hardware and software products that can
reduce the cost of solar electricity. Domestically
made hardware, especially BOS hardware like racks
and trackers, can reduce shipping costs and delays.
Innovative software tools can reduce soft costs by
enabling faster and more efficient design, grid
integration, and operations and maintenance.
Goal · Levelized cost of energy (LCOE) is less than
$0.03/kWh in utility-scale PV systems
• The goal is reached when a bottom-up cost
model shows that unsubsidized LCOE has
reached the target. This goal is shared with
the PV and SC budget areas.
Supporting the U.S. Solar Industry
Achieving large-scale domestic
manufacturing · Domestic manufacturing of solar
hardware creates jobs, produces ancillary economic
activity, and promotes clean energy security. Where
there is an opportunity to do manufacturing in the
US, we aim to maximize it. Establishing the capacity
to manufacture 1 GW/year of a new PV technology
requires mature, scalable manufacturing techniques
that are beyond the scope of small pilot lines. This
scale may be able to produce PV modules that are
cost-competitive with established PV technologies.
Production at the gigawatt scale delivers higher
return on federal investment compared to smaller
manufacturing projects and serves as the starting
point for a vibrant industrial ecosystem. U.S.
industry that can reach this scale quickly may realize
a first-mover advantage in a new technology. Such
rapid innovation and scaling are minimum
qualifications for competitiveness in the global PV
industry and set up a fast feedback loop between
R&D and production. Focusing effort on new
technology promotes global leadership in science
and technology.
We support proof-of-concept development,
technology validation, and technology transfer of
new solar technologies. We also advance entirely
new technologies and processes. We also work to
connect entrepreneurs with the contacts that can help
them secure follow-on capital and incentives. We
provide financial assistance for innovative solar
hardware development and validation. We ask
awardees to plan for domestic manufacturing at an
early stage. And we form networks and
communities, such as the American-Made Network,
to support awardees in achieving more rapid
innovation cycles. We rely on the private sector to
undertake pilot manufacturing and scaling up to
prepare for market entry. The selection of a
manufacturing facility location depends on state and
local considerations and incentives.
Goal · 1 GW/year of new U.S. PV manufacturing
capacity is based on technology that was not yet
commercialized in 2020
• PV manufacturing capacity is the total
annual power rating of what factories can
produce. Our target is a domestic industry

SETO Multi-Year Program Plan
35
that makes 1 GW of products in 2025 using
new technology. New technology refers to
new absorber technology, such as perovskite
solar cells, or major modifications to
existing absorber technology. It also means
new combinations of absorbers, including
mainstream PV technologies (silicon and
CdTe) in tandem with another absorber.
Goal · The solar hardware installed in the United
States has at least 40% domestic value
• Solar hardware includes PV modules;
structural balance of system components,
including racks and trackers; electrical
balance of system components, including
inverters and combiners; and CSP collectors,
receivers, and power blocks. Domestic value
is calculated based on the country of origin
for materials and the country of
transformation for manufacturing, as
illustrated in the hardware portions of
Figure 11.
Opening New Markets
Dual-use PV · Established PV markets may not be
enough to meet the Nation’s renewable energy
targets. We support domestically made products that
can open new markets, including emerging PV
system types such as agricultural and building-
integrated PV. These markets will require different
hardware, including special PV cells, PV modules,
mounting, tracking, or other balance-of-system
components. Special markets like these may be
underserved by the global PV market, so are of
particular interest for domestic manufacturing.
Goal · 1 GW
AC
of PV installed in 2025 is combined
with another use, such as agriculture or building
surfaces
• Dual use includes PV and agriculture
colocation, BIPV, and floating PV. It
excludes conventional residential and
commercial PV, where PV modules are
installed on top of conventional roof
material.
Analysis
We set our strategy using an analytical foundation.
We make key parts of our analysis available to the
industry and research communities. Before investing
in R&D, we collect data; create baseline benchmarks
and tools; prioritize the remaining challenges; and
identify research areas that can have the greatest
impact. We track progress toward resolving these
challenges by updating our benchmarks.
Data · We aggregate data about the performance and
cost of solar technology and the status of the solar
industry. There is often no single source of similar
data, which we often make available in public
reports, presentations, and databases. Examples
include the actual characteristics and installed costs
of PV systems [Bolinger 2019, Barbose 2019], the
time required for solar permitting
[O’Shaughnessy 2020], and the status of U.S. the
solar industry [Feldman 2020b].
Baseline benchmarks · Baseline benchmarks
represent the state of the art in the relevant industries
and in the research enterprise. One example is the
PV system cost benchmark, which makes a detailed
bottom-up calculation of the upfront system cost and
levelized cost of energy for PV systems in the main
industry sectors [Feldman 2021]. The benchmark
also includes the cost of adding storage to a PV
system in various configurations. Our office, the
solar industry, and the solar research enterprise rely
on the benchmark as an analytical basis for
prioritizing R&D.
Analysis tools · Where appropriate, we introduce
public tools that embody our data and benchmarks.
For example, the NREL System Advisor Model
[Blair 2018] and the Comparative PV LCOE
Calculator [Silverman 2018] allow users to compute
the economic benefits of potential technology
advances.
Setting priorities · Based on data, baseline
benchmarks, and analysis tools, we choose priorities
with the greatest potential to meet our statutory
objectives. Where a coordinated system of advances

SETO Multi-Year Program Plan
36
is required, we publish formal roadmaps to organize
our priorities. We fulfill these priorities using a mix
of risk and technology maturity levels, as described
in Office Overview, above.
Tracking progress · We continually update the data
and benchmarks described above, tracking progress
toward our goals. Combined with the Program
Evaluation approach described below, these updates
provide a closed feedback loop that ensures our
research strategy remains relevant and effective.
Program Evaluation
We aim to maximize the national benefits from
taxpayer investments in solar R&D. We measure our
success by evaluating the performance of our funded
projects and our office.
We use data to measure our eecveness. These
data include:
• the definition of funding initiatives (purpose
and goals),
• the basis for funding decisions (merit
reviews and selection criteria),
• active program management (project
reviews and reporting), and
• project outcomes (publications, patents, and
students).
We evaluate the effectiveness of funding initiatives
through logic models, merit reviews, active program
management (APM), and data analysis and
dissemination. Logic models describe the partners,
activities, target audiences, and outputs for
individual projects. These project outputs are linked
to short- and long-term outcomes for an entire
funding initiative. In accordance with DOE
guidelines for financial assistance, subject matter
experts conduct merit reviews on applications we
receive. We follow EERE Active Project
Management (APM) guidelines, including technical
milestones, “go/no-go” decision points, and annual
site visits for funded projects. We collect and
analyze data from these activities to determine
historical trends and measure the effectiveness of
practices like concept paper review and in-person
merit review.
SETO evaluates the outcomes from our funding
initiatives using bibliometric analysis, measuring
scientific and technological impact beyond
publications and patents, and measuring the impact
of SETO programs on solar workforce development.
We continually revise our metrics and analytical
approaches based on the needs of specific funding
opportunities. Prize competitions have become
increasingly important to our work. We study ways

SETO Multi-Year Program Plan
37
to evaluate the outcomes of prize competitions with
the same rigor that we apply to cooperative funding
agreements.
In accordance with EERE guidelines, SETO
conducts a comprehensive peer review evaluation of
all actively funded projects about every two years.
The peer review process looks beyond the quality of
individual projects and assesses the effectiveness of
the entire program.
Statutory Authority
The SETO program is defined in the Energy Policy
Act of 2005 [EPAct 2005], the Energy Independence
and Security Act of 2007 [EISA 2007], and the
Energy Act of 2020 [EAct 2020].
The renewable energy programs, including the solar
energy program, “shall take into consideration the
following objectives:
• Increasing the conversion efficiency of all
forms of renewable energy through
improved technologies.
• Decreasing the cost of renewable energy
generation and delivery.
• Promoting the diversity of the energy
supply.
• Decreasing the dependence of the United
States on foreign energy supplies.
• Improving United States energy security.
• Decreasing the environmental impact of
energy-related activities.
• Increasing the export of renewable
generation equipment from the United
States.” [EPAct 2005]
The solar energy program includes “research,
development, demonstration, and commercial
application for solar energy, including—
• photovoltaics;
• solar hot water and solar space heating;
• concentrating solar-thermal power;
• lighting systems that integrate sunlight and
electrical lighting in complement to each
other in common lighting fixtures for the
purpose of improving energy efficiency;
• manufacturability of low-cost, high-quality
solar systems; and
• development of products that can be easily
integrated into new and existing buildings.”
[EPAct 2005]
The purposes of the solar energy program are:

SETO Multi-Year Program Plan
38
• “To improve the energy efficiency, cost
effectiveness, reliability, resilience, security,
siting, integration, manufacturability,
installation, decommissioning, and
recyclability of solar energy technologies.
• To optimize the performance and operation
of solar energy components, cells, and
systems, and enabling technologies,
including through the development of new
materials, hardware, and software.
• To optimize the design and adaptability of
solar energy systems to the broadest
practical range of geographic and
atmospheric conditions.
• To support the integration of solar energy
technologies with the electric grid and
complementary energy technologies.
• To create and improve the conversion of
solar energy to other useful forms of energy
or other products.
• To reduce the cost, risk, and other potential
negative impacts across the lifespan of solar
energy technologies, including
manufacturing, siting, permitting,
installation, operations, maintenance,
decommissioning, and recycling.
• To reduce and mitigate potential life cycle
negative impacts of solar energy
technologies on human communities,
wildlife, and wildlife habitats.
• To address barriers to the commercialization
and export of solar energy technologies.
• To support the domestic solar industry,
workforce, and supply chain.” [EAct 2020]
The solar program’s subject areas include:
• advanced solar energy technologies
• solar energy technology siting, performance,
installation, operations, resilience, and
security
• integration of solar energy technologies with
the electric grid, other technologies, and
other applications,
• advanced solar energy manufacturing
technologies and practices,
• methods to improve the lifetime,
maintenance, decommissioning, recycling,
reuse, and sustainability of solar energy
components and systems,
• solar energy forecasting, modeling, and
atmospheric measurement systems,
including for small-scale, large-scale, and
aggregated systems,
• integrated solar energy systems that
incorporate diverse generation sources,
loads, and storage technologies
• reducing market barriers, including
nonhardware and information-based
barriers, to the adoption of solar energy
technologies,
• and transformational technologies for
harnessing solar energy. [EAct 2020]
There is additional specific authorization for
research in thermal energy storage for concentrating
solar power plants; curriculum development and
certification for the solar energy workforce; and
demonstration of advanced photovoltaic technology
in coordination with state governments. [EISA 2007]

SETO Multi-Year Program Plan
39
References
[Adeh 2019] E.H. Adeh et al. “Solar PV Power Potential is
Greatest Over Croplands,” Scientific Reports (2019).
https://www.nature.com/articles/s41598-019-47803-3
[AEMO 2019] Australian Energy Market Operator.
“Maintaining Power System Security with High Penetrations of
Wind and Solar Generation: International Insights for Australia”
(October 2019) https://www.aemo.com.au/-
/media/Files/Electricity/NEM/Security_and_Reliability/Future-
Energy-Systems/2019/AEMO-RIS-International-Review-Oct-
19.pdf
[Ardani 2018] K. Ardani, J.J. Cook, R. Fu, R. Margolis. “Cost-
Reduction Roadmap for Residential Solar Photovoltaics (PV),
2017–2030,” National Renewable Energy Laboratory (NREL)
Technical Report NREL/TP-6A20-70748 (January 2018).
https://www.nrel.gov/docs/fy18osti/70748.pdf
[Barbose 2019] G. Barbose and N. Darghouth. “Tracking the
Sun, 2019 Edition” (October 2019).
https://emp.lbl.gov/sites/default/files/tracking_the_sun_2019_re
port.pdf
[Barron-Gafford 2019] G.A. Barron-Gafford et al., “Agrivoltaics
provide mutual benefits across the food-energy-water nexus in
drylands,” Nature Sustainability (September 2019)
https://www.nature.com/articles/s41893-019-0364-5
[BetterGrids] DOE ARPA-E GRID DATA Data Repository:
BetterGrids, https://bettergrids.org/
[Birch 2018] A. Birch, “How to Halve the Cost of Residential
Solar in the US,” Greentech Media (January 2018).
https://www.greentechmedia.com/articles/read/how-to-halve-
the-cost-of-residential-solar-in-the-us
[Bivens 2019] J. Bivens. “Updated Employment Multipliers for
the U.S. Economy” (January 2019).
https://www.epi.org/publication/updated-employment-
multipliers-for-the-u-s-economy/
[Blair 2018] N. Blair et al., “System Advisor Model (SAM)
General Description,” NREL Technical Report NREL/TP-6A20-
70414 (May 2018).
https://www.nrel.gov/docs/fy18osti/70414.pdf
[Bolinger 2019] M. Bolinger, J. Seel, D. Robson. “Utility-Scale
Solar, 2019 Edition” (December 2019).
https://emp.lbl.gov/sites/default/files/lbnl_utility_scale_solar_20
19_edition_final.pdf
[Burkes 2017] K. Burkes, J. Cordaro, T. Keister, and K. Cheung.
“Solid State Power Substation Roadmap” (December 2017).
https://www.energy.gov/sites/prod/files/2018/03/f49/SSPS%20
Roadmap%20Draft%20-%20Public.pdf.
[Burkhardt 2015] J. Burkhardt et al. “Exploring the impact of
permitting and local regulatory processes on residential solar
prices in the United States,” Energy Policy (March 2015).
https://www.sciencedirect.com/science/article/pii/S0301421514
006855
[CAISO 2016] California ISO. “What the Duck Curve Tells Us
about Managing a Green Grid” (2016).
https://www.caiso.com/Documents/FlexibleResourcesHelpRene
wables_FastFacts.pdf
[CAISO 2019] California ISO. “Renewables and Emissions
Reports” (2019).
http://www.caiso.com/market/Pages/ReportsBulletins/Renewabl
esReporting.aspx
[CAISO 2020] California ISO. “Monthly Renewables
Performance Report” (April 2020).
http://www.caiso.com/Documents/MonthlyRenewablesPerforma
nceReport-Apr2020.html
[Cole 2018] W. Cole et al. “Envisioning a low-cost solar future:
Exploring the potential impact of achieving the SunShot 2030
targets for photovoltaics,” Energy (2018).
https://www.sciencedirect.com/science/article/pii/S0360544218
307898
[Cole 2019] W. Cole et al. “2019 Standard Scenarios Report: A
U.S. Electricity Sector Outlook,” NREL Technical Report
NREL/TP-6A20-74110 (December 2019).
https://www.nrel.gov/docs/fy20osti/74110.pdf
[CPUC 2020] California Public Utilities Commission (CPUC),
“Energy Storage”.
https://www.cpuc.ca.gov/General.aspx?id=3462
[Denholm 2014] P. Denholm et al. “Methods for Analyzing the
Benefits and Costs of Distributed Photovoltaic Generation to the
U.S. Electric Utility System,” NREL Technical Report
NREL/TP-6A20-62447 (September 2014).
https://www.nrel.gov/docs/fy14osti/62447.pdf
[Denholm 2021] P. Denholm et al. “Storage Futures Study: The
Four Phases of Storage Deployment: A Framework for the
Expanding Role of Storage in the U.S. Power System,” NREL
Technical Report NREL/TP-6A20-77480 (2021).
https://www.nrel.gov/docs/fy21osti/77480.pdf
[DR POWER] DOE ARPA-E GRID DATA Data Repository:
DR POWER, https://egriddata.org/
[EIA 2018] US Energy Information Administration (EIA),
“How many smart meters are installed in the United States, and
who has them?” 2018.
https://www.eia.gov/tools/faqs/faq.php?id=108&t=3
[EIA-860 2020] Energy Information Administration. Form EIA-
860, 2019 early release (2020).
https://www.eia.gov/electricity/data/eia860
[EIA AEO 2020] Energy Information Administration. “Annual
Energy Outlook 2020” (January 2020).
https://www.eia.gov/outlooks/aeo/pdf/AEO2020%20Full%20Re
port.pdf
[EIA AEO 2021] Energy Information Administration. “Annual
Energy Outlook 2021” (February 2021).
https://www.eia.gov/outlooks/aeo/pdf/AEO_Narrative_2021.pdf
[EIA EPM 2020] Energy Information Administration. “Electric
Power Monthly” (April 2020).
https://www.eia.gov/electricity/monthly/current_month/epm.pdf

SETO Multi-Year Program Plan
40
[EIA EPM 2021] Energy Information Administration. “Electric
Power Monthly” (March 2021).
https://www.eia.gov/electricity/monthly/current_month/epm.pdf
[EIA MECS 2014] Energy Information Administration.
“Manufacturing Energy Consumption Survey” (2014).
https://www.eia.gov/consumption/manufacturing/
[EIA MER 2021] Energy Information Administration. “Monthly
Energy Review” (January 2021).
https://www.eia.gov/totalenergy/data/monthly/
[EIA OpenData] Energy Information Administration. Open Data
API, derived from EBA.CISO-ALL.NG.SUN.H, EBA.CISO-
ALL.NG.WND.H, EBA.CISO-ALL.D.H, EBA.CISO-
ALL.NG.H, ELEC.GEN.SUN-CA-99.M, and ELEC.GEN.DPV-
CA-99.M (June 2020). https://www.eia.gov/opendata/
[EirGrid 2019] EirGrid. System and Renewable Summary
Report (2019). http://www.eirgridgroup.com/how-the-grid-
works/renewables/
[EPA 2020] United States Environmental Protection Agency,
“Inventory of U.S. Greenhouse Gas Emissions and Sinks” (April
2020). https://www.epa.gov/ghgemissions/inventory-us-
greenhouse-gas-emissions-and-sinks
[EPA 2020b] Environmental Protection Agency, “Advancing
Sustainable Materials Management: Assessing Trends in
Materials Generation and Management in the United States”
(December 2020).
https://www.epa.gov/sites/production/files/2021-
01/documents/2018_tables_and_figures_dec_2020_fnl_508.pdf
[EPAct 2005] 42 U.S.C. § 16231 (2005)
https://www.congress.gov/109/plaws/publ58/PLAW-
109publ58.htm
[EISA 2007] 42 U.S.C. §§ 17171–17175 (2007)
https://www.congress.gov/110/plaws/publ140/PLAW-
110publ140.htm
[EAct 2020] Pub.L. 116-260 Division Z (2021)
https://www.congress.gov/116/bills/hr133/BILLS-
116hr133enr.pdf
[ERCOT 2020] Electric Reliability Council of Texas. 2019 Fact
Sheet (January 2020).
http://www.ercot.com/content/wcm/lists/197391/ERCOT_Fact_
Sheet_1.15.20.pdf
[ESGC 2020] U.S. DOE. “U.S. Department of Energy Launches
Energy Storage Grand Challenge” (January 2020).
https://www.energy.gov/articles/us-department-energy-
launches-energy-storage-grand-challenge
[Feldman 2015] D. Feldman et al. “Shared Solar: Current
Landscape, Market Potential, and the Impact of Federal
Securities Regulation,” NREL Technical Report NREL/TP-
6A20-63892 (April 2015).
https://www.nrel.gov/docs/fy15osti/63892.pdf
[Feldman 2020] D. Feldman and R. Margolis. “Q4 2019/Q1
2020 Solar Industry Update,” NREL Presentation NREL/PR-
6A20-77010 (May 2020).
https://www.nrel.gov/docs/fy20osti/77010.pdf
[Feldman 2020b] D. Feldman and R. Margolis. “Q1/Q2 2020
Solar Industry Update,” NREL Presentation NREL/PR-6A20-
77772 (September 2020).
https://www.nrel.gov/docs/fy20osti/77772.pdf
[Feldman 2021] D. Feldman et al. “U.S. Solar Photovoltaic
System and Energy Storage Cost Benchmark: Q1 2020” NREL
Technical Report NREL/TP-6A20-77324 (January 2021).
https://www.nrel.gov/docs/fy21osti/77324.pdf
[Fraunhofer 2020] Fraunhofer Institute for Solar Energy
Systems. “Photovoltaics Report” (June 2020).
https://www.ise.fraunhofer.de/content/dam/ise/de/documents/pu
blications/studies/Photovoltaics-Report.pdf
[GMI 2015] U.S. DOE. “Grid Modernization Multi-Year
Program Plan” (November 2015).
https://www.energy.gov/downloads/grid-modernization-multi-
year-program-plan-mypp
[GMLC 2020] DOE Grid Modernization Laboratory
Consortium. “Interconnection Seams Study” (2020).
https://www.nrel.gov/analysis/seams.html
[Golnas 2019] T. Golnas, “Solar Forecasting Benefits Extend
Beyond Grid Operators”, Energy Systems Integration Group,
June 26, 2019. https://www.esig.energy/solar-forecasting-
benefits-extend-beyond-grid-operators
[Green 2019] I. Green, “NERC SPIDER DER_A Modeling
Guideline”, NERC SPIDER WG Meeting, April 2019.
https://www.nerc.com/comm/PC/System%20Planning%20Impa
cts%20from%20Distributed%20Energy%20Re/Modeling-
DER_Modeling_Guideline_IG.pdf
[Gross 2020] S. Gross, “Renewables, land use, and local
opposition in the United States,” Brookings Institution Report,
January 2020. https://www.brookings.edu/wp-
content/uploads/2020/01/FP_20200113_renewables_land_use_l
ocal_opposition_gross.pdf
[GTM 2016] GTM Research, “U.S. Community Solar Market
Outlook: 2015–2020” (July 2016).
https://www.woodmac.com/reports/power-markets-u-s-
community-solar-market-outlook-2015-2020-58115487
[Hartmann 2019] H.M. Hartmann and E.M. White,
“Compensatory Mitigation and Comprehensive Mitigation
Planning for Solar Energy Development in the United States,”
Argonne National Laboratory report ANL/EVS-19/1 (March
2019). https://publications.anl.gov/anlpubs/2019/05/152670.pdf
[HECO 2019] Hawaiian Electric. Power Facts (November
2019).
https://www.hawaiianelectric.com/documents/about_us/compan
y_facts/power_facts.pdf
[Horowitz 2020] K. Horowitz et al. “Capital Costs for Dual-Use
Photovoltaic Installations: 2020 Benchmark for Ground-
Mounted PV Systems with Pollinator-Friendly Vegetation,
Grazing, and Crops,” NREL Technical Report NREL/TP-6A20-
77811 (January 2020).
[IEEE 2018] “Synchronized Waveform Measurement System
Panel”, IEEE Power and Energy Society General Meeting 2018,
Portland, OR, August 2018.

SETO Multi-Year Program Plan
41
[Isik 2018] C. K. Isik et al. “Wide Band-Gap Semiconductor
Based Power Electronics for Energy Efficiency”, US
Department of Energy Advanced Research Program Agency –
Energy (ARPA-E), March 2018. https://arpa-
e.energy.gov/sites/default/files/documents/files/ARPA-
E_Power_Electronics_Paper-April2018.pdf
[Johnson 2014] B. Johnson et al. “Synchronization of parallel
single-phase inverters using virtual oscillator control,” IEEE
Trans. Power Electron., November 2014.
https://ieeexplore.ieee.org/abstract/document/6692879/
[Kirby 2019] N. Kirby, “Current trends in dc: Voltage-source
converters,” IEEE Power Energy Mag., 2019.
https://ieeexplore.ieee.org/abstract/document/8694095
[Kurup 2019] P. Kurup and C. Turchi. “Initial Investigation into
the Potential of CSP Industrial Process Heat for the Southwest
United States,” NREL Technical Report NREL/TP-6A20-64709
(November 2015).
https://www.nrel.gov/docs/fy16osti/64709.pdf
[Larson 2020] E. Larson et al. “Net-Zero America: Potential
Pathways, Infrastructure, and Impacts”, Princeton University
(December 2020).
https://environmenthalfcentury.princeton.edu/sites/g/files/toruqf
331/files/2020-
12/Princeton_NZA_Interim_Report_15_Dec_2020_FINAL.pdf
[Lazard 2020] Lazard. “Lazard’s Levelized Cost of Energy
Analysis,” Version 14.0 (October 2020).
https://www.lazard.com/media/451419/lazards-levelized-cost-
of-energy-version-140.pdf
[Matevosyan 2019] J. Matevosyan et al., “Grid-Forming
Inverters: Are They the Key for High Renewable Penetration?”
IEEE Power and Energy Magazine, November/December 2019.
https://ieeexplore.ieee.org/document/8879610
[Matevosyan 2020] J. Matevosyan, “Inertia Trends in ERCOT,”
Feb. 25, 2020. https://www.esig.energy/inertia-trends-in-ercot/
[Mehos 2017] M. Mehos et al. “Concentrating Solar Power
Gen3 Demonstration Roadmap” (January 2017).
https://www.nrel.gov/docs/fy17osti/67464.pdf
[Mills 2012] A. Mills and R. Wiser. “Changes in the Economic
Value of Variable Generation at High Penetration Levels: A
Pilot Case Study of California” (June 2012).
https://emp.lbl.gov/sites/all/files/lbnl-5445e.pdf
[Murphy 2019] C. Murphy et al. “The Potential Role of
Concentrating Solar Power within the Context of DOE’s 2030
Solar Cost Targets,” NREL Technical Report NREL/TP-6A20-
71912 (January 2019).
https://www.nrel.gov/docs/fy19osti/71912.pdf
[NERC 2017a] North American Electricity Reliability
Corporation (NERC), “State of Reliability 2017”, Atlanta, GA,
June 2017.
https://www.nerc.com/pa/RAPA/PA/Performance%20Analysis
%20DL/SOR_2017_MASTER_20170613.pdf
[NERC 2017b] North American Electric Reliability Corporation
(NERC), “1,200 MW Fault Induced Solar Photovoltaic
Resource Interruption Disturbance Report: Southern California
8/16/2016 Event”, June 2017.
https://www.nerc.com/pa/rrm/ea/1200_MW_Fault_Induced_Sol
ar_Photovoltaic_Resource_/1200_MW_Fault_Induced_Solar_P
hotovoltaic_Resource_Interruption_Final.pdf
[NERC 2018] North American Electric Reliability Corporation.
2018 Summer Reliability Assessment.
https://www.nerc.com/pa/RAPA/ra/Reliability%20Assessments
%20DL/NERC_SRA_05252018_Final.pdf
[NERC 2020] North American Electricity Reliability
Corporation, “Fast frequency response concepts and bulk power
system reliability needs,” March 2020.
https://www.nerc.com/comm/PC/InverterBased%20Resource%2
0Performance%20Task%20Force%20IRPT/Fast_Frequency_Re
sponse_Concepts_and_BPS_Reliability_Needs_White_Paper.pd
f
[NASPI 2017] North American Synchrophasor Initiative
(NASPI), “NASPI PMU Map”, March 2017.
https://naspi.org/node/749
[NIST 2018] NIST. Cybersecurity Framework (April 2018).
https://www.nist.gov/cyberframework/framework
[O’Shaughnessy 2019] E. O’Shaughnessy et al. “Addressing the
soft cost challenge in U.S. small-scale solar PV system pricing,”
Energy Policy (November 2019).
https://www.sciencedirect.com/science/article/pii/S0301421519
305439
[O’Shaughnessy 2020] E. O’Shaugnessy, G. Barbose, R. Wiser.
“Patience is a virtue: A data-driven analysis of rooftop solar PV
permitting timelines in the United States,” Energy Policy
(September 2020).
https://www.sciencedirect.com/science/article/pii/S0301421520
303517
[Quint 2019] R. Quint et al., “Transformation of the Grid: The
Impact of Distributed Energy Resources on Bulk Power
Systems”, IEEE Power and Energy Magazine,
November/December 2019.
[Phadke 2020] A. Phadke et al., “2035 the Report,” Goldman
School of Public Policy, University of California Berkeley (June
2020). http://www.2035report.com/wp-
content/uploads/2020/06/2035-Report.pdf
[Ren21 2019] REN21 Renewables Now. “Renewables 2019
Global Status Report” (May 2019). https://www.ren21.net/wp-
content/uploads/2019/05/gsr_2019_full_report_en.pdf
[RMI 2014] Rocky Mountain Institute, “Lessons from Australia:
Reducing Solar PV Costs Through Installation Labor
Efficiency,” 2014. https://rmi.org/wp-
content/uploads/2017/04/2014-11_RMI-
AustraliaSIMPLEBoSFinal.pdf
[Robles 2019] F. Robles, “Puerto Rico Spent 11 Months
Turning the Power Back On. They Finally Got to Her,” New
York Times, August 14, 2018.
https://www.nytimes.com/2018/08/14/us/puerto-rico-electricity-
power.html
[Rudnick 2017] H. Rudnick and L. Barroso. “Flexibility
Needed: Challenges for Future Energy Storage Systems,” IEEE
Power and Energy Magazine (September/October 2017).
https://ieeexplore.ieee.org/document/8011530/

SETO Multi-Year Program Plan
42
[SEIA COVID 2020] Solar Energy Industries Association.
“COVID-19 and the U.S. Solar Industry” (June 2020).
https://www.seia.org/sites/default/files/2020-06/2020-June-
SEIA-COVID-Factsheet.pdf
[Schoeneberger 2020] C. Schoeneberger et al. “Solar for
Industrial Process Heat: A review of Technologies, Analysis
Approaches, and Potential Applications in the United States”
Energy (September 2020).
https://www.sciencedirect.com/science/article/pii/S0360544220
311907
[SFS 2021] Solar Futures Study (in preparation).
[Silverman 2018] T.J. Silverman, M.G. Deceglie, K.A.
Horowitz. “NREL Comparative PV LCOE Calculator” (March
2018). http://pvlcoe.nrel.gov
[Smith 2019] B.L. Smith and R. Margolis. “Expanding the
Photovoltaic Supply Chain in the United States: Opportunities
and Challenges,” NREL Technical Report NREL/TP-6A20-
73363 (July 2019).
https://www.nrel.gov/docs/fy19osti/73363.pdf
[Smith 2021] B.L. Smith et al. “Solar Photovoltaic (PV)
Manufacturing Expansions in the United States, 2017–2019:
Motives, Challenges, Opportunities, and Policy Context,” NREL
Technical Report NREL/TP-6A20-74807 (April 2021).
[Solar Foundation 2020] The Solar Foundation. National Solar
Jobs Census 2019 (February 2020).
http://www.solarjobscensus.org
[SPP 2020] Southwest Power Pool. 2019 Annual Report (April
2020).
https://www.spp.org/documents/62057/2019%20annual%20repo
rt%2020200428%20web.pdf
[SPV 2020] SPV Market Research. “Photovoltaic Manufacturer
Capacity, Shipments, Price and Revenues 2019/2020” (April
2020).
[UCLA 2019] UCLA Luskin Center for Innovation. “Progress
Toward 100% Clean Energy in Cities and States Across the
U.S.” (November 2019). https://innovation.luskin.ucla.edu/wp-
content/uploads/2019/11/100-Clean-Energy-Progress-Report-
UCLA-2.pdf
[Wiser 2020] R.H. Wiser, M. Bolinger, J. Seel. “Benchmarking
Utility-Scale PV Operational Expenses and Project Lifetimes:
Results from a Survey of U.S. Solar Industry Professionals,”
Lawrence Berkeley National Laboratory Technical Brief (July
2020).
https://escholarship.org/content/qt2pd8608q/qt2pd8608q.pdf
[Woodhouse 2020] M. Woodhouse, B. Smith, A. Ramdas, and
R. Margolis. “Crystalline Silicon Photovoltaic Module
Manufacturing Costs and Sustainable Pricing: 1H 2018
Benchmark and Cost Reduction Road Map,” NREL Technical
Report NREL/TP-6A20-72134 (February 2020).
https://www.nrel.gov/docs/fy19osti/72134.pdf
[WM 2021] Wood Mackenzie. “U.S. Solar Market Insight 2020
Year in Review” (March 2021).
https://www.woodmac.com/reports/power-markets-u-s-solar-
market-insight-2020-year-in-review-475325
[WM USSMI 2019] Wood Mackenzie. “U.S. solar market
insight” (March 2020).
https://www.woodmac.com/research/products/power-and-
renewables/us-solar-market-insight/
[WM GSPSP 2021] Wood Mackenzie. “Global solar PV system
price: country breakdowns and forecasts” (accessed April 2021).
https://power-and-
renewables.woodmac.com/reportaction/PNRT-253/Toc
[Zhong 2016] Q.-C. Zhong, “Virtual synchronous machines: A
unified interface for grid integration,” IEEE Power Electron.
Mag., December 2016.
https://ieeexplore.ieee.org/document/7790991

For more information, visit:
energy.gov/eere/solar
DOE/EE-2346 ▪ May 2021
