Fall 2023
Solar Industry Update
David Feldman
Krysta Dummit, BGS Contractor for SETO
Jarett Zuboy
Brittany Smith
Dana Stright
Matthew Heine
Robert Margolis
October 26, 2023

NREL | 2
Global Solar Deployment1
U.S. PV Deployment
2
PV System Pricing
3
Global Manufacturing
4
Component Pricing
5
U.S. PV Imports
6
7 PV Domestic Content
Agenda

NREL | 3NREL | 3
Global Solar Deployment
• H1 2023 PV installations increased significantly (y/y) in China (153%) and Germany
(102%), and to a lesser extent the United States (34%). Australian and Indian first PV
installations in H1 2023 shrank modestly, y/y.
U.S. PV Deployment
• EIA projects the percentage of U.S. electric capacity additions from solar will grow from
45% in 2022 (17 GW
ac
) to 56% in 2023 (31 GW
ac
) and 62% (41 GW
ac
) in 2024.
• The United States installed 11.2 GW
ac
(11.8 GW
dc
) of PV in H1 2023—its largest H1
ever—up 44% y/y.
• The United States installed approximately 7.7 GWh (2.5 GW
ac
) of energy storage onto
the electric grid in H1 2023, +32% (+8%) y/y, as a result of growth in all sectors.
PV System and Component Pricing
• U.S. PV system and PPA prices have been flat or increased over the past 2 years.
• Global polysilicon spot prices rose 35% from late June ($7.84/kg, below the weighted
average production cost of $8.2/kg) to early October ($10.55/kg).
• Global module prices reached yet another record low, falling 21% between late June and
early October to $0.14/W
dc
.
• In Q3 2023 (first 2 months), the average U.S. module price ($0.33/W
dc
) was down 11%
q/q and down 23% y/y, but at a 98% premium over the global spot price for monofacial
monocrystalline silicon modules.
Global Manufacturing
• According to Infolink (formerly PV Infolink), the top 10 module manufacturers were
responsible for 160 GW (+57% y/y) in H1 2023 and the top 5 cell manufacturers together
shipped 84 GW of cells (+49% y/y).
• Since the passage of the IRA, more than 240 GW of manufacturing capacity has been
announced across the solar supply chain, representing more than 22,000 potential jobs
and more than $12 billion in announced investments across 72 new facilities or
expansions.
• In H1 2023, the U.S. shipped 3.1 GW of PV modules – an increase of 0.8 GW from H1
2022.
U.S. PV Imports
• The United States imported 25.1 GW
dc
of PV modules in H1 2023, well over double
imports from H1 2022.
• Most panels imported were exempt from Section 201 duties and were therefore likely
bifacial. A significant number of thin-film modules were also imported.
• 1.5 GW
dc
of cells were imported in H1 2023, up 28% y/y.
• The U.S. is not on pace to reach the 5-GW quota exemption limit for Section 201 tariffs.
Executive Summary
A list of acronyms and abbreviations is available at the end of the presentation.

NREL | 4
Global Solar Deployment1
U.S. PV Deployment
2
PV System Pricing
3
Global Manufacturing
4
Component Pricing
5
U.S. PV Imports
6
7 PV Domestic Content
Agenda
• H1 2023 PV installations increased significantly (y/y) in
China (153%) and Germany (102%), and to a lesser extent
the United States (34%). Australian and Indian first PV
installations in H1 2023 shrank modestly, y/y.
• BloombergNEF estimates 2023 installations in China to be
around 200 GW, far exceeding last year’s record of 106
GW.
NREL | 5NREL | 5
0
5
10
15
20
25
30
35
40
2022 2023 2022 2023 2022 2023 2022 2023 2022 2023
U.S.
153 GW
India
70 GW
Australia
32 GW
Germany
74 GW
China
510 GW
Installations (GW
dc
)
H2
H1
International H1 2023
Installations
• H1 2023 PV installations increased
significantly (y/y) in China (153%) and
Germany (102%), and to a lesser extent the
United States (34%). Australian and Indian
PV installations shrank modestly in H1 2023,
y/y.
– BloombergNEF estimates Chinese 2023
PV installations to be around 200 GW,
far exceeding last year’s record of 106
GW.*
– JMK Research expects India to install 14–
15 GW in 2023 (compared to 17–18 GW
in 2022), and estimates the country had
a solar pipeline of 47 GW at the end of
June.
• At the end of June, these countries had
cumulatively installed 839 GW
dc
of PV.
106 GW
*China reported 87 GW of PV installations in 2022 and 78 GW in the first half of 2023; however, these
numbers reflect a combination of utility-scale projects reported in W
ac
and distributed PV reported in W
dc
.
IEA estimated Chinese 2022 installations to be 106 GW. Chinese values here reflect the same 2022 ILR.
Sources: Australian Photovoltaic Institute. Mercom (07/31/23, 08/28/23). PV Magazine (06/13/23;
08/28/23); Wood Mackenzie/SEIA: U.S. Solar Market Insight: Q2 2023.
Cumulative Capacity
95 GW

NREL | 6NREL | 6
Concentrating Solar Power
Update
• Chinese CSP company Cosin Solar currently has 100 MW of projects operational and another 900 MW under
construction, making it the first company to supply 1 GW of tower projects
.
• HeliosCSP interviewed an engineer who has been working on the 110-MW U.S. Crescent Dunes project—the first
large-scale, high-storage CSP plant, which began operation in 2015.
– Crescent Dunes is essentially recommissioning itself now, slowly bring the plant back online from several
repairs. ACS, a multinational EPC firm, indirectly purchased the plant from the original owner,
SolarReserve.
– It is currently selling power to NV Energy, which was originally under a PPA with the contract until the
project defaulted in 2019. They are selling electricity exclusively at night or when their storage tanks are
full.
– Reason for operational challenges: (1) The hot tanks were poorly designed the first time (for cost-cutting
reasons) and poorly welded when they were replaced. (The welders were not used to working with those
type of alloys, causing the tank to crack.) They’ve been installed now a third time. (2) One of the two
superheaters sat with water in it and rusted; it has yet to come online.
– These expenses are much less than the estimated $250M it would take to satisfy BLM requirements for
removing the plant (SolarReserve initially estimated it would cost $7M).

NREL | 7
Global Solar Deployment1
U.S. PV Deployment
2
PV System Pricing
3
Global Manufacturing
4
Component Pricing
5
U.S. PV Imports
6
7 PV Domestic Content
Agenda
• EIA projects the percentage of U.S. electric capacity
additions from solar will grow from 45% in 2022 (17 GW
ac
)
to 56% in 2023 (31 GW
ac
) and 62% (41 GW
ac
) in 2024.
• According to EIA data, the United States installed 11.2
GW
ac
of PV in H1 2023—its largest H1 ever—up 44% y/y
(SEIA reported 11.8 GW
dc
).
• The United States installed approximately 7.7 GWh (2.5
GW
ac
) of energy storage onto the electric grid in H1 2023,
+32% (+8%) y/y, as a result of growth in all sectors.
NREL | 8NREL | 8
States: Q2 2023 Updates
Sources: NJBPU (8/16/23); PV Magazine (8/7/23, 8/24/23, 8/28/23); PV Tech (8/18/23); RMI, State Climate Scorecards (2023); Utility Dive (8/8/23)
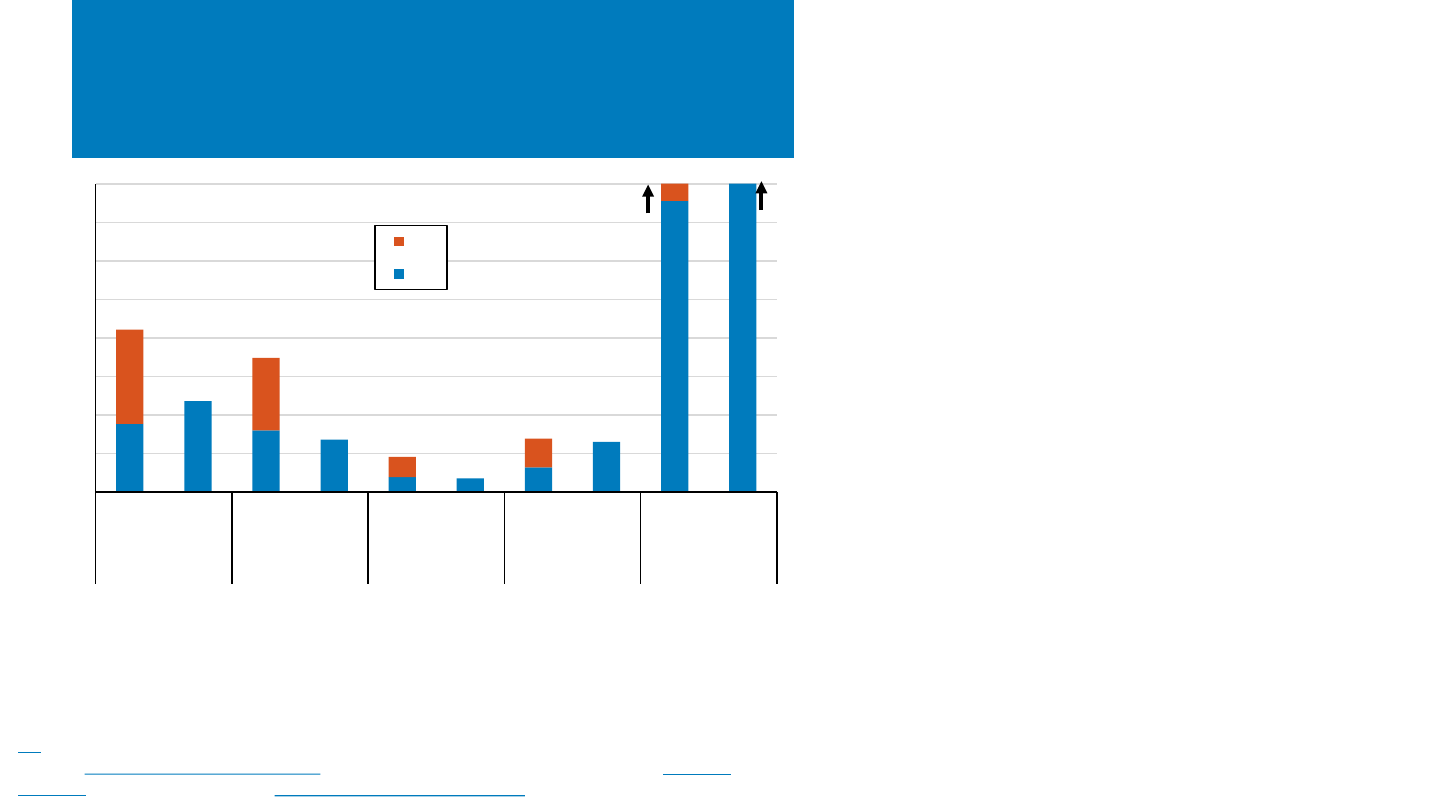
Map shows progress toward installed wind + PV capacity by 2030
compatible with the U.S. Nationally Determined Contribution (NDC) under
the Paris Agreement, as modeled by RMI. For example, if current policies
are successful, MA will achieve 92% of an NDC-compatible 9-GW wind + PV
target by 2030, while AZ will achieve only 21% of a 21-GW target. The gaps
are mostly PV in AZ and NJ and a mix of PV and wind in NY, MA, NC, OH.
Ohio required PV
installations >50 MW to
meet rules related to noise,
setbacks, and drilling safety.
New York increased low- and
moderate-income (LMI)
access to community solar
via pre-development grants
and technical assistance.
Projected share of NDC goal achieved in 2030
New Jersey made its pilot community solar program
permanent, with requirements including 51% LMI
subscribers and 15% minimum bill savings.
Arizona
reduced the
value of rooftop
PV energy
exports by 10%.
North Carolina will add 6 GW of PV and 2.7 GW of
energy storage by 2031 under Duke Energy’s updated
Carbon Plan and Integrated Resource Plan.
Boston, Massachusetts banned fossil fuel use
in new municipal building construction and
renovations. The city will require all buildings
to be wired for all-electric use starting 2024.

NREL | 9NREL | 9
Background
• Bottlenecks in interconnection queues are holding up
1,700 GW of clean power in the United States (mostly
solar and batteries).
• Interconnection approval times can take 3 years or more,
on average.
• The cost of interconnection upgrades is increasing.
– In 2017, more than one-third of systems in the
Midwest incurred no upgrade costs, and by 2021 it
had dropped to 11%.
• Solar projects in the U.S. pay on average $0.09/W,
according to BloombergNEF analysis, or about 8%–10% of
their total costs.
Source: BloombergNEF, “US Takes a Step to Clear Grid Backlog But a Leap Is Needed.”
0.00
0.05
0.10
0.15
0.20
0.25
2016 2017 2018 2019 2020 2021
$/W(AC)
Solar Wind
FERC Issues Order 2023
Average grid connection cost in PJM, MISO, and NYISO

NREL | 10NREL | 10
The new order includes several changes:
• Implements a first-ready, first-served cluster study process, in which project requests enter a “cluster window”
and all receive the same priority, allowing for a group interconnection study rather than sequentially.
– Cluster study costs imposed on a pro rata and per capita basis, and upgrade costs allocated to cluster on a
“proportional impact method.”
– BNEF stated that most grid operators already (or will soon) conduct joint grid connection studies, and it
will not necessarily reduce the combined cost of grid interconnection.
• Implements enhanced financial commitments and withdrawal penalties to discourage withdrawals and
requires demonstration of site control at the time of submission (or a deposit of $500k–$2M).
• Aims to increase the speed of the interconnection queue by removing the “reasonable efforts” standard
governing transmission provider’s duty for timely completion of studies and places firm study deadlines and
penalties for missing study deadlines ($1k per business day of delays to cluster studies / $2.5k for facilities
studies).
• Allows interconnection process to have one interconnection point (and study) for co-located facilities.
Source: JDSupra (08/11/23); The National Law Review (08/18/23)
FERC Issues Order 2023

NREL | 11NREL | 11
Impact
• Once implemented, FERC rules will improve and harmonize existing grid interconnection best practices but do not
represent disruptive, structural changes that may be necessary to install the levels of solar and wind necessary to
decarbonize the grid by 2035. Such measures may include:
– Reforms to the cost allocation of grid upgrades (e.g., in Texas, upgrades are borne by the consumer, not the project).
– Allowing interconnections ahead of all grid upgrades.
– A more proactive approach for grid planning that identifies areas with high wind and solar potential and preemptively
builds out system capacity in those regions.
• Many of the upgrades occur now as developers seek
interconnection.
– Permitting reform to significantly build out transmission assets.
BNEF states that current process has deterred lots of projects
that would help.
• After the order was issued, BNEF did not change its outlook on
U.S. solar and wind deployment, as it already assumed some level
of interconnection process improvements.
Source: BloombergNEF, “US Takes a Step to Clear Grid Backlog But a Leap Is Needed.”
0
20
40
60
80
100
120
140
160
2015 2020 2025 2030
$ billion
Historical
With IRA
Net Zero Scenario
Comparison of U.S. annual grid investment scenarios
FERC Issues Order 2023
NREL | 12NREL | 12
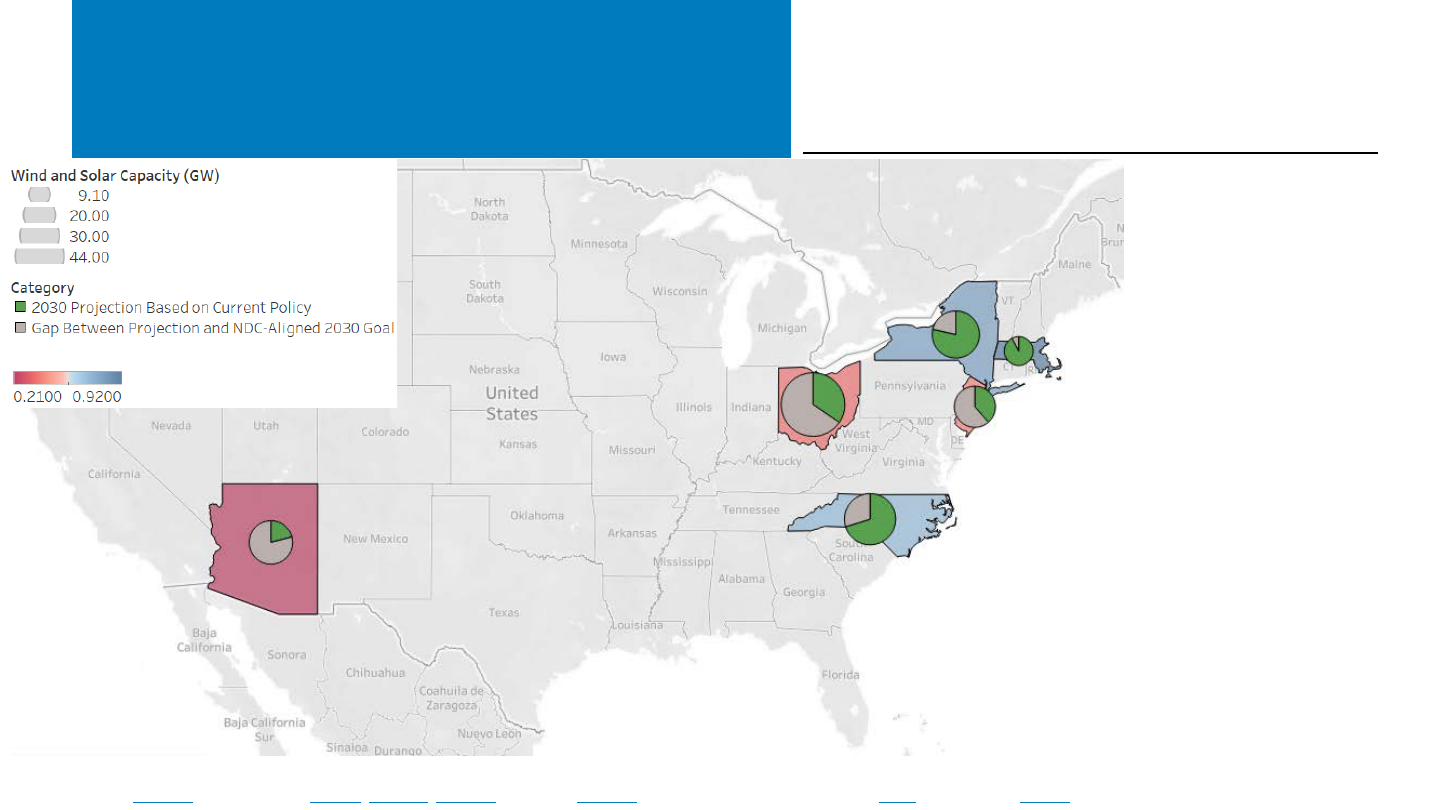
Planned U.S. Electric Generation Plants in
Relation to Energy Communities
• Since the passage of the Inflation Reduction
Act, which provides an additional 10% tax
credit for renewable energy projects located
in an “Energy Community”, a significant
amount of new planned renewable energy
projects have been announced.
• In September 2022, one month after the
passage of the Inflation Reduction Act, the
EIA tracked approximately 123 GW of planned
utility-scale PV, land-based wind, and battery
projects (of which 78 GW had not yet started
construction).
– Since then, 60 GW of new projects have
been added to the dataset, 38 GW of
which has not yet started construction.
Note: Brownfields, which are also eligible for the energy community bonus credit, do not have the same census tract delineations and so
are not included in this analysis.
Sources: U.S. Energy Information Administration (EIA), EIA Form 860 (November 2022, November 2023).
Planned U.S. Generation Capacity in Relation to Energy Communities, September 2023
Click here to interactively view
this data on Tableau Public.
NREL | 13NREL | 13
0%
10%
20%
30%
40%
50%
60%
70%
0
20
40
60
80
100
120
Planned (Sep.
2022)
Planned (Sep.
2023)
Planned (Sep.
2022)
Planned (Sep.
2023)
Planned (Sep.
2022)
Planned (Sep.
2023)
Solar Photovoltaic Batteries Land-based Wind
Capacity (GW)
Out of Energy Community
In Energy Community
% Capacity in Energy Community
% Capacity in Energy Community (new projects)
Percent of Planned Solar, Wind, and
Battery Markets Located in Energy
Communities
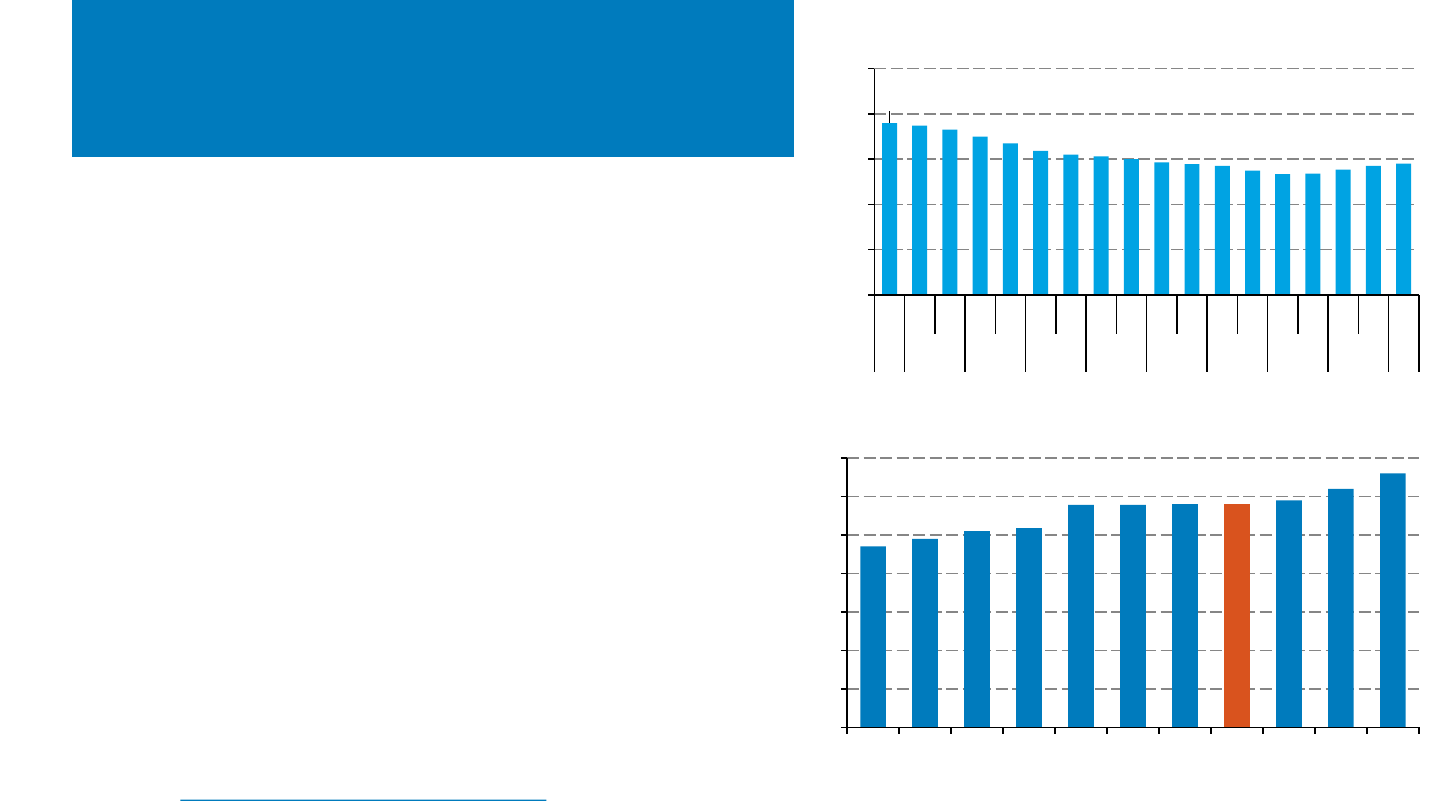
• NREL analysis found that new projects added to the planned
project dataset do not have a significantly higher percentage of
capacity located in energy communities as projects which were
in the dataset as of September 2022.
– This analysis also includes projects in construction, however
the results are very similar when only looking at new
projects which have not begun construction yet.
– The percentage of planned land-based wind capacity
located in energy communities increased the most (from
30% to 40%), however the number of projects located in
energy communities increased less dramatically (from 26%
to 30%) and was impacted by a few large projects.
– The percent of planned solar PV capacity in energy
communities is relatively consistent (if not lower) than the
percent of installed capacity in those areas from 2021
through July 2023 (see LBNL data on slide 20).
• It typically takes years to develop large electric generating assets
in the United States, therefore data may not show a significant
change in deployment in these communities for some time.
– Additionally, a relatively large percentage of projects were
already being developed in these areas.
– EIA data is also not necessarily added uniformly in terms of
project development and therefore is a better indicator of
long-term trends.
Note: based on EIA data, there were no new planned offshore wind projects announced between September 2022 and September 2023.
Additionally, the latitude and longitude of these projects reported in EIA Form 860 likely does not reflect the location in which these
projects will determine their eligibility (i.e., the point of interconnection).
Sources: U.S. Energy Information Administration (EIA), EIA Form 860 (November 2022, November 2023).
Added Planned
Projects
Planned Projects
Click here to interactively view
this data on Tableau Public.
NREL | 14NREL | 14
0
10
20
30
40
50
60
70
U.S. Generation Capacity Additions (GW
ac
)
Other
Nuclear
Natural Gas (Other)
Natural Gas CT
Natural Gas CC
Batteries
Wind
DPV
UPV
62%
U.S. Generation Capacity Additions by
Source: 2010–2022 and
Planned 2023–2024
Sources: EIA Form 860M/Preliminary Monthly Electric Generator Inventory (“Planned” and “Operating”) and EIA Short-Term Energy Outlook Table 7e,
downloaded October 6, 2023; Wood Mackenzie and SEIA US Solar Market Insight Full Report 2Q 2023, Sep 2023.
• EIA projects the percentage of U.S. electric
capacity additions from solar will grow from 45%
in 2022 (17 GW
ac
) to 56% in 2023 (31 GW
ac
), and
62% (41 GW
ac
) in 2024.
– Wind accounts for 14%, batteries 15%, and nuclear 2%
of projected capacity in 2023; in 2024 those
percentages are 9%, 19%, and 2%, respectively.
– Natural gas accounts for the remaining 14% in 2023.
• Over the next 2 years, EIA projects there will be
nearly 90 GW
ac
of capacity additions from wind
and solar alone.
• Wood Mackenzie/SEIA projects 32 GW
dc
of solar
installations in 2023 and 35 GW
dc
in 2024,
depending both on favorable supply chain
conditions (domestic and international) and on
the ability to optimize the Inflation Reduction Act
bonus credits.
– Over the next 5 years, Wood Mackenzie/SEIA projects
about 20 GW
dc
upside or downside relative to their
base case as a result of these factors.
Began operating
through July 2023
Planned August 2023
and full 2024
NREL | 15NREL | 15
U.S. Installation Breakdown
Quarterly: EIA (GW
ac
)
• According to EIA data, the United States installed 11.2 GW
ac
of PV in
H1 2023—its largest H1 ever—up 44% y/y (SEIA reported 11.8 GW
dc
).
– Residential (3.4 GW
ac
) remained up significantly in H1 2023, 45%
y/y, as was nonresidential (1.2 Gw
ac
—up 60%) and utility-scale
(6.6 GW
ac
—up 40%).
• 39% of U.S. PV capacity installed in H1 2023
was in Texas, Florida, and California.
– 23 states installed more than 100 MW
ac
in H1 2023.
Note: EIA reports values in W
ac
, which is standard for utilities. The solar industry has traditionally reported in W
dc
. See the next slide for values reported in W
dc
.
Sources: EIA, “Electric Power Monthly,” forms EIA-023, EIA-826, and EIA-861 (July 2023, February 2022, February 2019).
13.2
1.5
3.9
0
1
2
3
4
5
6
7
8
Q1 Q2 Q3 Q4 Q1 Q2 Q3 Q4 Q1 Q2 Q3 Q4 Q1 Q2 Q3 Q4 Q1 Q2 Q3 Q4 Q1 Q2 Q3 Q4 Q1 Q2
2017 2018 2019 2020 2021 2022 2023
Quarterly PV Installed (GWac)
U.S. PV Installations by Market Segment
Utility-scale
C&I
Residential
Texas
9%
Southwest
14%
Florida
17%
California
12%
Midwest
16%
Southeast
12%
Northeast
15%
Other
5%
H1 2023 U.S. PV Installations by Region
(11.2 GW
ac
)
Click here to interactively view
this data on Tableau Public.
NREL | 16NREL | 16
U.S. Installation Breakdown
Quarterly: SEIA (GW
dc
)
• Wood Mackenzie/SEIA reports a record first half of PV installations, with 11.8
GW
dc
installed in H1 2023—an increase of 34% y/y.
– Big growth occurred year over year in the residential and utility-scale
space, with Q2 residential installations hitting another record level of
deployment. SEIA reports that the growth comes despite uncertainties
that remain in receiving IRA benefits, higher interest rates, and challenges
with UFLPA compliance.
– Nonresidential installations were mostly flat, with SEIA citing continued
impacts of interconnection delays, supply chain constraints, and
uncertainty over IRA implementation.
• Installations typically fall after Q4 and this
Q1 was particularly large due to delays in
projects originally intended for a Q4
installation.
• Florida, California, and Texas continue to
lead installations, accounting for 46% of H1
2023 installations.
– However, 27 states installed more than
100 MW in the first half of the year.
Sources: Wood Mackenzie/SEIA: U.S. Solar Market Insight: Q3 2023.
Unlike the previous slide, these values are
in GW
dc
—not GW
ac
.
California
14%
Texas
11%
Southwest
15%
Florida
21%
Southeast
11%
Northeast
10%
Midwest
10%
Other
8%
H1 2023 U.S. PV Installations by Region
(11.8 GW
dc
)
0
2
4
6
8
10
Q1Q2Q3Q4Q1Q2Q3Q4Q1Q2Q3Q4Q1Q2Q3Q4Q1Q2Q3Q4Q1Q2Q3Q4Q1Q2
2017 2018 2019 2020 2021 2022 2023
Quarterly PV Installed (
GW
dc
)
U.S. PV Installations by Market Segment
Utility
Nonresidential PV
Residential PV
NREL | 17NREL | 17
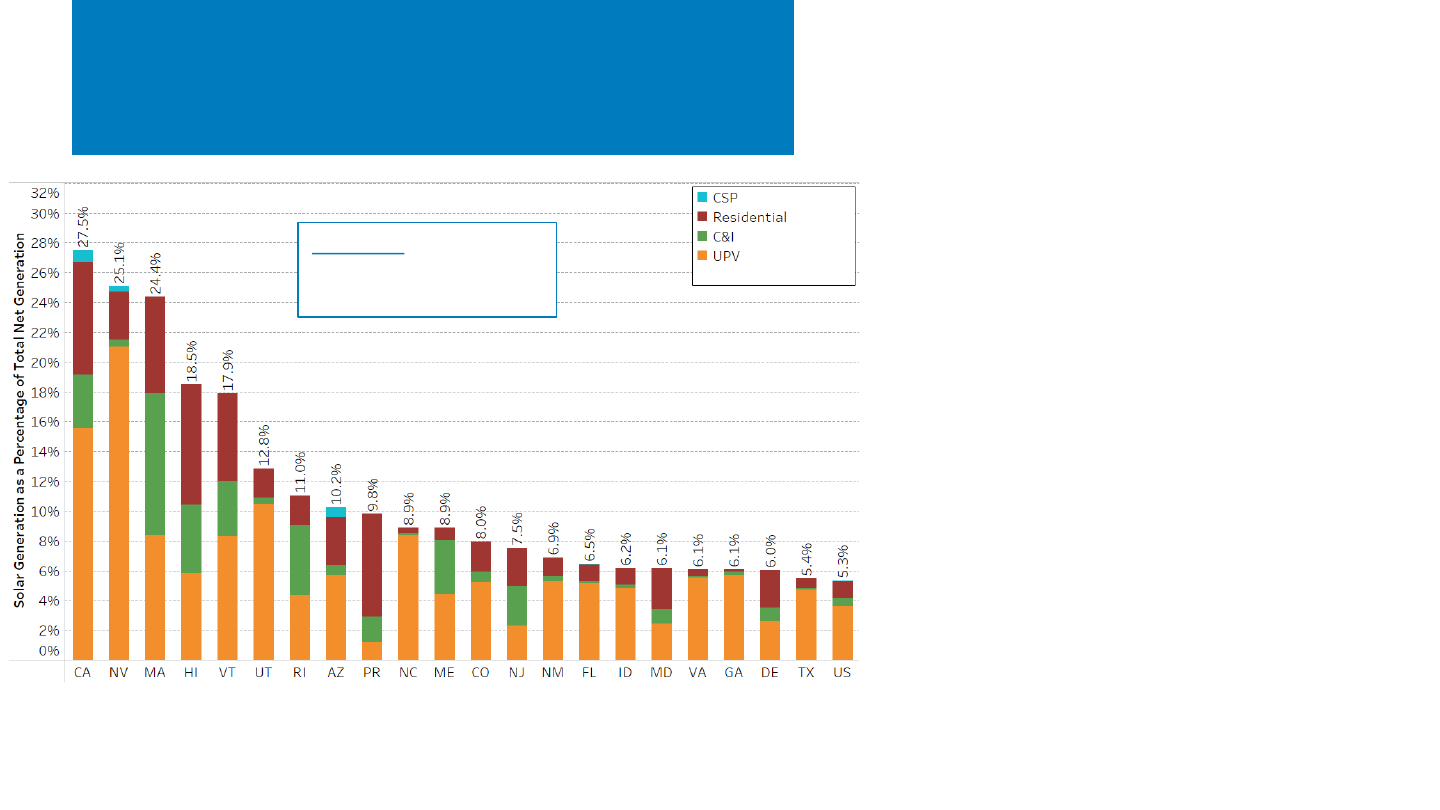
Solar Generation as a Percentage
of Total Generation, Q4 2022–Q3 2023
During the 1-year time span from Q4 2022 to Q3
2023, 20 states generated more than 5% of their
electricity from solar, with California leading the
way at 27.5%.
• Five states (California, Nevada, Massachusetts,
Hawaii, and Vermont) generated more than 15% of
their electricity using solar.
• Three other states generated more than 10% of their
electricity using solar: Utah, Rhode Island, Arizona.
• In calendar year 2022, solar generation was 4.1% in
Delaware, 4.3% Idaho, and 4.8% in Texas—all these
states broke the 5% barrier recently.
Nationally, 5.3% of electricity was generated from
solar—up from 4.8% during 2022.
The roles of utility and distributed solar vary by
state. Southern and Western states rely more on
utility-scale solar, while northern states and Hawaii
rely more on distributed solar.
Note: EIA monthly data for 2023 are not final. Additionally, smaller utilities report information to EIA on a yearly basis, and therefore a
certain amount of solar data has not yet been reported. “Net Generation” includes distributed PV generation. Net generation does not
take into account imports and exports to and from each state, and therefore the percentage of solar consumed in each state may vary
from its percentage of net generation.
*EIA does not estimate distributed PV production in Puerto Rico; utility-scale values derived from EIA Form 923 and distributed PV values
represent estimates based on capacity installations from EIA Form 861 and system production from PVWatts.
Source: U.S. Energy Information Administration (EIA), “Electricity Data Browser.” Accessed October 2023.
*
Click here to interactively
view this data on Tableau
Public.
NREL | 18NREL | 18
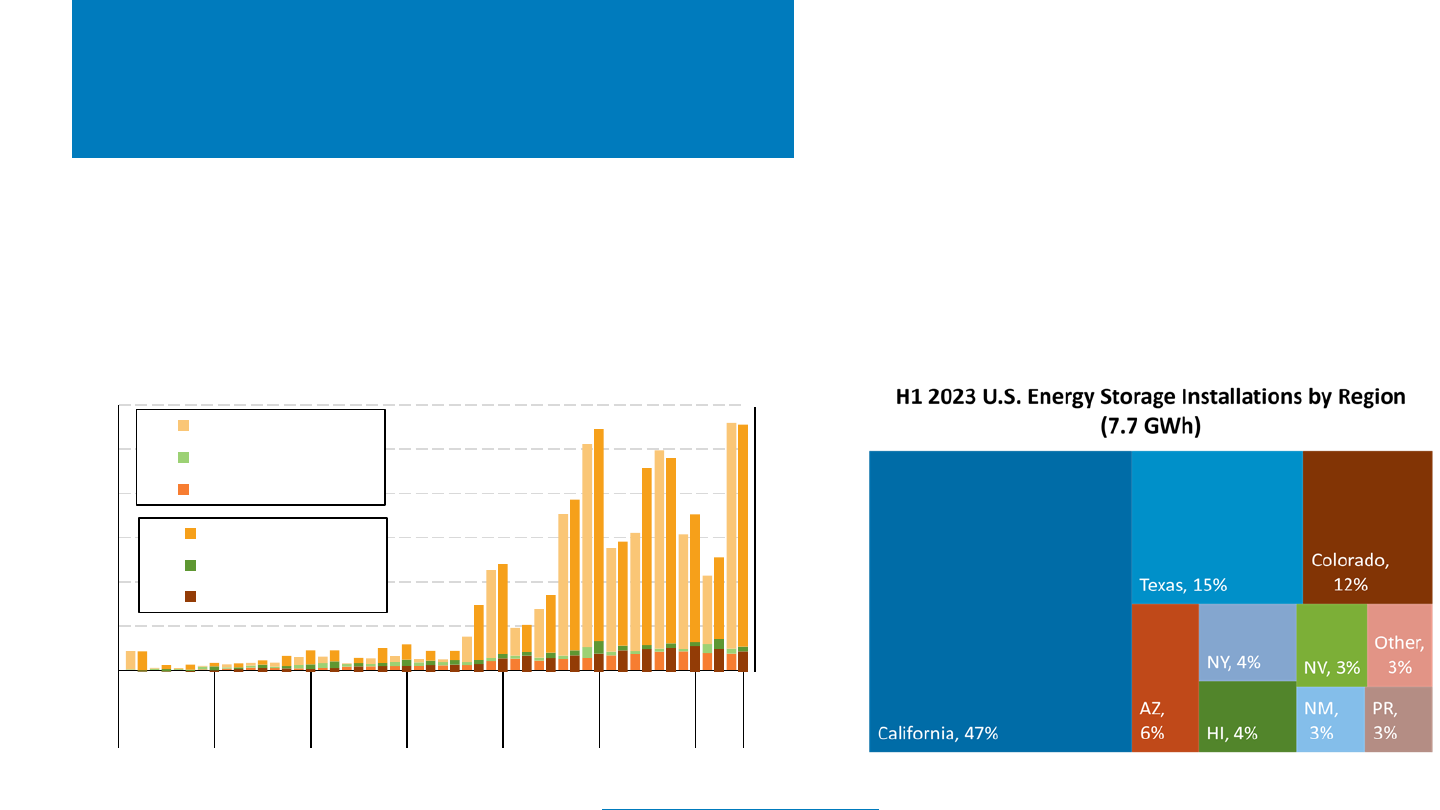
U.S. Energy Storage Installations by
Market Segment
• Wood Mackenzie reports that battery costs are declining from
their late 2022 peak; however, labor and balance of plant
costs are increasing.
– Lithium spot prices decreased, but transformer and inverter
costs continue to rise.
• California continues to lead in the residential and utility-scale
space, but other markets are developing as well, with 8 other
states/territories installing more than 100 MWh in H1 2023.
Colorado was the third-leading state thanks to two utility-scale
projects installed in H1 2023.
• The United States installed approximately 7.7 GWh (2.5 GW
ac
) of energy
storage onto the electric grid in H1 2023, +32% (+8%) y/y, as a result of
growth in all sectors.
– Q2 2023 installations were the highest on record, despite contractions in
the residential and CCI markets.
– In Q2 2023, California had its lowest residential storage installs since 2020.
Note: “Grid-scale” refers to all projects deployed on the utility side of the meter, regardless of size or ownership; “CCI” refers to “community-scale, commercial, and industrial.”
Source: Wood Mackenzie Power & Renewables and Energy Storage Association, U.S. Energy Storage Monitor: Q2 2023.
0
1,000
2,000
3,000
4,000
5,000
6,000
Q1Q2Q3Q4Q1Q2Q3Q4Q1Q2Q3Q4Q1Q2Q3Q4Q1Q2Q3Q4Q1Q2Q3Q4Q1Q2
2017 2018 2019 2020 2021 2022 2023
Energy Storage Installed (MWh)
U.S. Energy Storage Installations by Market Segment
Grid-Scale (MWh)
CCI (MWh)
Residential (MWh)
0
150
300
450
600
750
900
1,050
1,200
1,350
1,500
1,650
1,800
Energy Storage Installed (MW)
Grid-Scale (MW)
CCI (MW)
Residential (MW)
NREL | 19NREL | 19
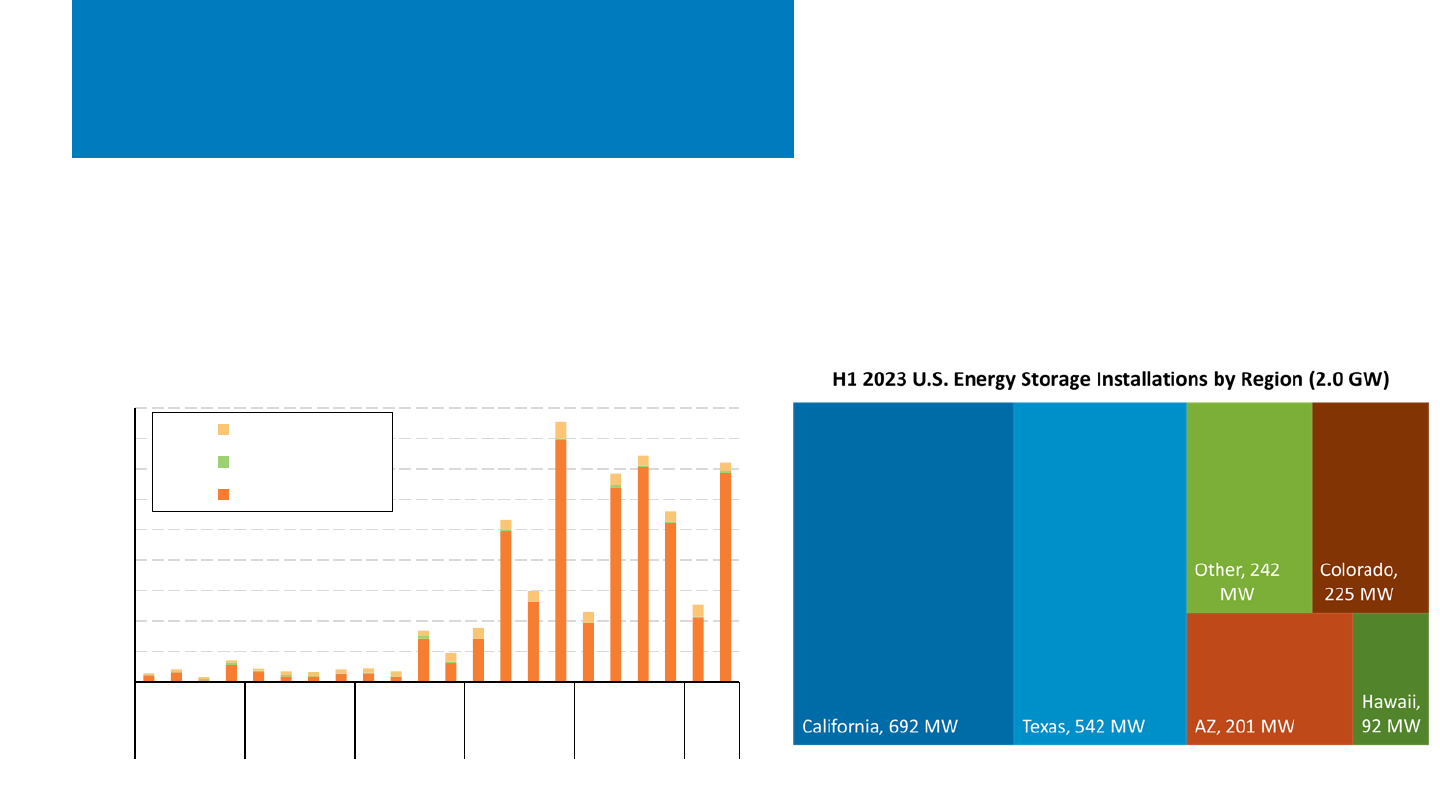
U.S. Energy Storage Installations
by Market Segment (EIA)
• California represented approximately 35% of
battery storage capacity installed in H1 2023,
followed by Texas (27%).
– The top five markets represented 88% of installed
energy storage capacity.
• EIA reports that the United States installed approximately
2.0 GW
ac
of energy storage onto the electric grid in the
first half of 2023—up 5% y/y as a result of high levels of
utility-scale and residential deployment.
Sources: EIA Form 860M, EIA Form 861M.
0
200
400
600
800
1,000
1,200
1,400
1,600
1,800
Q1 Q2 Q3 Q4 Q1 Q2 Q3 Q4 Q1 Q2 Q3 Q4 Q1 Q2 Q3 Q4 Q1 Q2 Q3 Q4 Q1 Q2
2018 2019 2020 2021 2022 2023
Energy Storage Installed (MW)
U.S. Energy Storage Installations by Market Segment
Residential
C&I
Utility-scale
NREL | 20NREL | 20
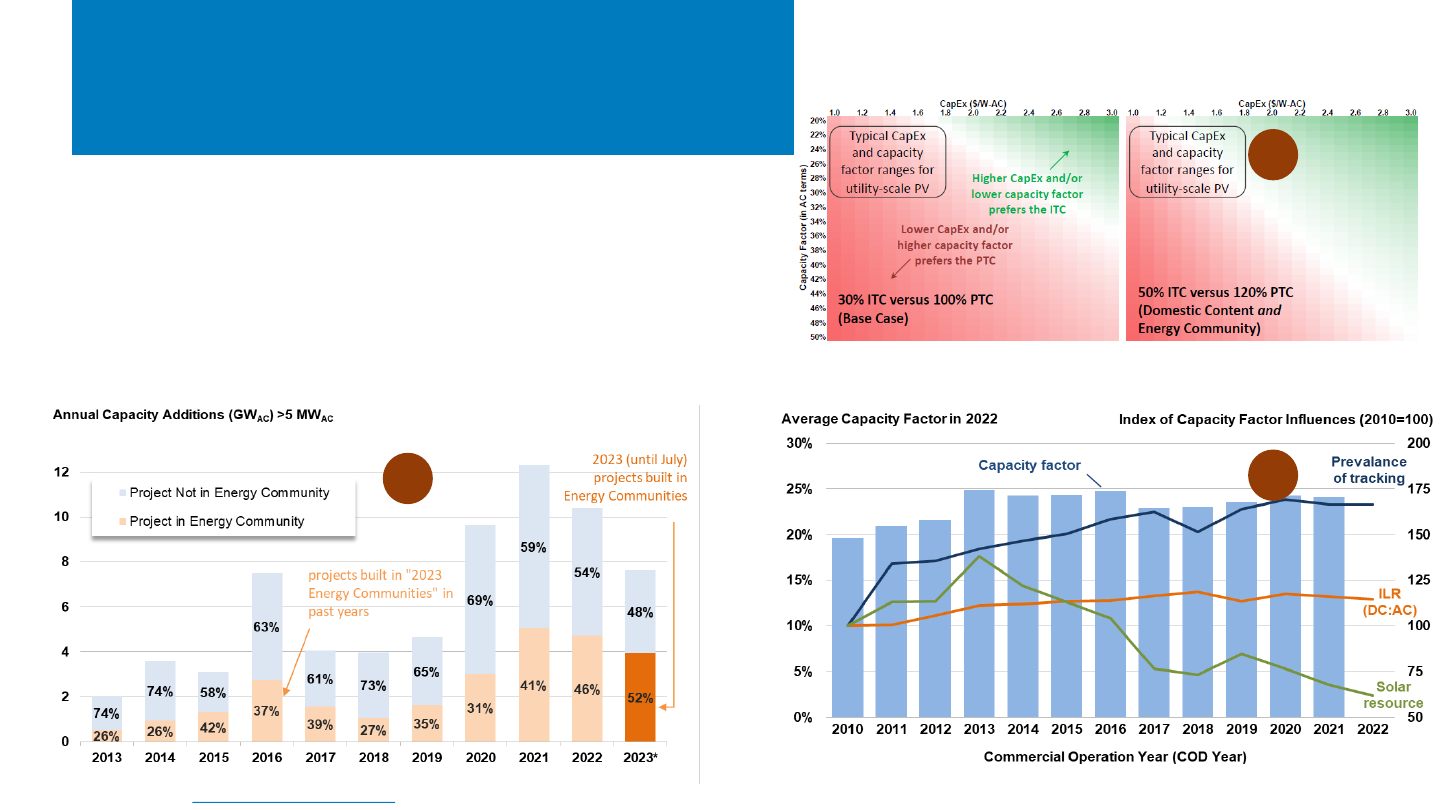
Five Things To Know From LBNL’s
Utility-Scale Solar, 2023 Edition
Source: Bolinger et al. 2023. Utility-Scale Solar, 2023 Edition. Lawrence Berkeley National Laboratory.
1. Half of utility-scale PV capacity built during January–July 2023 is in Energy
Communities and should qualify for the IRA Energy Community tax credit adder.
2. Under IRA, the production tax credit (PTC) is more valuable than the investment
tax credit (ITC) for many utility-scale PV systems, especially without bonus credits.
3. Average capacity factors by plant vintage have been flat since 2014 as installation
in areas with lower solar resource has offset increases in ILR and use of tracking.
4. 94% of utility-scale capacity installed in 2022 used tracking, the highest ever.
5. Because of high electricity prices, the total (energy plus capacity) value of PV
electricity increased 40% between 2021 and 2022, reaching a record $71/MWh.
1
2
3
NREL | 21NREL | 21
Five New Things To Know From
Tracking the Sun … 2023 Edition
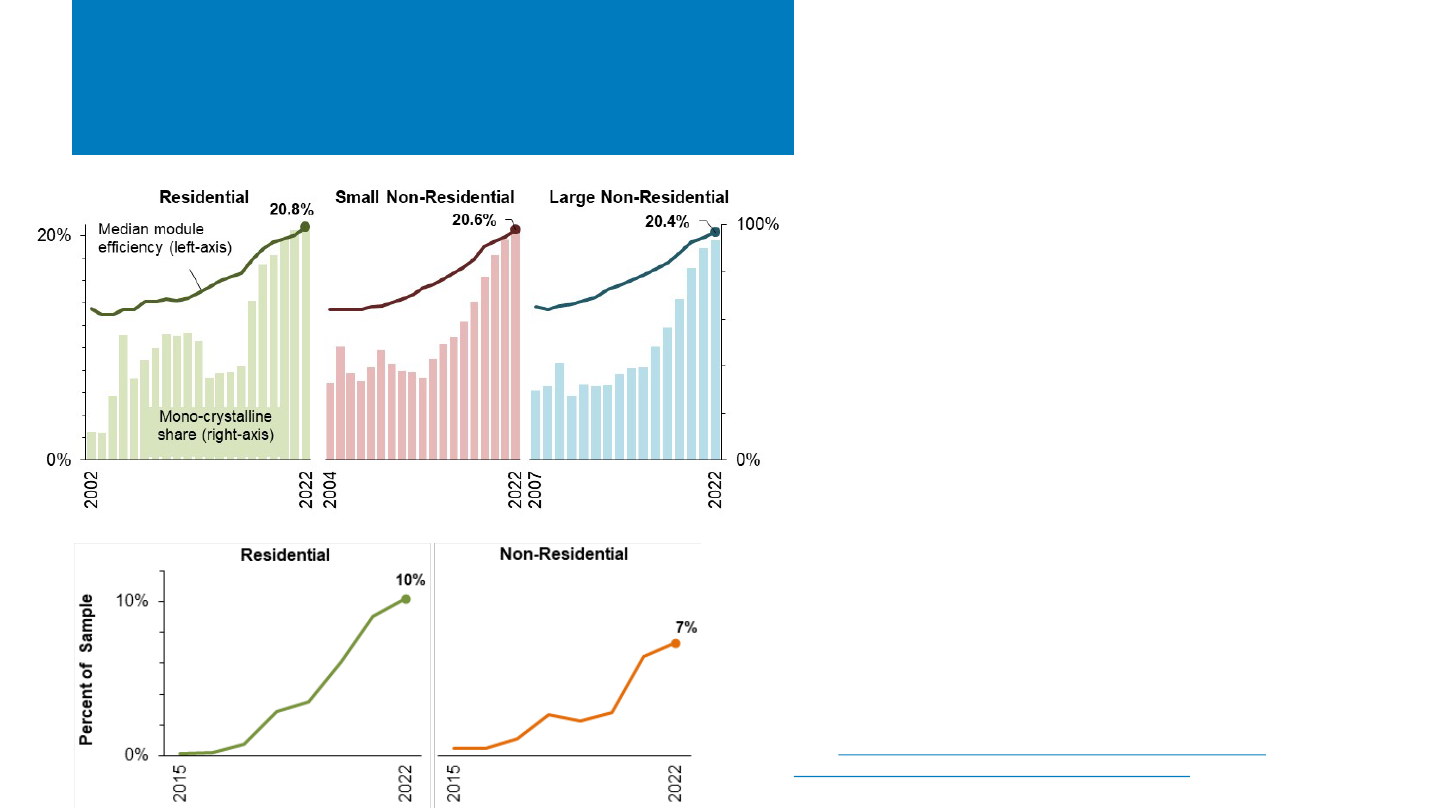
1. In 2022, the median module efficiency of U.S. residential PV
systems was 20.8%, up 0.7 percentage points y/y. 20th/80th
percentile range module efficiencies was 20% to 21.5%.
2. Third-party ownership has declined over time from its
historical high of 59% of residential installations in 2012 to
25% in 2022. Market share varies a lot by state.
3. For the second year in a row, microinverters represented over
half the residential market, beating out DC optimizer systems
53% to 41%. However, for large nonresidential systems, DC
optimizer market share continues to grow, up to 39% in 2022,
compared to 1% for microinverters.
4. Residential attachment rates have steadily risen over time,
reaching 10% of the sample in 2022—approximately eight
states have an attachment rate greater than 10%. 65% of
paired storage had a capacity of 5 kW; however, market share
for larger storage sizes has grown over time, driven by backup
power demand.
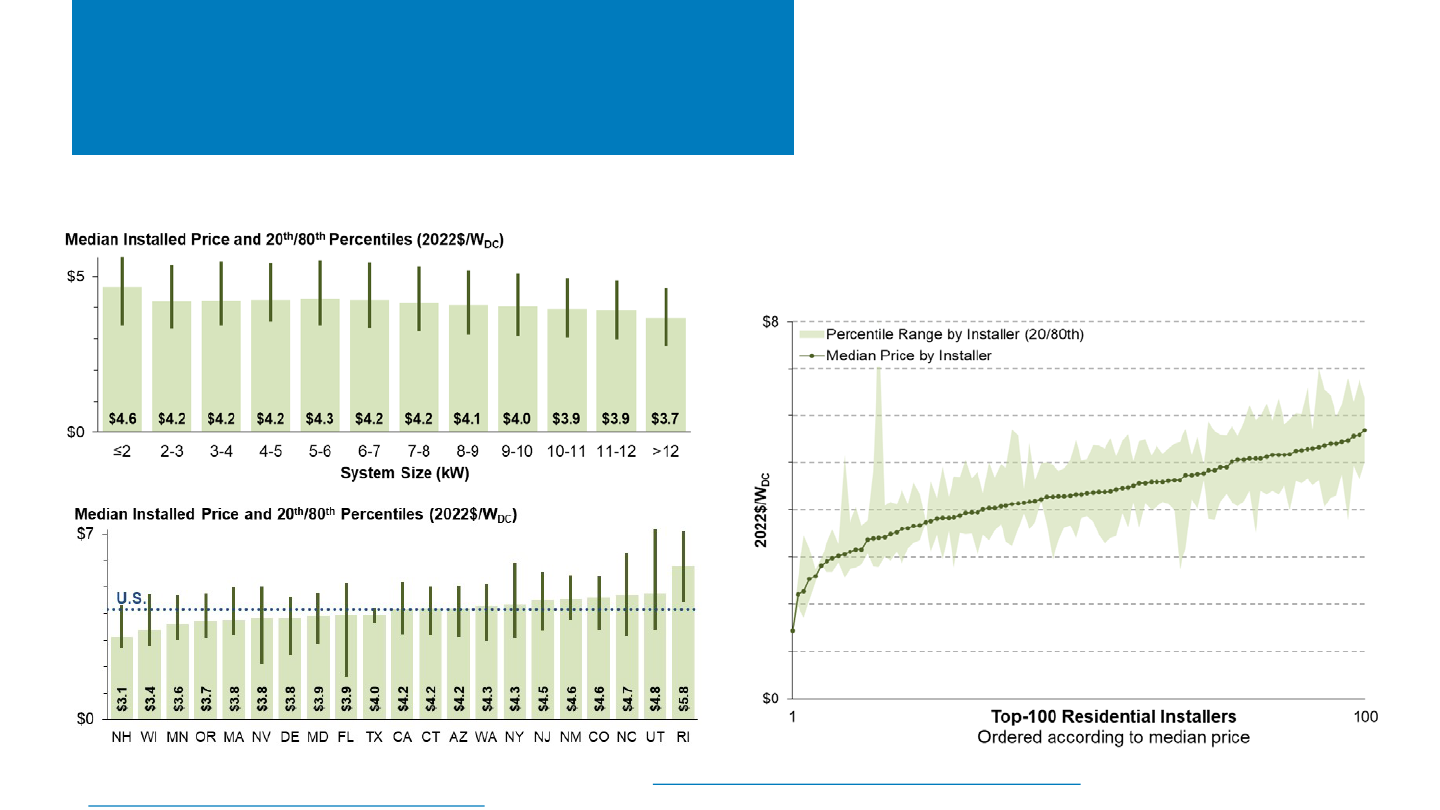
5. LBNL performed a regression analysis and found prices are
generally lower in markets with more cumulative PV
installations and areas with higher income. Their modeling also
suggests that prices are $0.6/W lower for systems installed
during new construction.
Source: Barbose, G., N. Darghouth, E. O’Shaughnessy, and S. Forrester.
2023. Tracking the Sun: Pricing and Design Trends for Distributed
Photovoltaic Systems in the United States 2023 Edition. Berkeley, CA:
Lawrence Berkeley National Laboratory. September 2023.
Storage Attachment Rates by Sector (2022)
Module Efficiency and Monocrystalline Market Share

NREL | 22
Global Solar Deployment1
U.S. PV Deployment
2
PV System Pricing
3
Global Manufacturing
4
Component Pricing
5
U.S. PV Imports
6
7 PV Domestic Content
Agenda
• Most data suggest mixed PV system pricing across market
segments, with price increases in nominal terms.
• U.S. PV system pricing, or costs, is estimated and quoted in a
variety of ways, including:
– Reported price (backward-looking)
– Reported costs (backward-looking and may not include profit,
unless incorporating “value”)
– Developer quotes (forward-looking)
– Bottom-up cost benchmarking (forward-looking).
• In 2022, the ranges in average U.S. PV system pricing across
methods were reported to be:
– $3.1/W–$4.2/W for residential solar
– $1.6/W–$3.2/W for nonresidential solar
– $0.9/W–$1.1/W for utility-scale solar.
• In the first half of 2023, the ranges in average U.S. PV system
pricing across a smaller set of methods were reported to be:
– $2.7/W–$4.3/W for residential solar
– $1.8/W–$2.4/W for nonresidential solar
– $1.2/W for utility-scale solar.
NREL | 23NREL | 23
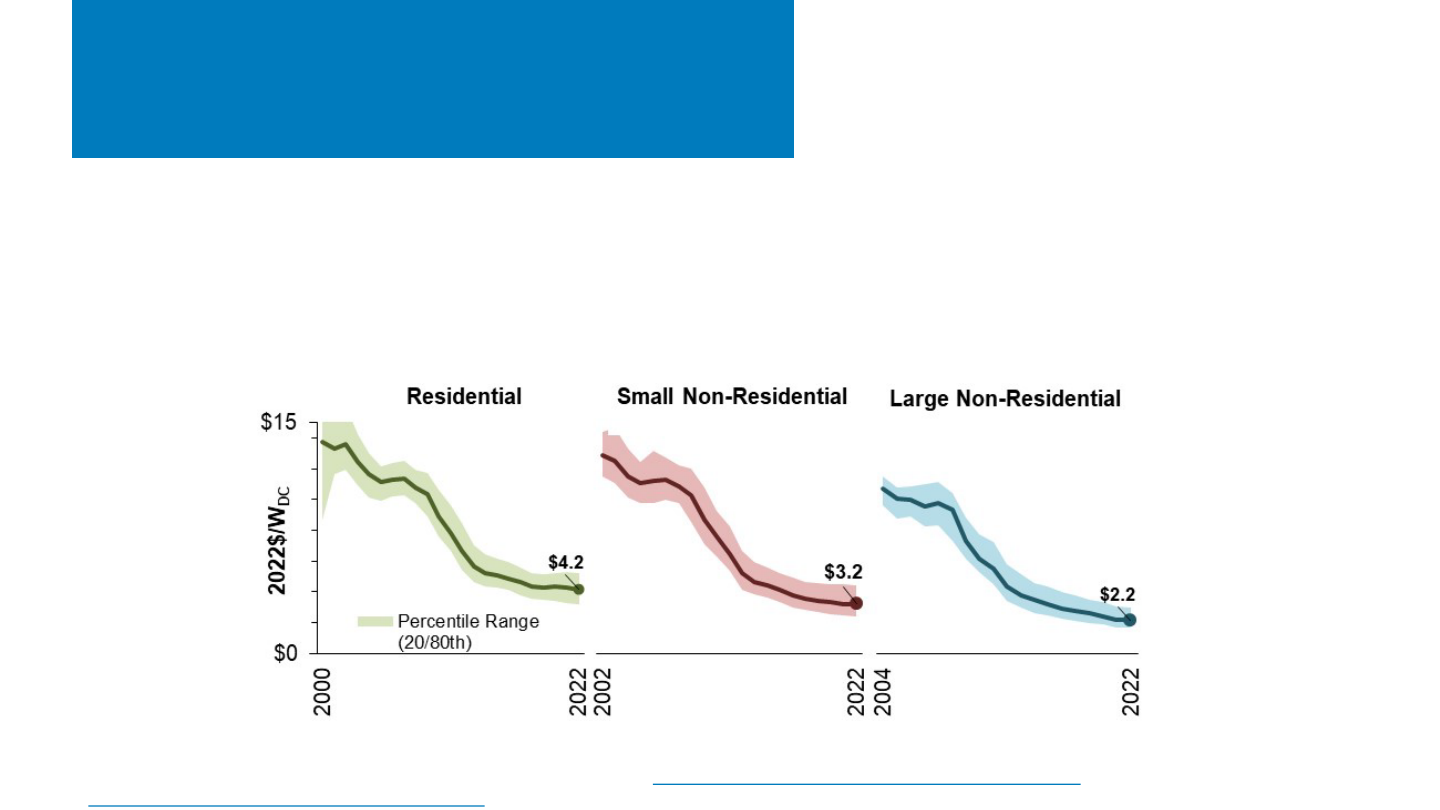
Tracking the Sun: National
Price, 2000–2022
• Over the long term, median installed prices have fallen by roughly $0.4/W per year, on average, but price
declines have tapered off since 2013, after which price declines averaged $0.1–$0.2/W across segments,
following the trajectory of module costs.
• PV system prices rose in nominal dollars over the past 2 years but continued to fall in real dollars.
Source: Barbose, G., N. Darghouth, E. O’Shaughnessy, and S. Forrester. 2023. Tracking the Sun: Pricing and Design Trends for Distributed
Photovoltaic Systems in the United States 2023 Edition. Berkeley, CA: Lawrence Berkeley National Laboratory. September 2023.

NREL | 24NREL | 24
NREL Bottom-Up Cost Modeling:
Q1 2023 Installed Cost Benchmarks
Source: Ramasamy et al. 2023. U.S. Solar Photovoltaic System and Energy Storage Cost Benchmarks, With Minimum Sustainable Price Analysis: Q1 2023
Modeled market price (MMP) benchmarks are
significantly higher than minimum sustainable
price (MSP) benchmarks for PV-only and PV-plus-
storage systems, indicating significant inflationary
market and policy distortion in Q1 2023.
NREL | 25NREL | 25
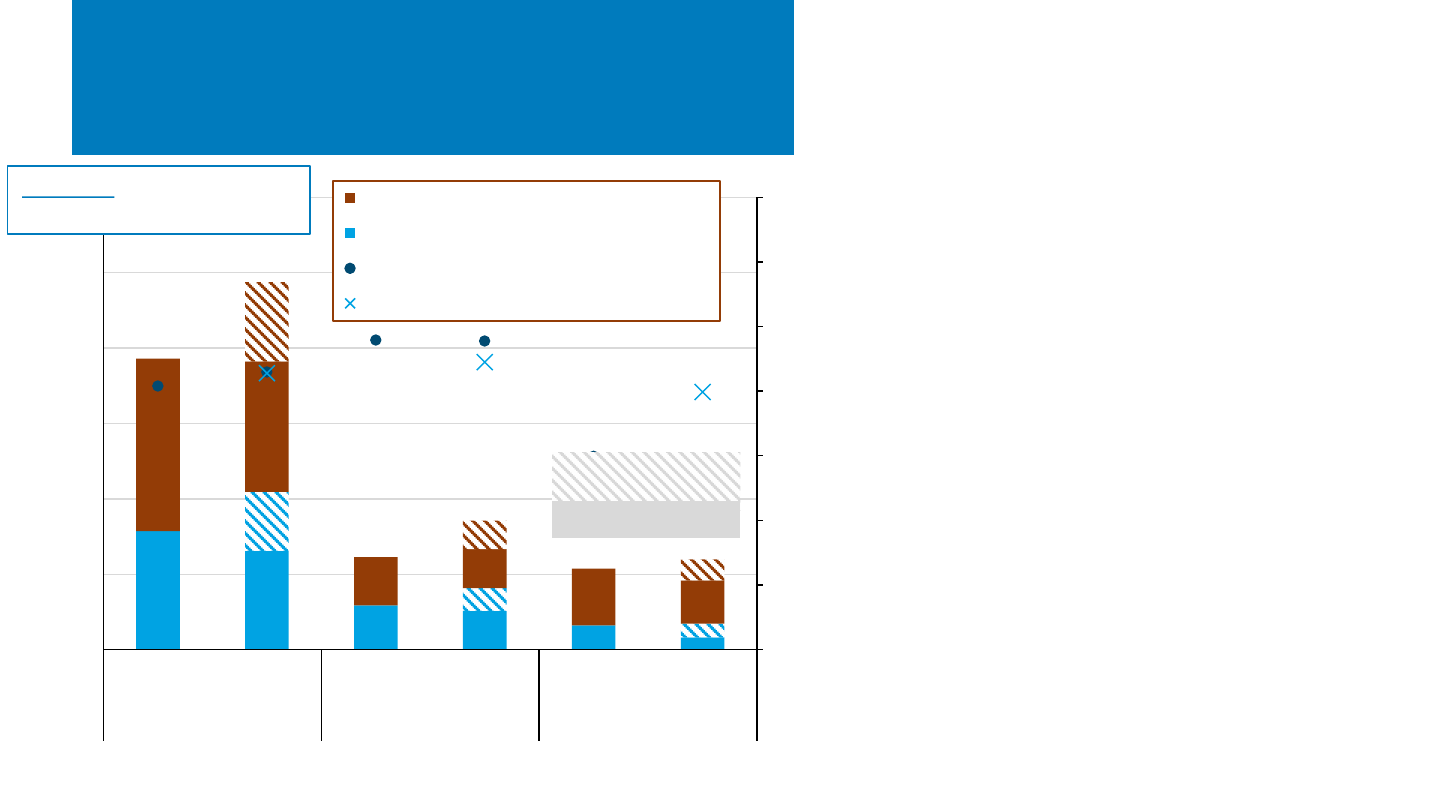
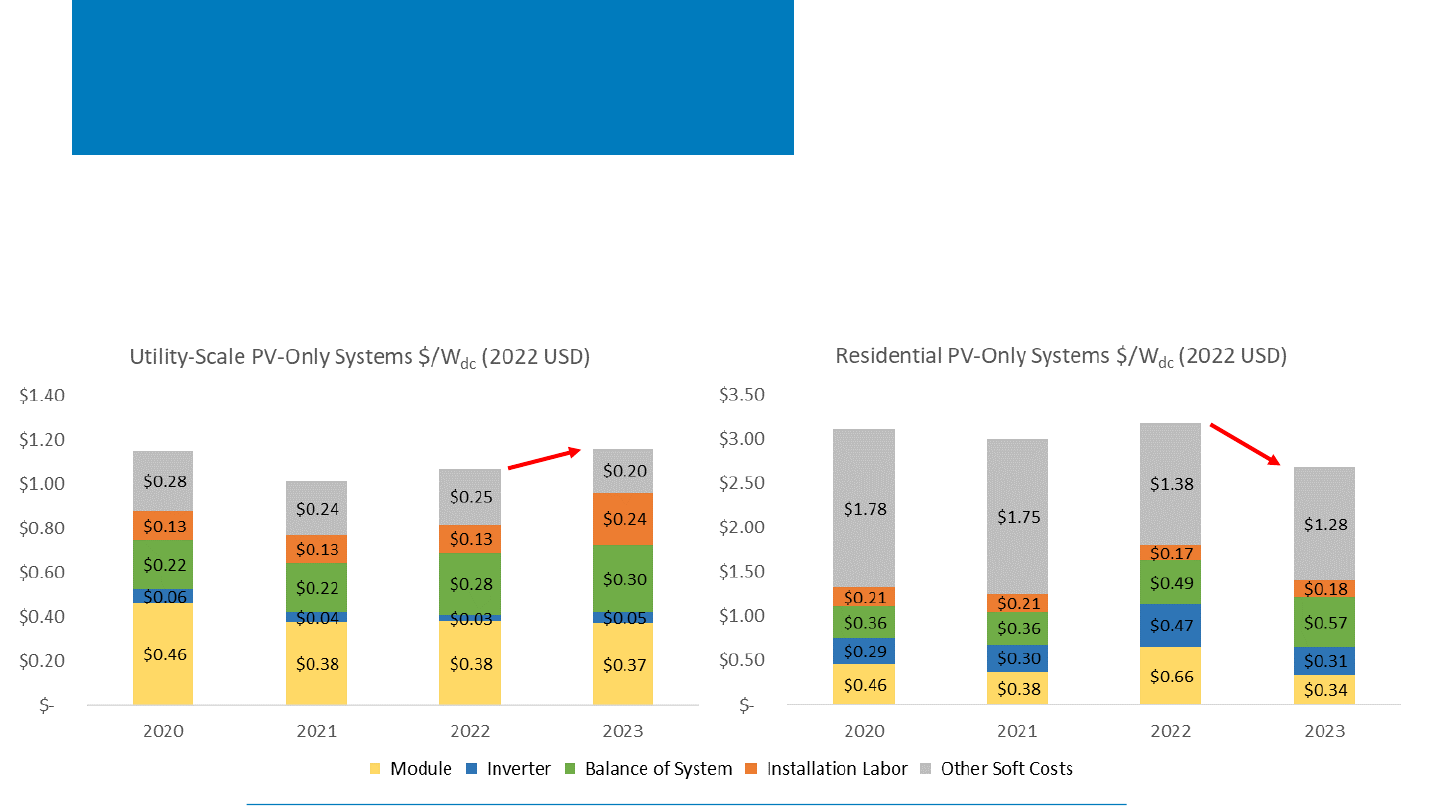
NREL Utility-Scale & Residential PV-
Only MMP Benchmarks, 2020–2023
$1.15
$1.01
$1.07
$1.16
$3.10
$3.00
$3.18
$2.68
• Residential PV-only MMPs were 15% lower in Q1
2023 than in Q1 2022.
• Higher BOS costs were more than offset by lower
module, inverter, logistics, and customer acquisition
costs.
• Utility-scale PV-only MMPs were 8% higher in Q1
2023 than in Q1 2022.
• Higher inverter, labor, and electrical BOS (including
network upgrade) costs more than offset lower
module, structural BOS, and other soft costs.
+8%
-15%
Source: Ramasamy et al. 2023. U.S. Solar Photovoltaic System and Energy Storage Cost Benchmarks, With Minimum Sustainable Price Analysis: Q1 2023
NREL | 26NREL | 26
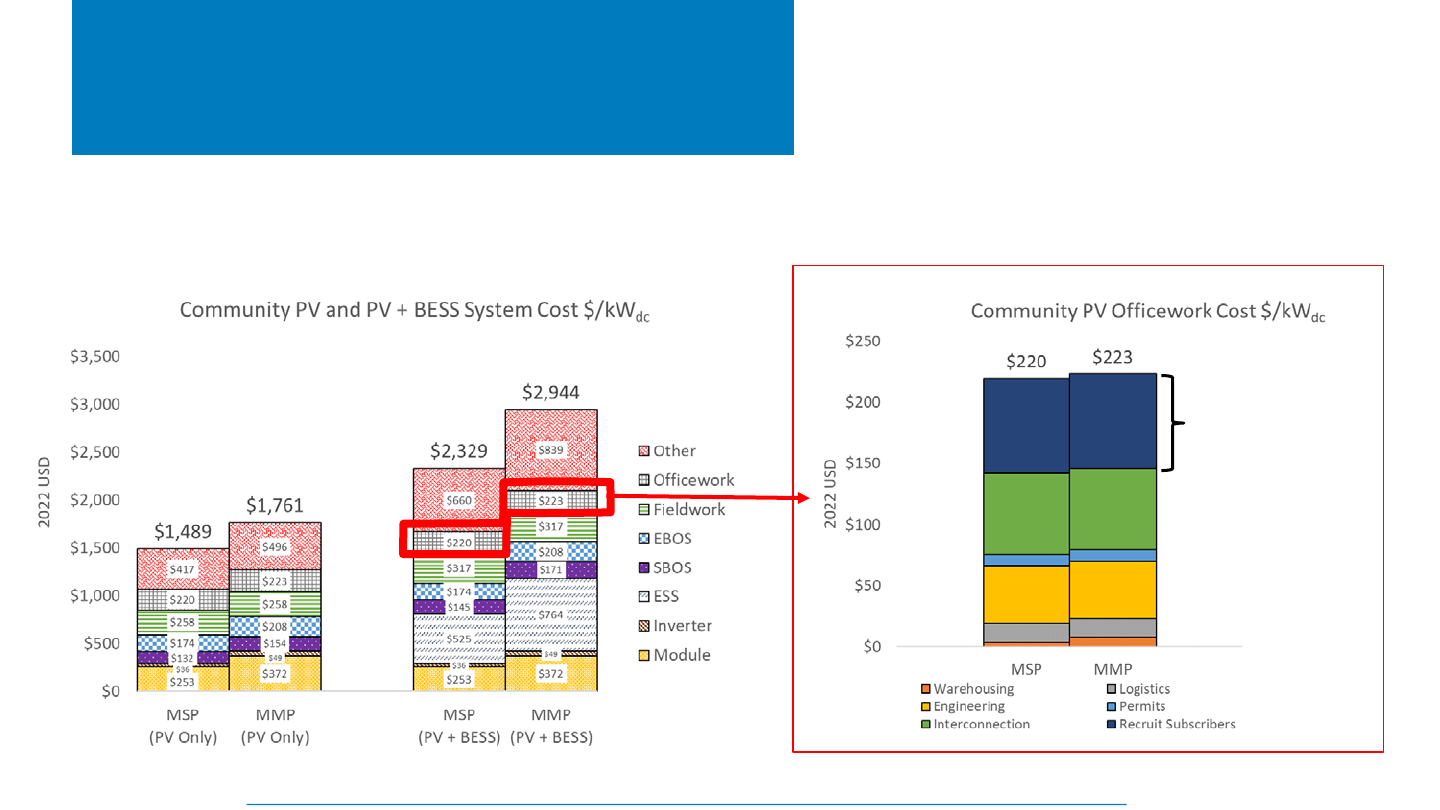
NREL Community Solar
Benchmarks, Q1 2023
The cost of community solar systems was benchmarked for the first time, including unique
expenses for subscriber acquisition and management.
Subscriber
acquisition
cost
Source: Ramasamy et al. 2023. U.S. Solar Photovoltaic System and Energy Storage Cost Benchmarks, With Minimum Sustainable Price Analysis: Q1 2023
NREL | 27NREL | 27
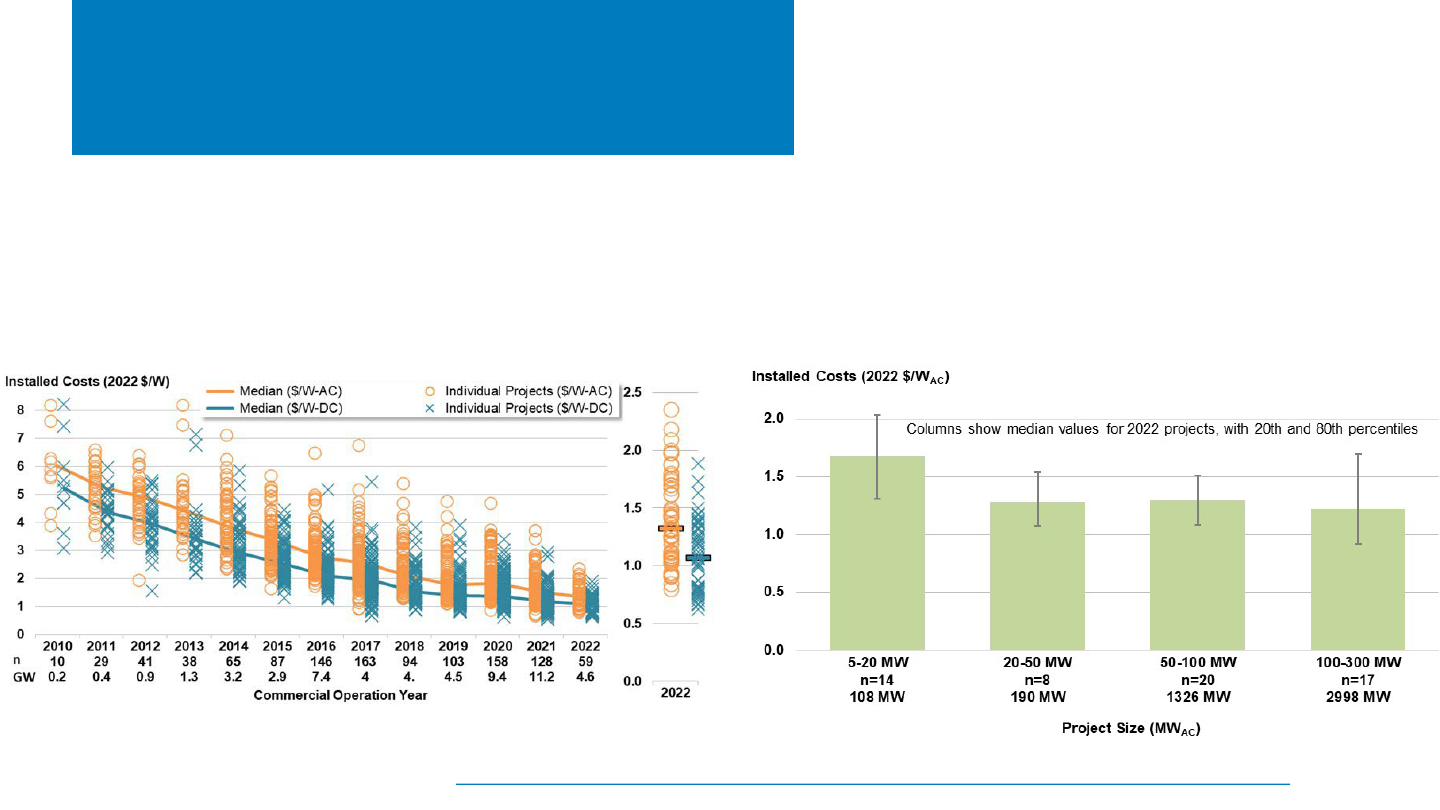
Reported Price of U.S. Utility-Scale
PV Projects Over Time
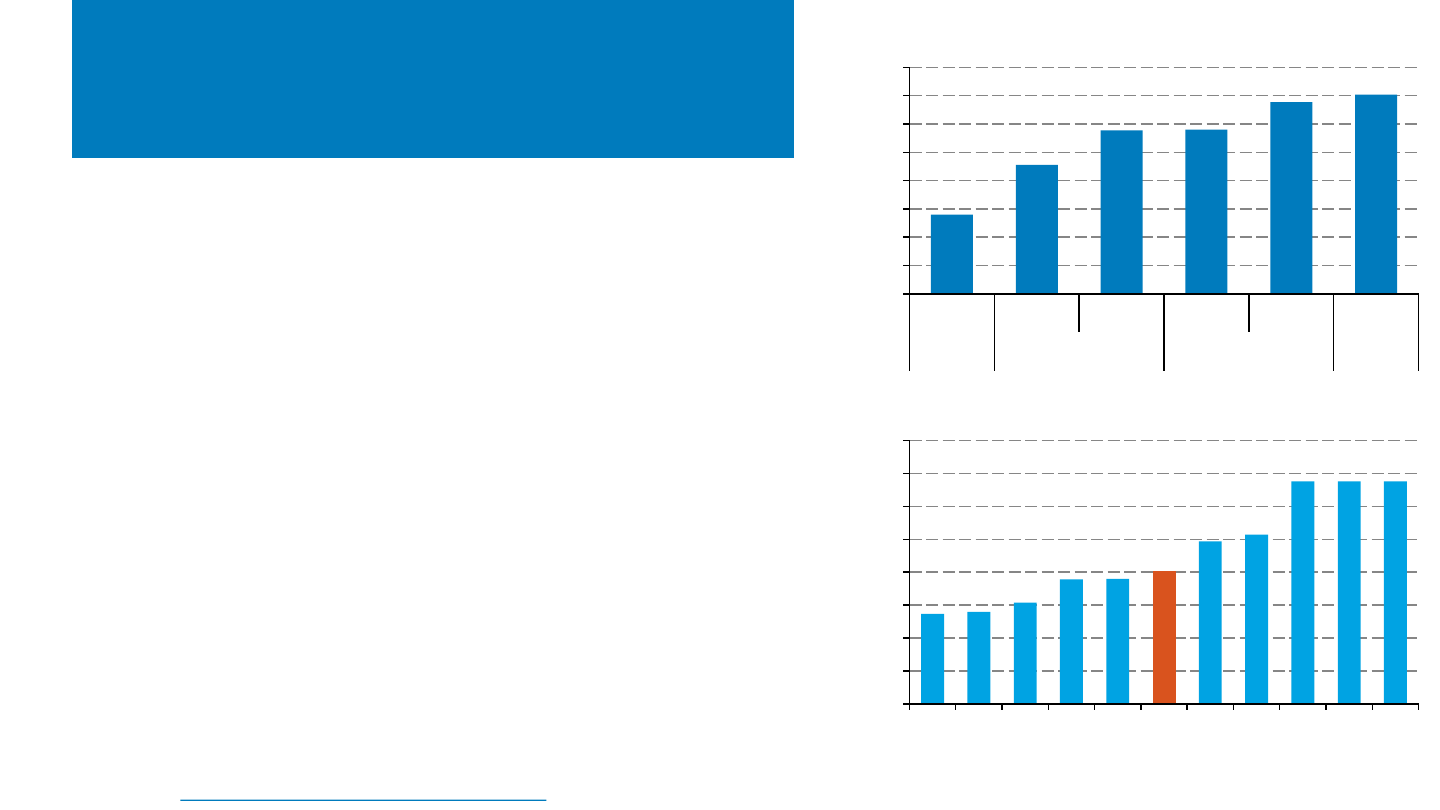
• The median installed price of PV has fallen by 78% since
2010 to $1.32/W
ac
($1.07/W
dc
) in 2022.
• The lowest 20th percentile of project prices fell below
$1.1/W
ac
($0.8/W
dc
) in 2022.
• Larger utility-scale solar projects (50–100 MW) cost
21% less than smaller projects (5–20 MW) per
megawatt of installed capacity in 2022.
• This sample is backward-looking and may not reflect
the price of projects built in 2023 and 2024.
Source: Bolinger, M., J. Seel, C. Warner, and D. Robson. 2023. Solar Empirical Trends in Project Technology, Cost, Performance, and PPA Pricing in the United States: 2023 Edition.
Berkeley, CA: Lawrence Berkeley National Laboratory.
NREL | 28NREL | 28
$3.1
$3.2
$2.9
$2.6
$2.8
$4.2
$3.3
$4.0
$1.8
$1.7
$1.8
$1.6
$3.2
$2.2
$1.1
$1.0
$1.0
$0.9
$1.1
$0.0
$1.0
$2.0
$3.0
$4.0
$5.0
$6.0
BNEF
WoodMac/SEIA
NREL (MMP)
NREL (MSP)
EnergySage
LBNL
Sunrun Sale Price
SunPower Rev./W
BNEF
WoodMac/SEIA
NREL (MMP)
NREL (MSP)
LBNL (≤100kW)
LBNL (>100kW)
BNEF (1-Axis)
WoodMac/SEIA (1-Axis)
NREL (1-Axis, MMP)
NREL (1-Axis, MSP)
LBNL
Modeled Quote Reported Modeled Reported Modeled Reported
Residential Non-Residential Utility-scale
System Price (2022 $/Wdc)
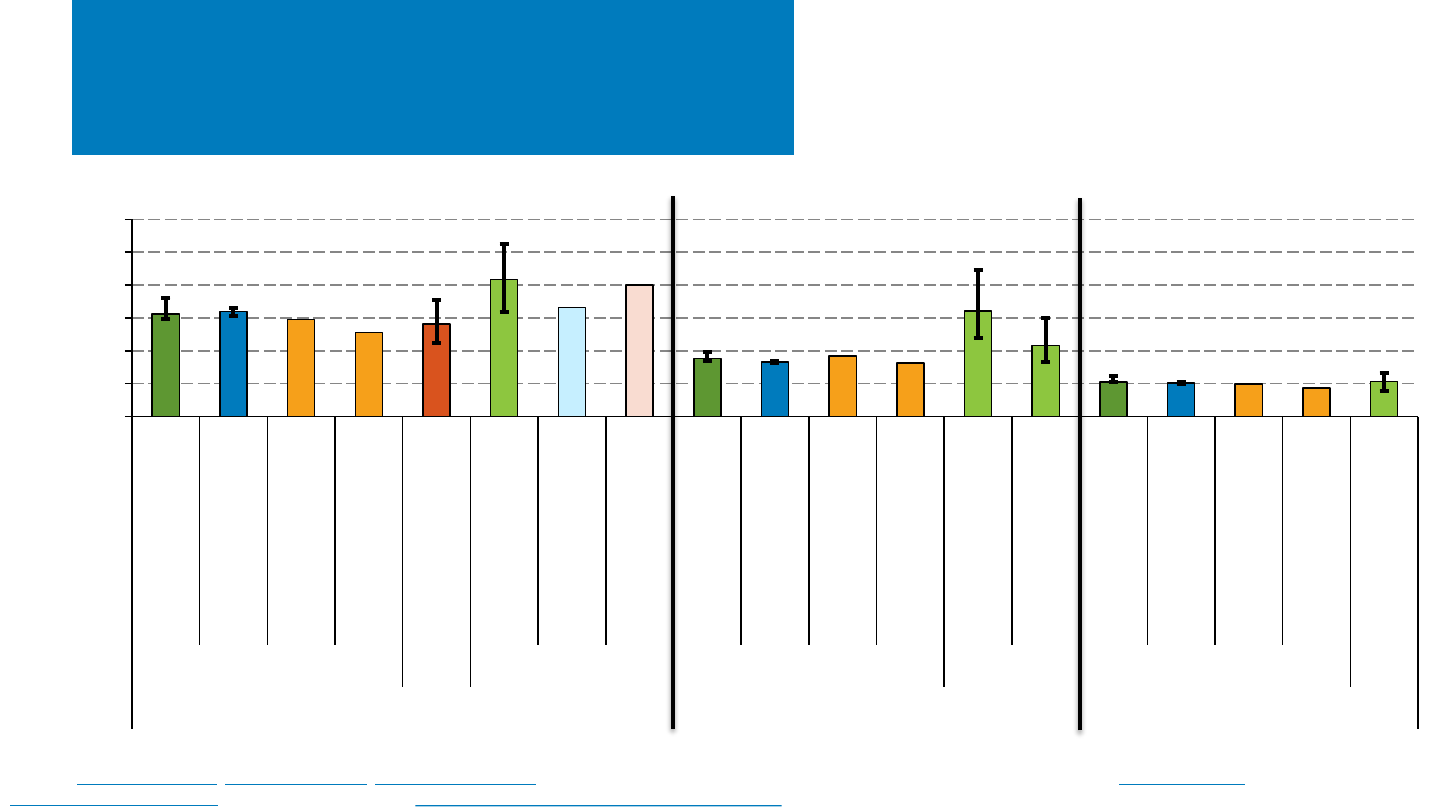
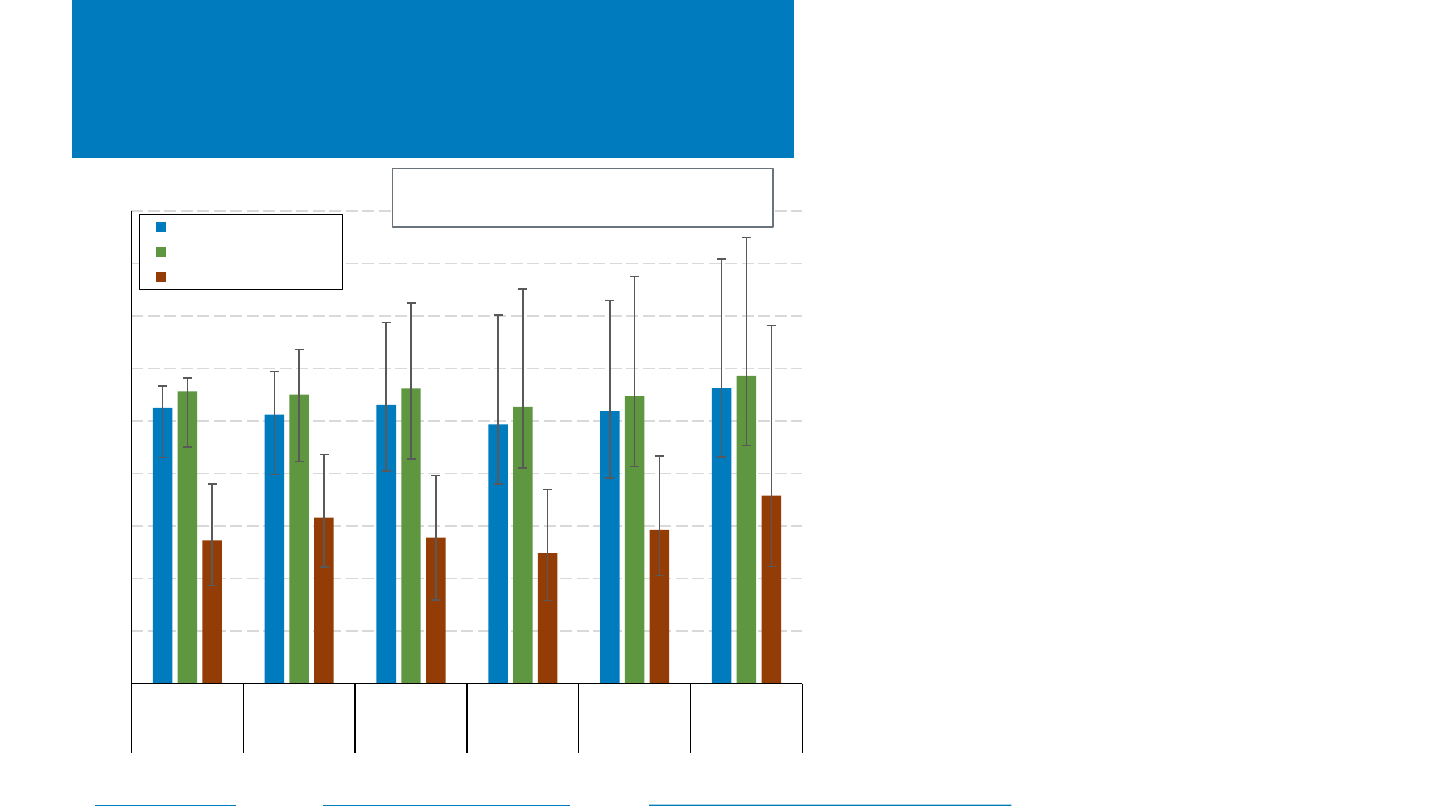
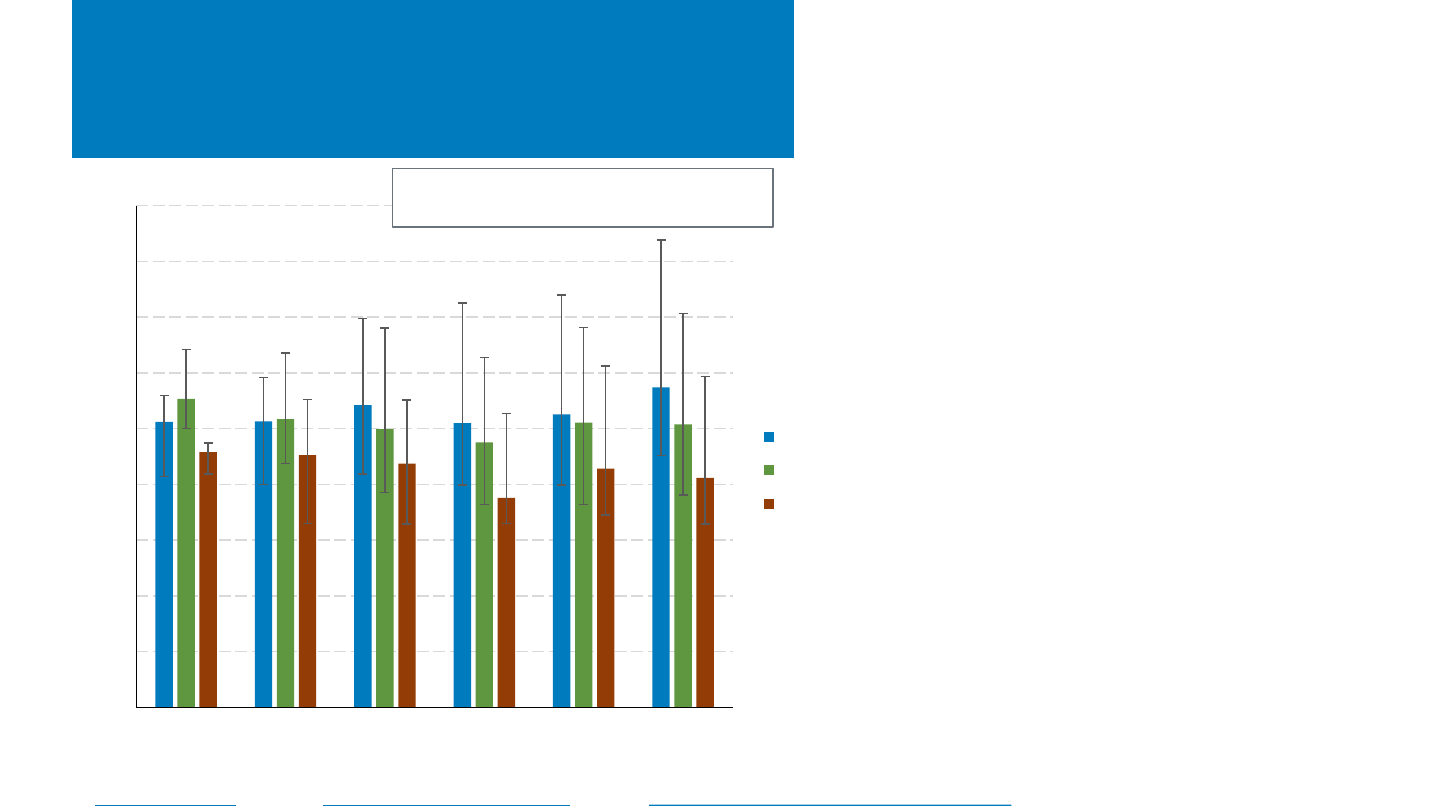
2022 Modeled, Reported, and
Quoted System Price From Various
Sources
Note: Some sources only report a range, which is represented by the error bars.
Sources: Barbose
et al. 2022; Bolinger et al. 2022; Ramasamy et al. 2022; BNEF, “H1 2022 U.S. PV Market Outlook,” April 2022; : Wood Mackenzie/SEIA: U.S. Solar Market
Insight: 2021 Year-in-Review, March 2022; EnergySage, Solar Marketplace Intel Report H1 2021 – H2 2022.
• NREL and LBNL PV system price ranges
generally overlap other sources.
• Across various sources, reported system
pricing is generally higher than modeled and
quoted system pricing.

NREL | 29NREL | 29
Why is there such price
variation?
• Utility-scale PV
– There is some variation in estimates; however, reported and modeled pricing is
relatively consistent between sources.
• Soft costs are more easily spread out over large projects.
• There are diminishing returns to economies of scale.
• Utility-scale businesses operate under very competitive operating conditions,
where bid-price typically becomes the differentiator.
• Nonresidential PV
– Nonresidential PV contains a large variation in project type from offtaker (industrial,
commercial, nonprofit, government), system size (lots of small projects, but a
significant capacity of larger projects), and project design (rooftop, ground-mount,
carport).

NREL | 30NREL | 30
Why is there such price
variation?
• Residential
– Some of the variation in residential pricing can be explained by different installers;
state environments; temporal differences between when a system or component has
a quoted price and when a system is installed; and sizes in datasets.
• 2022 system size: LBNL (7.2 kW); NREL (7.9 kW); EnergySage (10.2 kW); Sunrun (7.2
kW).
– However, when accounting for these factors, large discrepancies still exist.
NREL | 31NREL | 31
Why is there such price
variation?
• Modeled and quoted residential PV
system prices between $2.8/W
(EnergySage) and $3.10 (BNEF)
correspond to some of the lowest state
and installer reported pricing; this
discrepancy cannot be explained by
economies of scale (system size).
Source: Barbose, G., N. Darghouth, E. O’Shaughnessy, and S. Forrester. 2023. Tracking the Sun: Pricing and Design Trends for Distributed
Photovoltaic Systems in the United States 2023 Edition. Berkeley, CA: Lawrence Berkeley National Laboratory.

NREL | 32NREL | 32
Why is there such price
variation?
• Financing and other costs are likely responsible for a larger portion of the additional discrepancies in
residential PV reported price.
– TPO Finance: Sunrun, which finances most of its customers’ systems, reported a 2022 value per
customer of $5.80/W, which represents the net present value of contracted cash flows, tax
credits, and other benefits, including an assumed contract extension. Financing and operating a
PV system for 30 years requires additional costs beyond just installation. Its 2022 “creation cost”
was $4.17/W compared to its average PV system sales price of $3.30/W.
– Loan finance: Loans, which represented most residential PV system installations in 2022, incur
additional costs to set up. Additionally, many loan providers charge “dealer fees” to lower the
interest rate of the loan, which show up in the reported price of a system.
– Other costs not necessarily quoted (or modeled) in a standard PV system, but which may be
reported in a system price, include certain roof repairs, main panel upgrades, and battery
storage (which were attached to 10% of residential PV in 2022).
NREL | 33NREL | 33
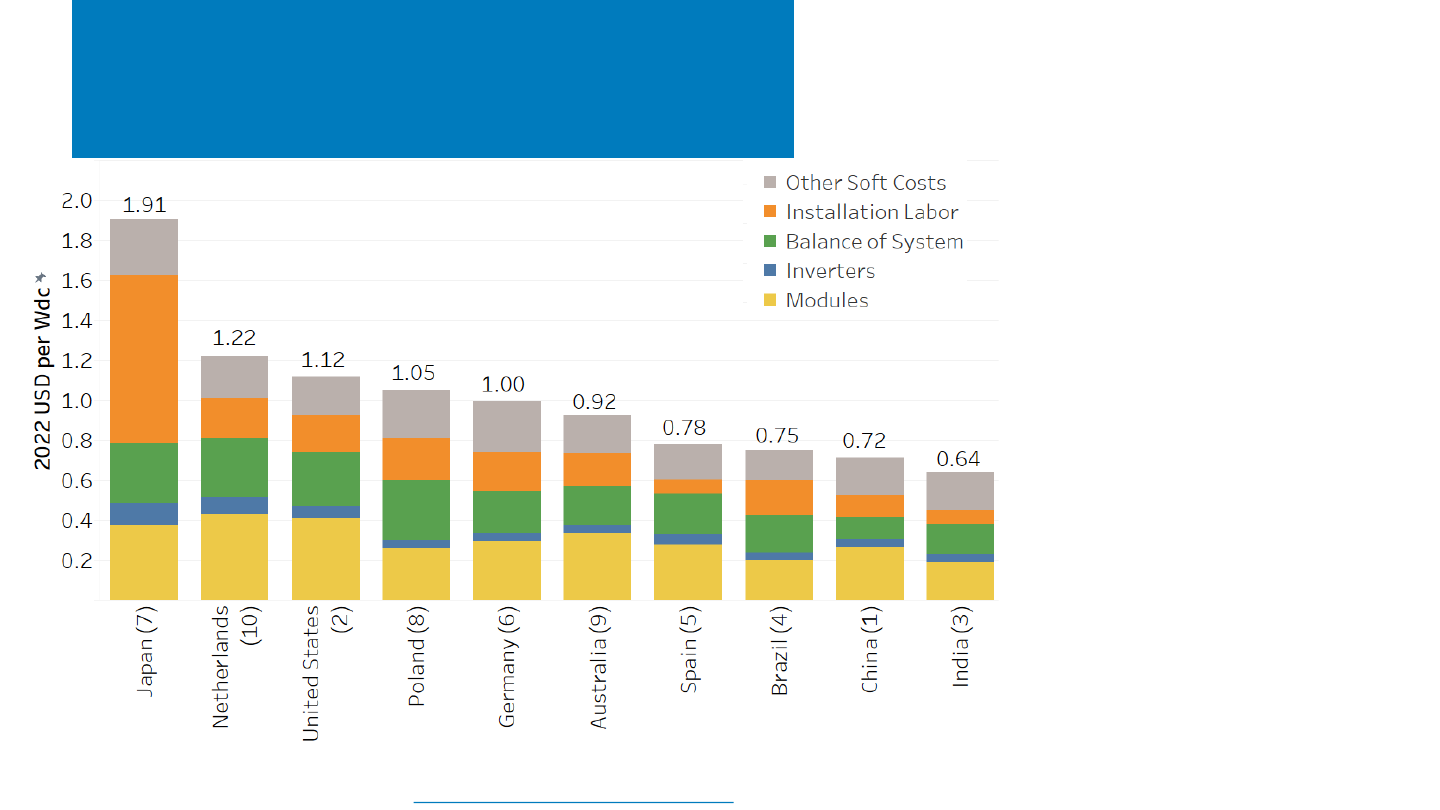
Utility-Scale PV Installed Costs
by Country, 2022
Source: International Renewable Energy Agency. 2023. Renewable Power Generation Costs in 2022
• The global capacity-weighted average
total installed cost of utility-scale
projects commissioned in 2022 was
$0.88 (USD)/W
dc
.
• Average component costs as a
percentage of total costs:
– Module and inverter 37%
– Balance of system hardware 23%
– Installation labor 19%
– Other soft costs 21%.
• Costs and cost components varied
across countries:
– India had the lowest cost ($0.64
(USD)/W
dc
) and Japan the highest
($1.91 (USD)/W
dc
).
– The ratio of highest-cost to
lowest-cost country declined from
3.5 in 2019 to 3.0 in 2022,
suggesting that global PV costs are
converging.
– Labor costs varied the most across
countries.
Top 10 Global PV Markets in 2022
NREL | 34NREL | 34
Residential System Price
Reported by EnergySage
Note: Price based on winning quoted price.
Source: EnergySage, Solar Marketplace Intel Report H2 2022 – H1 2023.
• The median reported price by EnergySage for
residential PV systems increased 4.7% y/y, for the
fourth straight period, after never having done so
before.
– However, EnergySage reported seeing price
declines in July and August.
• Residential system price varied by state. In H1 2023,
the median price of a residential system in New York
was 40% higher than the median price of a residential
system in Arizona.
– Part of the price disparity between states is due to
differences in average system size, though other
factors, such as cost of living (e.g.,
Massachusetts), also play a role.
$2.35
$2.45
$2.55
$2.59
$2.89 $2.89
$2.90 $2.90
$2.95
$3.10
$3.30
$0.0
$0.5
$1.0
$1.5
$2.0
$2.5
$3.0
$3.5
AZ FL NV TX CA NJ GA US VA IL NY
Cost and Tax Credit by State, H1 2023 ($/W
dc
)
3.80
3.74
3.65
3.50
3.35
3.18
3.10
3.06
3.00
2.93
2.89
2.85
2.75
2.67
2.68
2.77
2.85
2.90
$0
$1
$2
$3
$4
$5
H2 H1 H2 H1 H2 H1 H2 H1 H2 H1 H2 H1 H2 H1 H2 H1 H2 H1
2014 2015 2016 2017 2018 2019 2020 2021 2022 23
Median Gross Costs ($/W)
Cost Over Time
NREL | 35NREL | 35
Large Residential Installer
Cost and Value, Q2 2023
Sources: Corporate filings; Personal Communication, Mike Weinstein (Vice President of Investor Relations, SunPower), September 2023
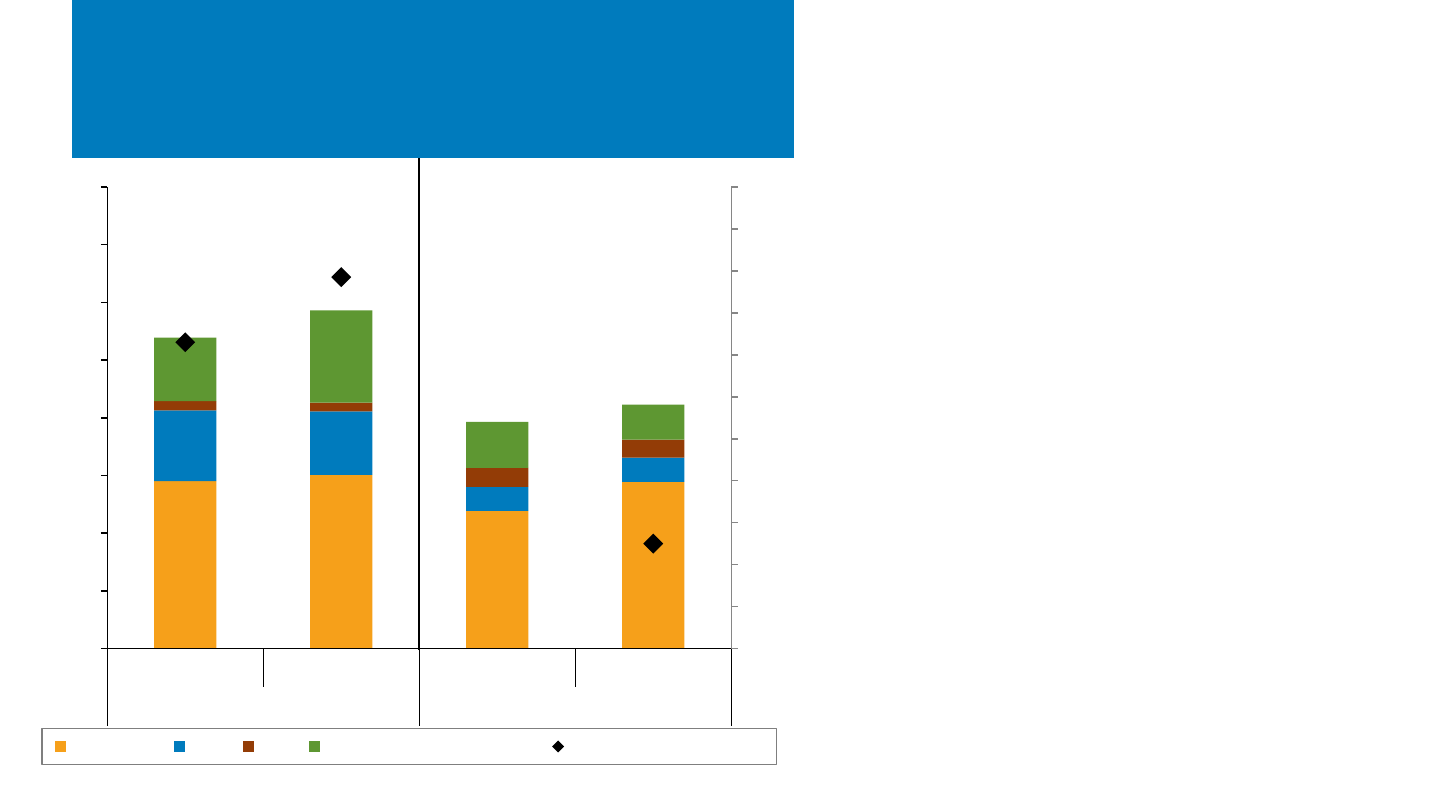
• Large residential installers Sunrun and SunPower
reported system value/cost changes of +8% to
+9% y/y but −1% to +3% q/q.
• Factors reported as supporting higher system
value and/or costs (for Sunrun, SunPower, and
Sunnova):
– Increasing inflation and interest rates
– Increasing retail electricity rates
– Increasing battery attachment rates (batteries
add cost but can yield higher margins)
• Sunrun rate up from 15% to 18% y/y
• Up to 80%+ rate ca. July–Aug. 2023 in
California, under new PV compensation policy
• Up to 100% rate in Hawaii and Puerto Rico.
• Factors reported as supporting lower PV system
costs and/or higher margins:
– Declining equipment prices
• Module and battery procurement costs down
by >20% compared with recent highs
• Cost reductions expected to have impact over
at least the next several quarters.
• Increasing permitting automation (SolarAPP+).
$2.90
$3.01
$2.39
$2.89
$1.23
$1.10
$0.42
$0.42
$0.16
$0.15
$0.33
$0.31
$1.10
$1.60
$0.79
$0.61
0%
2%
4%
6%
8%
10%
12%
14%
16%
18%
20%
22%
$0.0
$1.0
$2.0
$3.0
$4.0
$5.0
$6.0
$7.0
$8.0
Q2 '22 Q2 '23 Q2 '22 Q2 '23
Sunrun SunPower
Battery Attachment Rate
Installed Cost ($/W
dc
)
Installation Sales G&A Net Value or Gross Margin Battery Attachment Rate
Mostly system leases—bars
represent subscriber value, including
the net present value of contracted
cash flows, tax credits, and other
benefits, including an assumed
contract extension.
Mostly system sales—bars represent
system costs in Q2 2023, including a
gross margin.
NREL | 36NREL | 36
Distributed PV System Pricing
From Select States
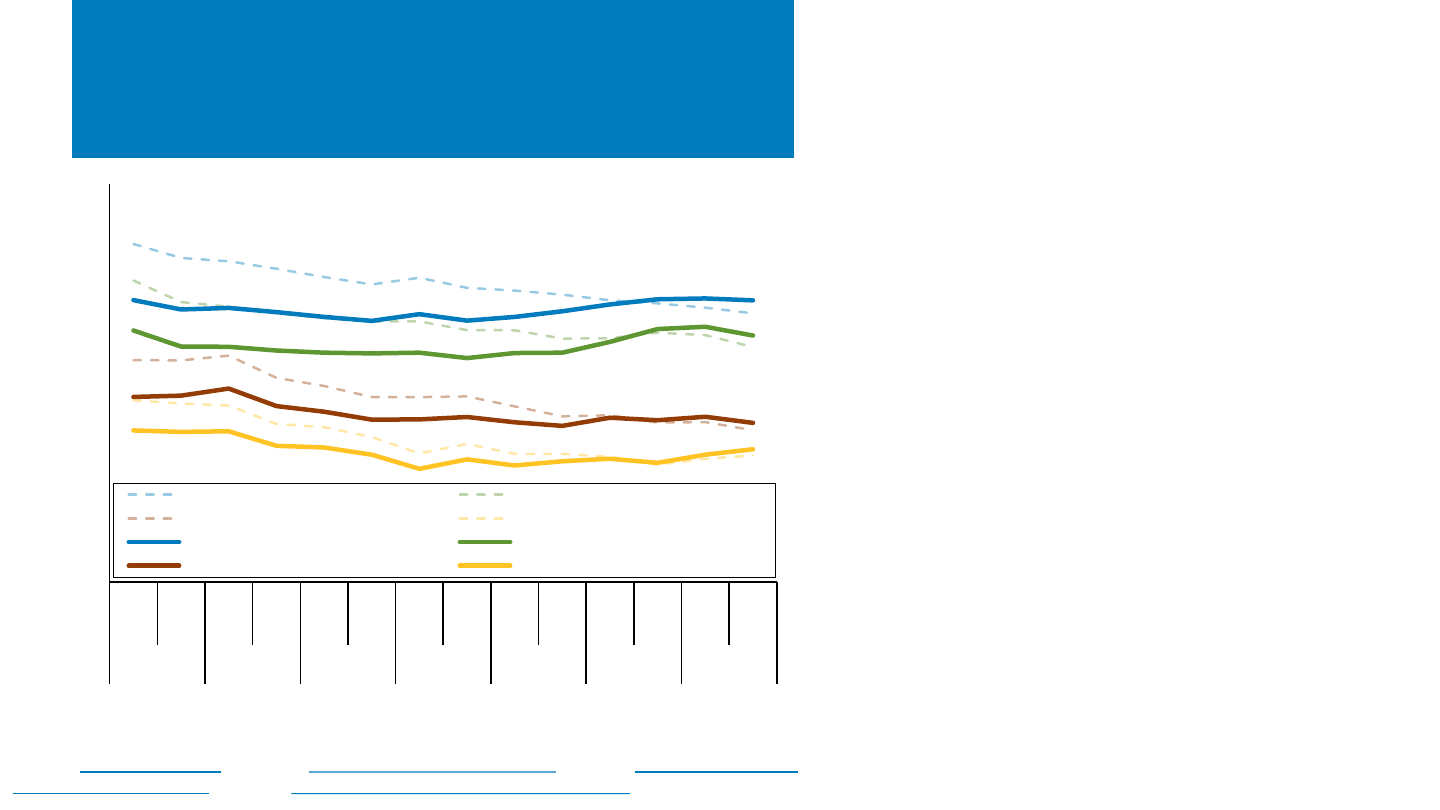
• From H2 2022 to H2 2023 (partial), the median
reported distributed PV system price—in nominal
USD—across Arizona, California, Massachusetts, and
New York:
– Decreased 0.4% to $4.25/W
dc
for systems 2.5 to
10 kW
– Decreased 3% to $3.72/W
dc
for systems 10 to
100 kW
– Decreased 2% to $2.40/W
dc
for systems 100 to
500 kW
– Increased 11% to $2.00/W
dc
for systems 500 kW
to 5 MW.
• From H2 2022 to H2 2023 (partial), the median
reported distributed PV system price—in 2022
(inflation-adjusted) dollars—across these states:
– Decreased 4% for systems 2.5 to 10 kW
– Decreased 6% for systems 10 to 100 kW
– Decreased 5% for systems 100 to 500 kW
– Increased 8% for systems 500 kW to 5 MW.
• Adjusting for inflation reveals the continuing real
distributed PV price reductions over the past several
years of economic volatility.
2023 MW data YTD: Arizona (165), California (1,148), Massachusetts (67), New York (518)
Note: System prices above $10/W and below $0.75/W were removed from the dataset. There were not enough
reported prices for systems above 5 MW in the dataset to show a trend over time.
Sources: Arizona Goes Solar (10/13/23); California Distributed Generation (8/31/23); Massachusetts Lists of
Qualified Generation Units (10/3/23); Solar Electric Programs Reported by NYSERDA (10/19/23).
$0.0
$1.0
$2.0
$3.0
$4.0
$5.0
$6.0
H1 H2 H1 H2 H1 H2 H1 H2 H1 H2 H1 H2 H1 H2
(part)
2017 2018 2019 2020 2021 2022 2023
System Price ($/W
dc
)
2.5–10 kW (2022 USD) 10–100 kW (2022 USD)
100–500 kW (2022 USD) 500 kW – 5 MW (2022 USD)
2.5–10 kW (nominal USD) 10–100 kW (nominal USD)
100–500 kW (nominal USD) 500 kW – 5 MW (nominal USD)
NREL | 37NREL | 37
$0
$1
$2
$3
$4
$5
$6
$7
AZ CA MA NY AZ CA MA NY AZ CA MA NY AZ CA MA NY NY
2.5 kW–10 kW 10 kW–100 kW 100 kW–500 kW 500 kW–5 MW 5 MW+
System Price ($/W
dc
)
Distributed System Pricing From
Select States, H2 2023 (partial)
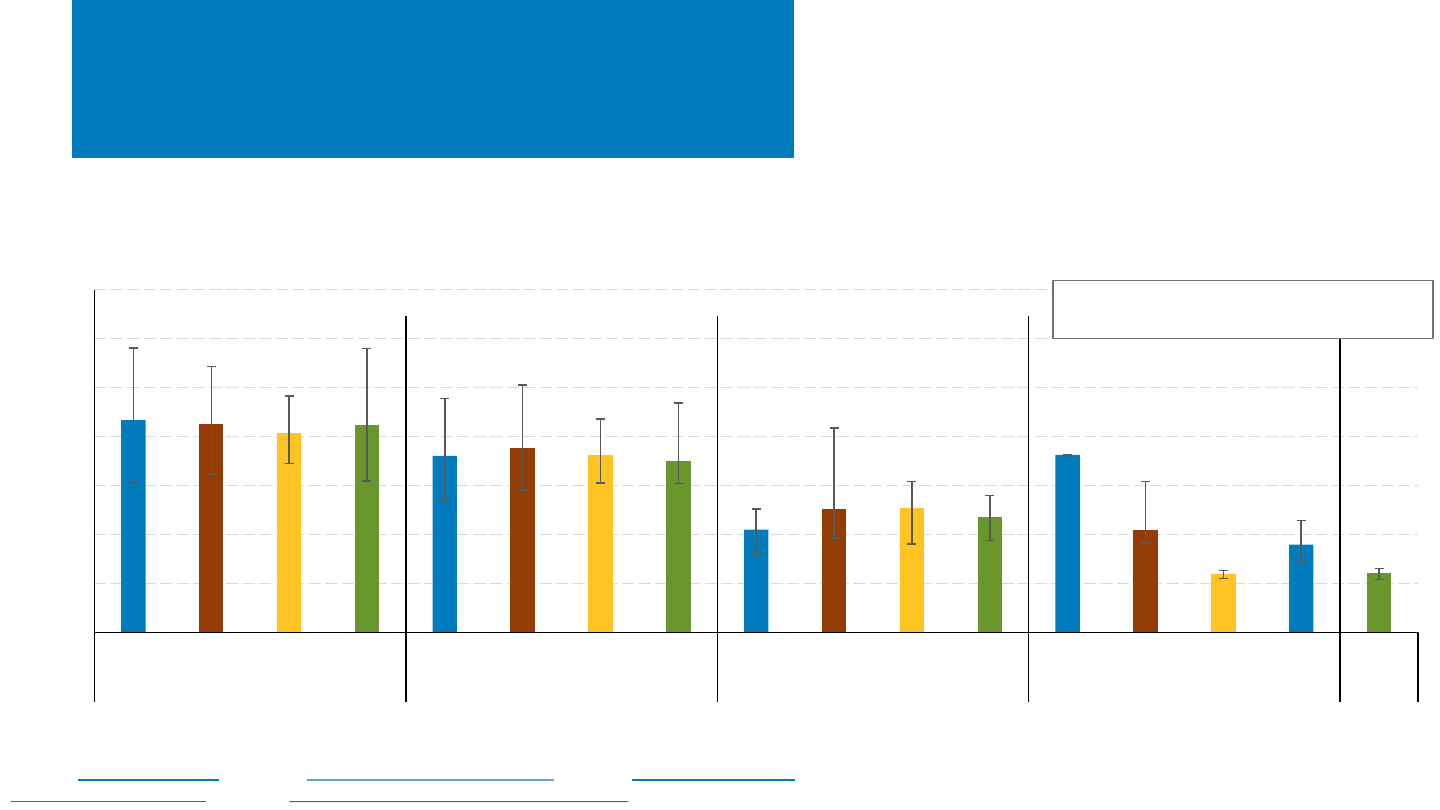
• For systems of 2.5–10 kW, nominal price changes varied
between H2 2022 and H2 2023 (partial):
– −2% in Arizona, − 0.2% in California, +4% in
Massachusetts, −1% in New York.
• Large system prices are based on relatively few systems.
– For example, Arizona only installed one system of
500 kW–5 MW in H2 2023 (partial).
• In addition to price differences based on system size, there is
variation between states and within individual markets.
• Dollar-per-watt prices generally decrease as system size increases.
Bars represent the median, with error bars
representing 80
th
and 20
th
percentiles.
2023 MW data YTD: Arizona (165), California (1,148), Massachusetts (67), New York (518)
Note: System prices above $10/W and below $0.75/W were removed from the dataset.
Sources: Arizona Goes Solar
(10/13/23); California Distributed Generation (8/31/23); Massachusetts Lists of
Qualified Generation Units (10/3/23); Solar Electric Programs Reported by NYSERDA (10/19/23).
NREL | 38NREL | 38
Residential U.S. PV+Storage
Pricing
2023 YTD residential PV+storage sample, after data cleaning (MW
dc
): Arizona (11), California (54), Massachusetts (6)
Sources: Arizona Goes Solar (10/13/23); California Distributed Generation (8/31/23); Massachusetts Lists of Qualified Generation Units (10/3/23).
$0
$1,000
$2,000
$3,000
$4,000
$5,000
$6,000
$7,000
$8,000
$9,000
2018 2019 2020 2021 2022 2023
n= 3,380 n= 4,248 n= 7,833 n= 13,226 n= 20,171 n= 8,064
System Price
PV+Storage ($/kWdc)
PV+Storage ($/kWac)
PV+Storage ($/kWh)
• In 2023 YTD, residential PV+storage systems
in Arizona, California, and Massachusetts
had a median system price of $3,580/kWh,
or $5,862/kW
ac
($5,629/kW
dc
)—an increase
of 7%–22% compared with full 2022 median
values.
– Most of these systems offer 2–3 hours of
storage.
– Units represent total system price
divided by the capacity of the battery
(kWh) or the capacity of the PV system
(kW).
Bars represent the median, with error bars
representing the 80
th
and 20
th
percentiles.
NREL | 39NREL | 39
Residential U.S. PV+Storage
Pricing
• During 2023 YTD, residential PV+storage
system prices in Arizona, California, and
Massachusetts varied between states and
internally.
– Prices may vary due to differences in
storage power and capacity, permitting
and interconnection differences, local
competitive factors, and installer
experience.
• Compared with full median 2022 values,
prices (in dollars per kW
dc
of PV capacity)
increased in 2023 YTD in California (9%) while
decreasing in Massachusetts (4%) and Arizona
(1%).
$0
$1,000
$2,000
$3,000
$4,000
$5,000
$6,000
$7,000
$8,000
$9,000
2018 2019 2020 2021 2022 2023
System Price ($/kW
dc
)
CA
AZ
MA
2023 YTD residential PV+storage sample, after data cleaning (MW
dc
): Arizona (11), California (54), Massachusetts (6)
Sources: Arizona Goes Solar (10/13/23); California Distributed Generation (8/31/23); Massachusetts Lists of Qualified Generation Units (10/3/23).
Bars represent the median, with error bars
representing the 80
th
and 20
th
percentiles.
NREL | 40NREL | 40
Residential Storage Price
Reported by EnergySage
• The median reported price by EnergySage for
residential PV systems increased 4.8% y/y.
– Despite the median national average pricing
increasing, prices remained flat or dropped in 6
of the top 10 markets.
• Residential storage system price varied by state. In
H1 2023, the median price of a residential storage
system in Massachusetts was 16% higher than the
median price of a residential storage system in
North Carolina.
– In the EnergySage dataset, the median cost of a
battery in the top 10 states ranged from
$13,000 to $19,000.
Note: Price based on winning quoted price.
Source: EnergySage, Solar Marketplace Intel Report H2 2022 – H1 2023.
$1,000
$1,050
$1,100
$1,150
$1,200
$1,250
$1,300
$1,350
$1,400
H2 H1 H2 H1 H2 H1
2020 2021 2022 2023
Median Gross Costs ($/kWh)
Cost Over Time
$1,150
$1,200
$1,250
$1,300
$1,350
$1,400
$1,450
$1,500
$1,550
NC TX FL CA AZ US GA CO MA PA VA
Median Gross Costs ($/kWh)
Cost by State, H1 2023
NREL | 41NREL | 41
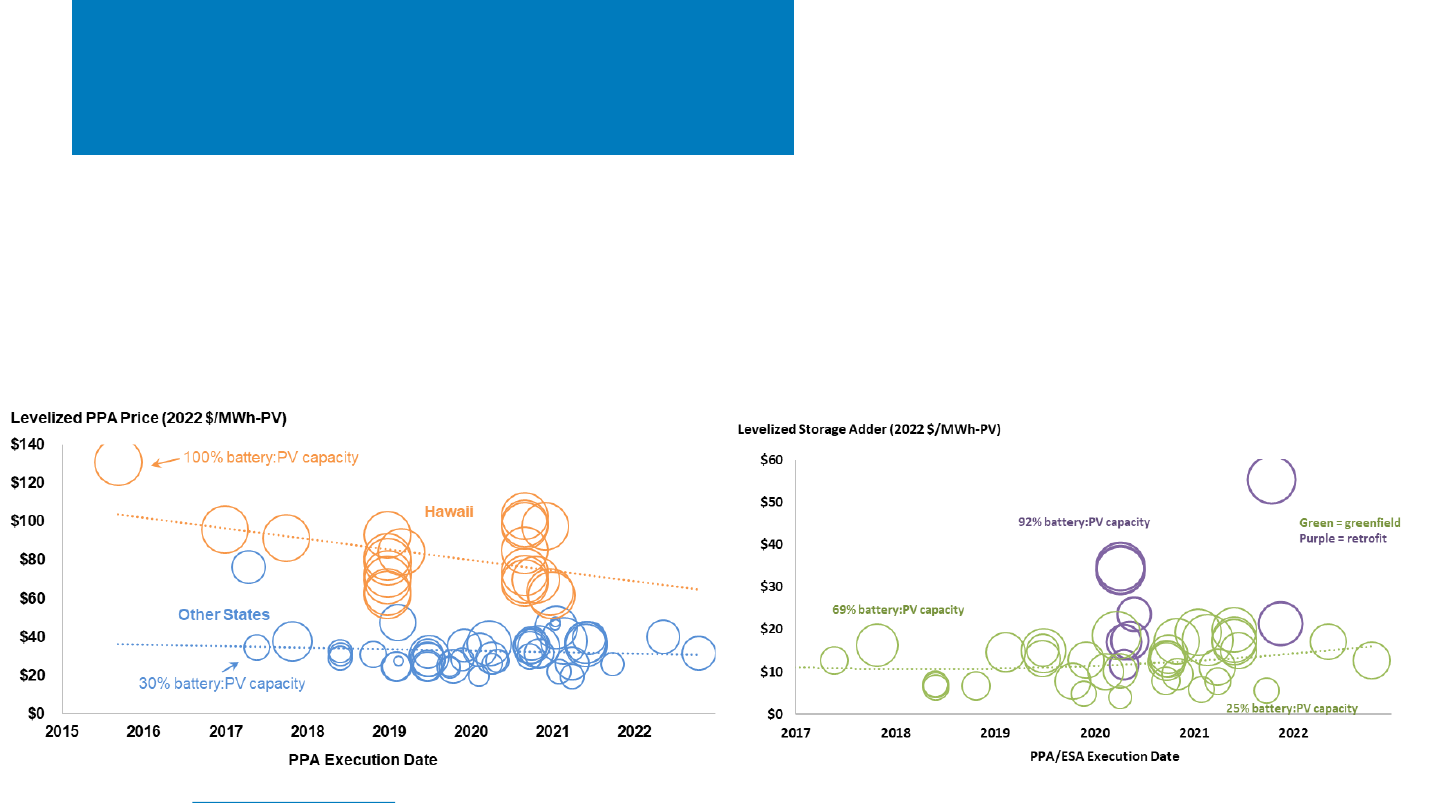
U.S. Utility-Scale PV PPA
Pricing
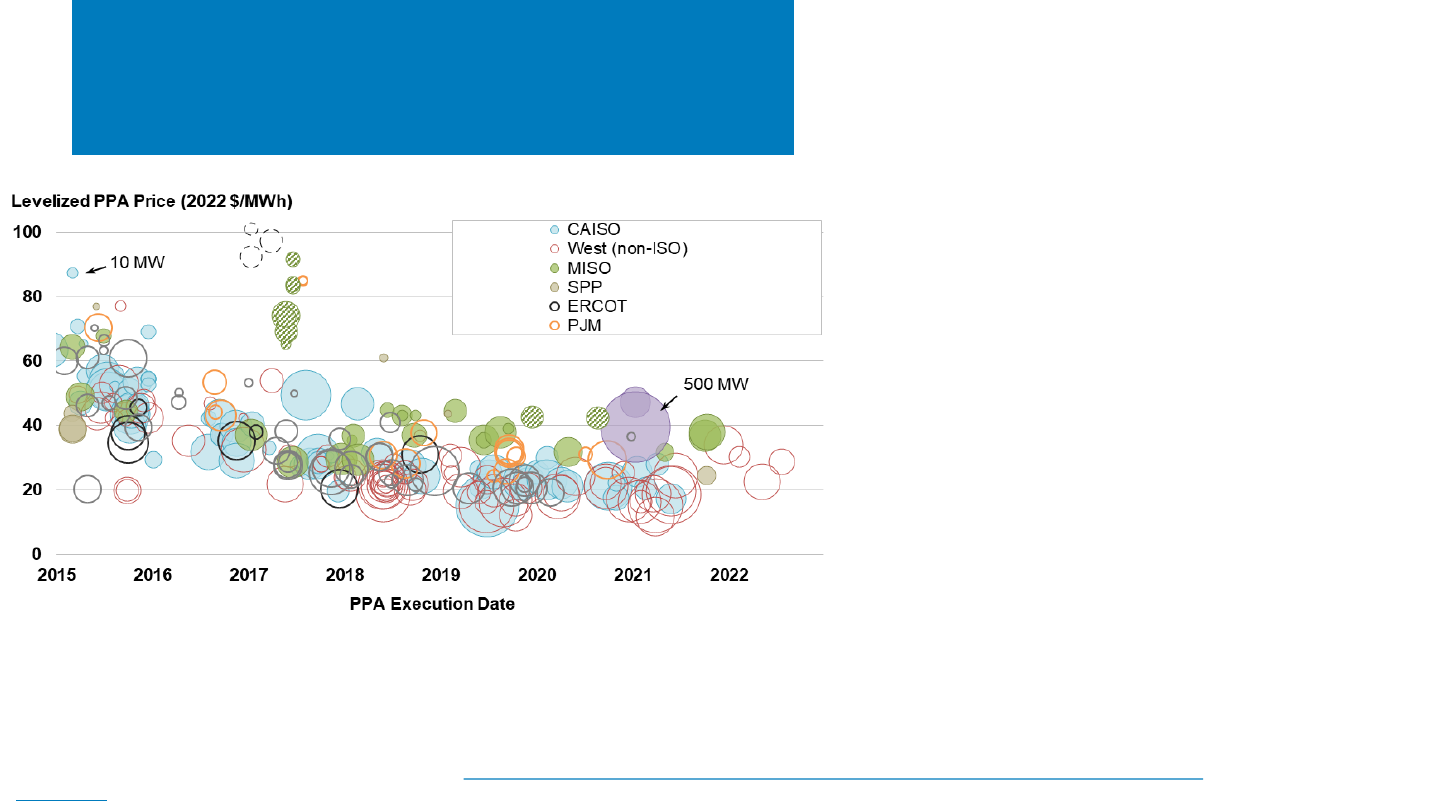
• Average PPA prices in the Lower 48 fell by
~87% (or ~19%/year) from 2009 to 2019,
but they have been stagnant (or slightly
higher) ever since.
• The most recent PPAs in the LBNL sample
are priced around $20–$30/MWh for
projects in CAISO and the non-ISO West
and at $30–$40/MWh for projects
elsewhere in the continental United States.
• Solar PPA prices are now often competitive
with wind PPA prices, as well as the cost of
burning fuel in existing gas-fired
generators.
Source: Bolinger, M., J. Seel, C. Warner and D. Robson. 2023. Solar Empirical Trends in Project Technology, Cost, Performance, and PPA Pricing in the United States:
2023 Edition
. Berkeley, CA: Lawrence Berkeley National Laboratory
NREL | 42NREL | 42
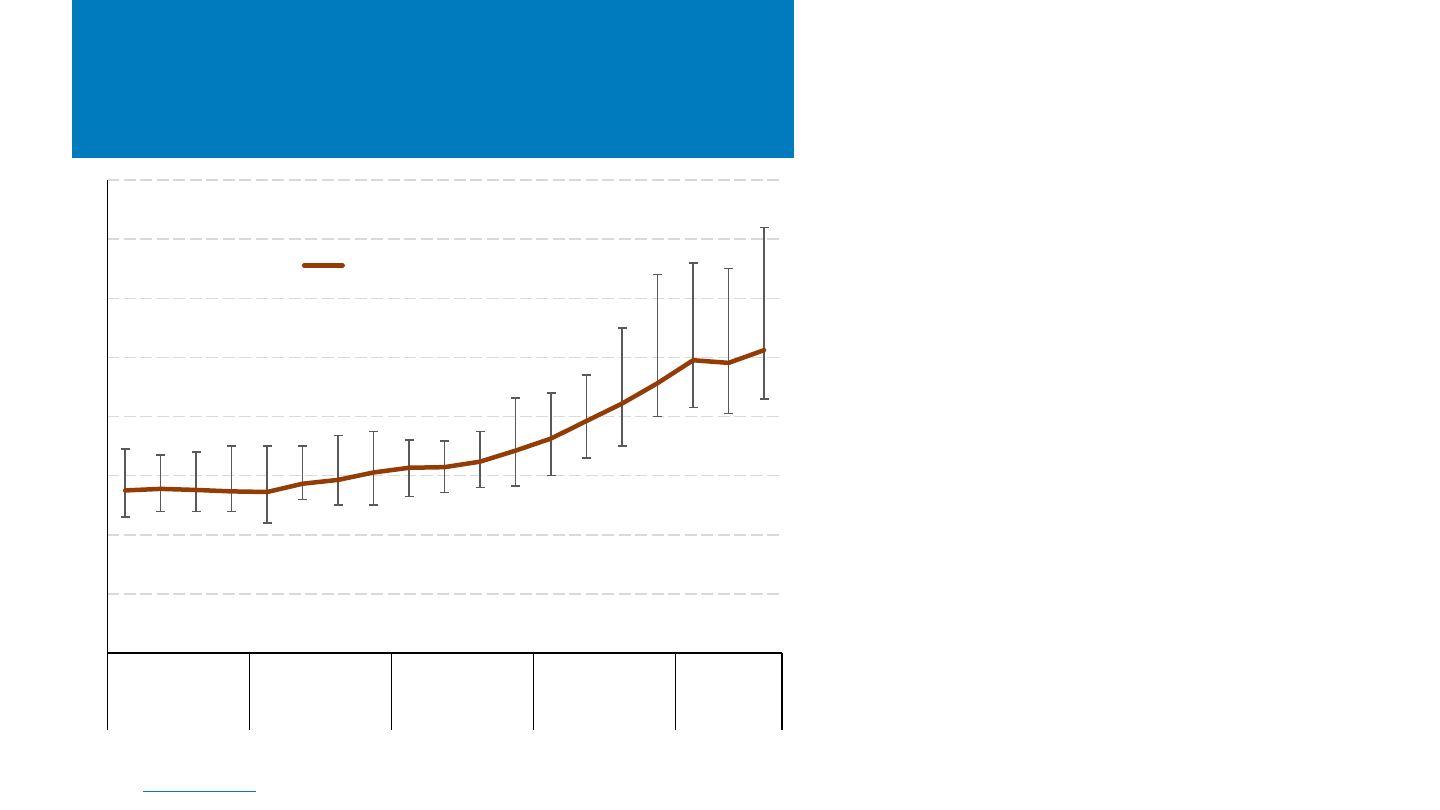
U.S. Utility-Scale PV+Battery
PPA Pricing From LBNL
• The upward trend of “levelized storage adders”
(premiums for PV+battery PPAs relative to standalone
PV PPAs) continued in 2022 despite the year’s modest
battery system sizes.
• Overall, the storage adder increases linearly with
increasing battery-to-PV capacity ratio:
– ~$11/MWh PV at 50%
– ~$18/MWh PV at 80%.
• New PV+battery system capacity reached a record high in 2022 with 26 new
plants (2.2 Gw
ac
PV), plus 9 retrofitted systems (1.4 GW
ac
PV).
• Average combined costs for a sample of PV+battery systems decreased from
$4.15/W
ac
PV in 2021 to $2.19/W
ac
PV in 2022, as the proportion of new builds
increased and the average storage duration decreased (from 3.2 to 2.7 hours).
• Sampled hybrid PPA prices have declined over time but have leveled off
recently outside of Hawaii, where the battery-to-PV capacity ratio is always
100%.
Source: Bolinger et al. 2023. Utility-Scale Solar, 2023 Edition. Lawrence Berkeley National Laboratory.
Bubble area = battery:PV capacity
$/MWh-PV time trend: Answers “how much does
storage add to my standalone PV PPA Price?”
NREL | 43NREL | 43
U.S. Solar PPA Pricing
(LevelTen)
Source: LevelTen, PPA Price Index.
• LevelTen reports that following a modest dip
in prices in Q2, U.S. utility-scale PV PPA prices
increased 4% in Q3 2023 despite many
markets remaining relatively flat or declining
in price.
– LevelTen attributes this change to rising
prices in PJM and SPP and the inclusion of
high-priced ISO-NE in the index.
– PJM prices were likely pushed up by an
overfilled interconnection queue and
permitting challenges.
$0
$10
$20
$30
$40
$50
$60
$70
$80
Q1 Q2 Q3 Q4 Q1 Q2 Q3 Q4 Q1 Q2 Q3 Q4 Q1 Q2 Q3 Q4 Q1 Q2 Q3
2019 2020 2021 2022 2023
25th Percentile PPA Offer Price ($/MWh)
National average across
markets
NREL | 44NREL | 44
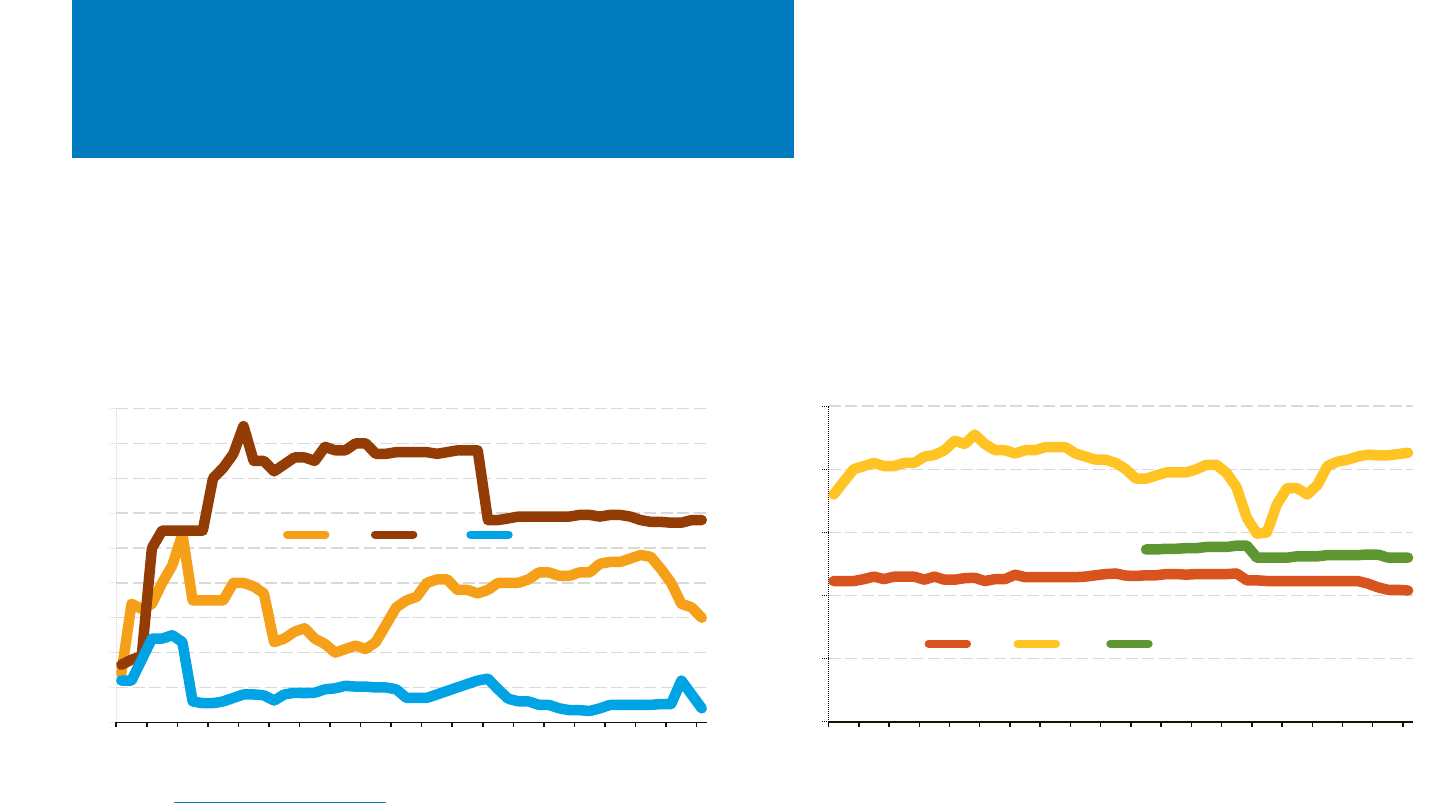
SREC Pricing
Source: SRECTrade, https://www.srectrade.com/, accessed 10/20/23.
• Solar renewable energy certificate (SREC) pricing has been relatively flat in 2023, particularly for legacy
programs like New Jersey and Massachusetts, which are not accepting new projects.
• However, potential programmatic or supply/demand changes can still impact markets, likely the reason
for the ~40% price decline of PA SRECs in 2023 or the 140% increase in price for Ohio SRECs in August
2023 before relapsing in September and October.
$0
$10
$20
$30
$40
$50
$60
$70
$80
$90
Jan-19
Apr-19
Jul-19
Oct-19
Jan-20
Apr-20
Jul-20
Oct-20
Jan-21
Apr-21
Jul-21
Oct-21
Jan-22
Apr-22
Jul-22
Oct-22
Jan-23
Apr-23
Jul-23
Oct-23
Price Per SREC (Simple Average)
Lower-Priced Markets
PA MD OH In-state
$0
$100
$200
$300
$400
$500
Jan-19
Apr-19
Jul-19
Oct-19
Jan-20
Apr-20
Jul-20
Oct-20
Jan-21
Apr-21
Jul-21
Oct-21
Jan-22
Apr-22
Jul-22
Oct-22
Jan-23
Apr-23
Jul-23
Oct-23
Price Per SREC (Simple Average)
Higher-Priced Markets
NJ DC MA (SREC II)

NREL | 45
Global Solar Deployment1
U.S. PV Deployment
2
PV System Pricing
3
Global Manufacturing
4
Component Pricing
5
U.S. PV Imports
6
7 PV Domestic Content
Agenda
• According to Infolink (formerly PV Infolink), the top 10
module manufacturers were responsible for 160 GW
(+57% y/y) in H1 2023 and the top 5 cell manufacturers
together shipped 84 GW of cells (+49% y/y).
• Since the passage of the IRA, more than 240 GW of
manufacturing capacity has been announced across the
solar supply chain, representing more than 22,000
potential jobs and more than $12 billion in announced
investments across 72 new facilities or expansions.
• In H1 2023, the U.S. shipped 3.1 GW of PV modules—an
increase of 0.8 GW from H1 2022.

NREL | 46NREL | 46
PV Shipment Rankings
• According to Infolink, the top 10 module
manufacturers were responsible for 160 GW of
shipments (+57% y/y) in H1 2023.
– The top four manufacturers shipped more than
100 GW in H1 2023, widening the gap from other
leading manufacturers.
– Tongwei expanded into module manufacturing
last year, launching into the top 10.
– M10/182 mm and G12/210 mm modules
accounted for 98% of shipments, up from 80% in
H1 2022.
– N-type modules accounted for 18% of sales.
• The top five cell manufacturers together shipped 84.4
GW of cells in the H1 2023 (+49% y/y), accounting for
72% of 2022 annual shipments.
– 87% of top five cell manufacturer shipments in
H1 2023 used PERC technology, and another 12%
used TOPCon.
– M10 and M12 formats represented 75% and 21%
of top five cell manufacturer shipments in H1
2023.
Sources: InfoLink: 2023H1 cell shipment rankings, 2023H1 Module shipment ranking, PVTech (09/01/23, 09/05/23).
Rank H1 2023 Shipments
Cells Modules
1 Tongwei Jinko Solar (30.8 GW)
2 Aiko
⯅
LONGi (26.6 GW)
3
⯅
Solar Space
▼
Trina (27 GW)
4
▼
Runergy JA Solar (24.0 GW)
5
⯅
Jietai Canadian Solar (14.3 GW)
6 Astronergy/
⯭
Tongwei (8-9 GW)
7
8 Risen Energy (8-9 GW)
9
⯯
DAS Solar
10
⯯
First Solar (5.3 GW produced)

NREL | 47NREL | 47
PV Manufacturers’ Margins
• PV manufacturers, mostly Chinese companies,
have generally been profitable since 2019.
• Margins have steadily increased since 2022
due to increased shipments from leading
manufacturers.
– Increased shipments were partially offset
by reduction in ASP.
– The median gross margin of the publicly
traded PV companies represented to the
left was flat q/q, though up 60% y/y. The
median operating margin was up 20% q/q
and 125% y/y.
• There continues to be significant variation by
individual companies as individual factors
come into play, although variation has been
substantially less since 2019.
Lines represent the median, with error bars representing 80
th
and 20
th
percentiles for the following companies in Q1 2023: Canadian Solar, First Solar, JA Solar, Jinko Solar,
LONGi, Maxeon, Motech Industries, REC Silicon, Renesola, Risen, Shanghai Aiko, Shanghai Aerospace, Tongwei, Trina Solar, and United Renewable Energy. Margin data from
Hanwha Q Cells, Sunpower, and Yingli are also included from Q1 2010 to Q2 2020 where available.
Note: Gross margin = revenue – cost of goods sold (i.e., the money a company retains after incurring the direct costs associated with producing the goods or services it
sells); operating margin = gross margin minus overhead and operating expenses (i.e., the money a company retains before taxes and financing expenses).
Sources: Company figures based on public filings and finance.yahoo.com; PVTech (10/11/22).
-40%
-30%
-20%
-10%
0%
10%
20%
30%
40%
50%
Q1Q2Q3Q4Q1Q2Q3Q4Q1Q2Q3Q4Q1Q2Q3Q4Q1Q2Q3Q4Q1Q2Q3Q4Q1Q2
2017 2018 2019 2020 2021 2022 2023
Margins
gross median
operating median
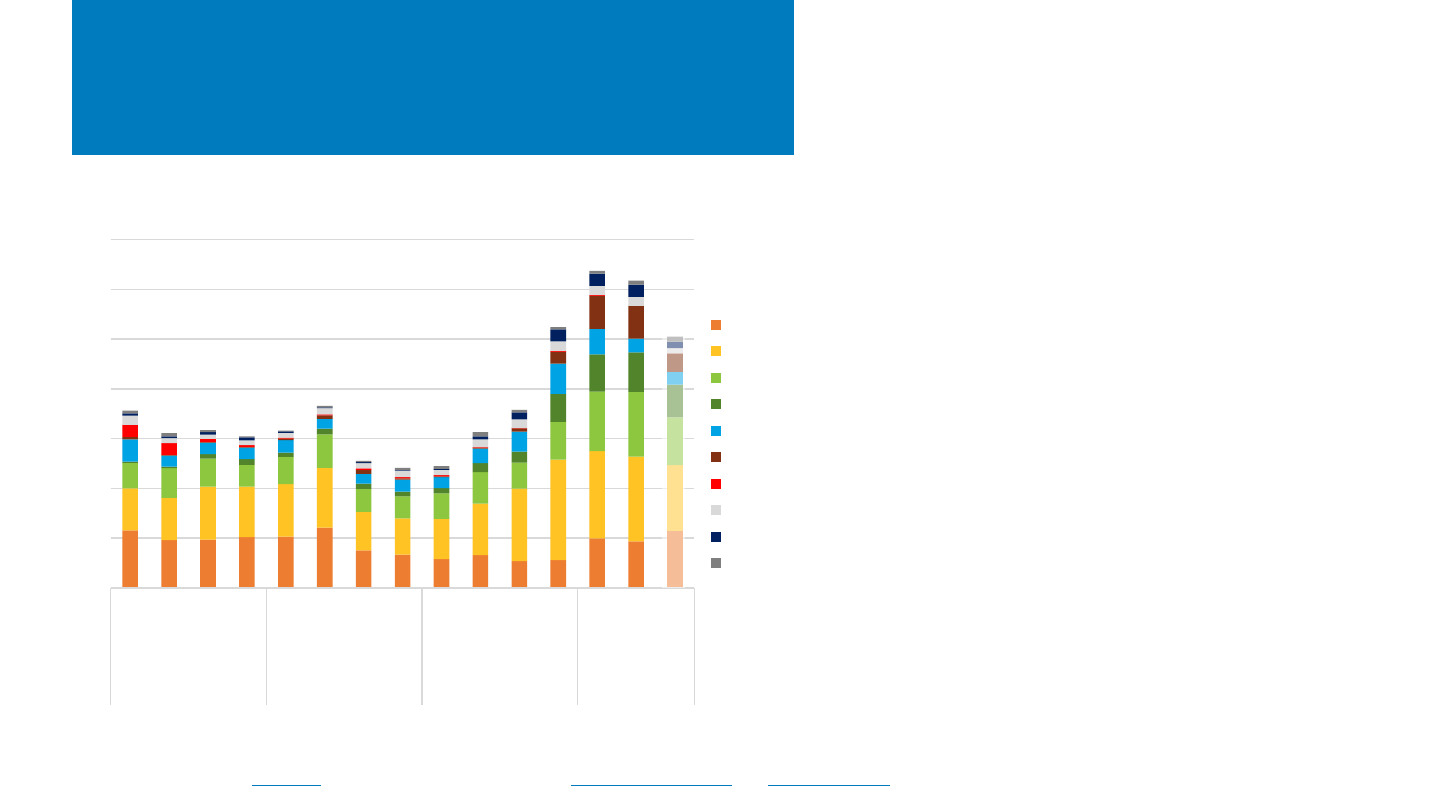
NREL | 48NREL | 48
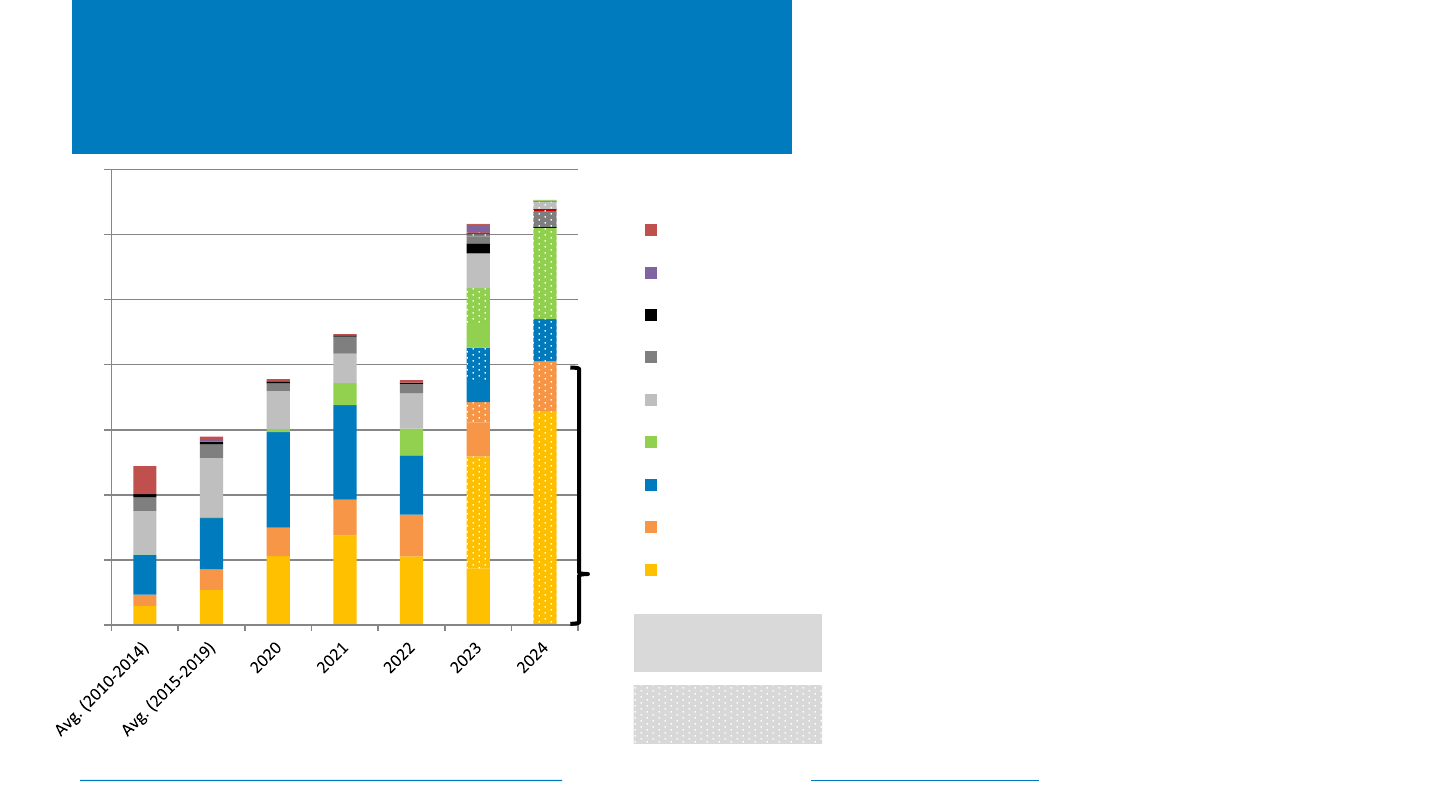
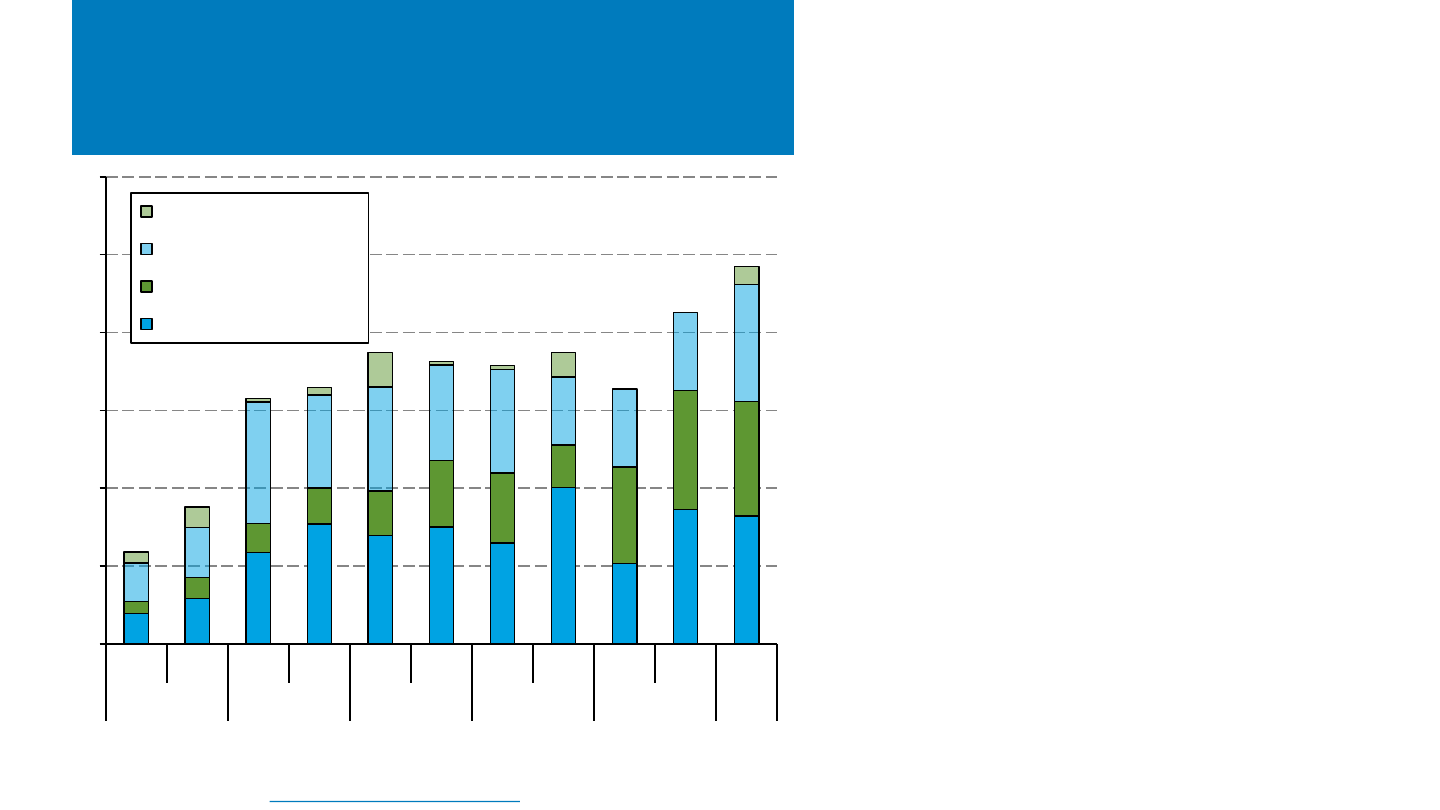
U.S. PV Manufacturing
• In H1 2023, the U.S. shipped 3.1 GW of PV modules—
an increase of 0.8 GW from H1 2022.
• Since 2018, U.S. module manufacturing has increased
by approximately 4X, with the larger growth, both in
terms of production and manufacturing capacity,
coming from thin-film panels.
• Over the past year, c-Si production and capacity has
been the growth leader, with production and capacity
growing 59% and 55% from H1 2022 to H1 2023,
respectively.
– At the end of Q2 2023, the U.S. had an annual
module manufacturing capacity of approximately
10 GW.
– However, this growth is relatively small compared
to the growth expected to come at the end of 2024
and 2025 based on corporate announcements of
domestic manufacturing capacity additions as a
result of the passage of IRA.
• First Solar announced in September that it would
have 6 GW of U.S. manufacturing by the end of
2023—significantly higher than what Wood
Mackenzie and SEIA report for H1 2023.
0
1
2
3
4
5
6
H1 H2 H1 H2 H1 H2 H1 H2 H1 H2 H1
2018 2019 2020 2021 2022 23
U.S. PV Manufacturing (GW)
Excess Thin-film Capacity
Excess c-Si Capacity
Thin-film Production
c-Si Production
Sources: Wood Mackenzie/SEIA: U.S. Solar Market Insight: Q3 2023.
0
20
40
60
80
100
120
140
Polysilicon c-Si wafers c-Si cells PV modules Inverters Module
Parts
Tools Tracking/
Racking
Annual Manufacturing Capacity (GW
dc
)
Manufacturing Announcements by Supply Chain Segment
post-IRA (CdTe modules)
post-IRA
pre-IRA (CdTe modules)
pre-IRA
operating pre-IRA (CdTe)
operating pre-IRA (c-Si)
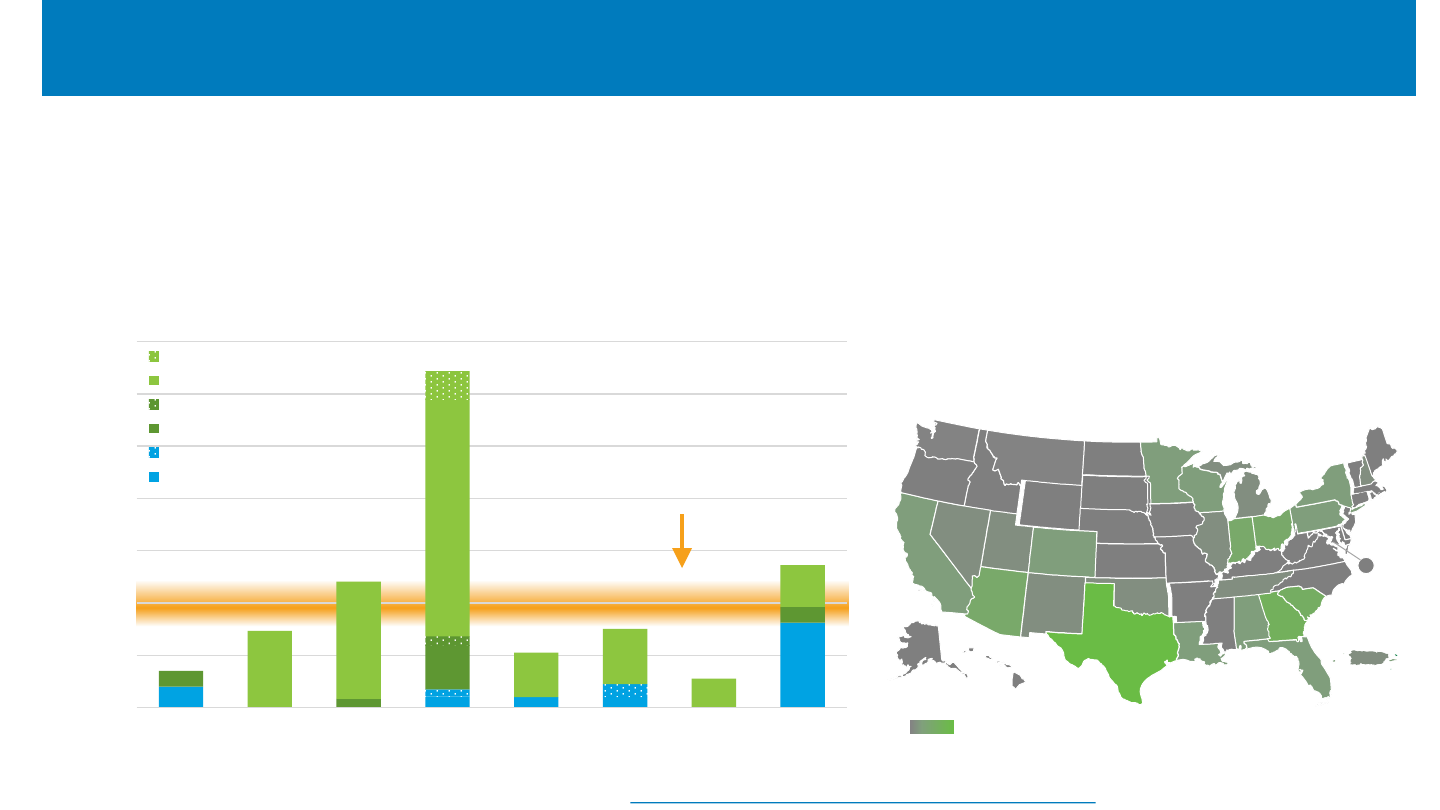
• Since the passage of the IRA, >240 GW of manufacturing capacity has been announced across the solar supply chain, representing
more than 22,000 potential jobs and more than $12 billion in announced investments across 72 new facilities or expansions.*
Sources: Internal DOE tracking of public announcements and BNEF Global PV Market Outlooks and Wood Mackenzie and SEIA Solar Market Insights Q2 2022 and Q2 2023.
*Not all announcements include facility locations, job, or investment numbers. See: Building America's Clean Energy Future | Department of Energy
IRA Impacts on U.S. Solar PV Manufacturing Capacity
These announcements post-IRA represent
potential investment in 23 states and Puerto Rico.
# of facilities* announced post-IRA
0 12
2
1
2
1
2
1
2A
1
12
3
2
2
1
1
3
1
3
2
6
5
2
2
1
DC
1
Projected 2025
U.S. PV Deployment
– 101 GW of solar module capacity (including 11 GW of CdTe)
– 45 GW of c-Si cell capacity
– 29 GW of c-Si wafer capacity
– 62 GW of BOS (including glass, encapsulant, backsheet,
junction boxes, inverters, trackers, tracker components, etc.)*
– Another 35 GW of solar manufacturing capacity had been
announced since the start of the Biden Administration prior to
the passage of IRA.
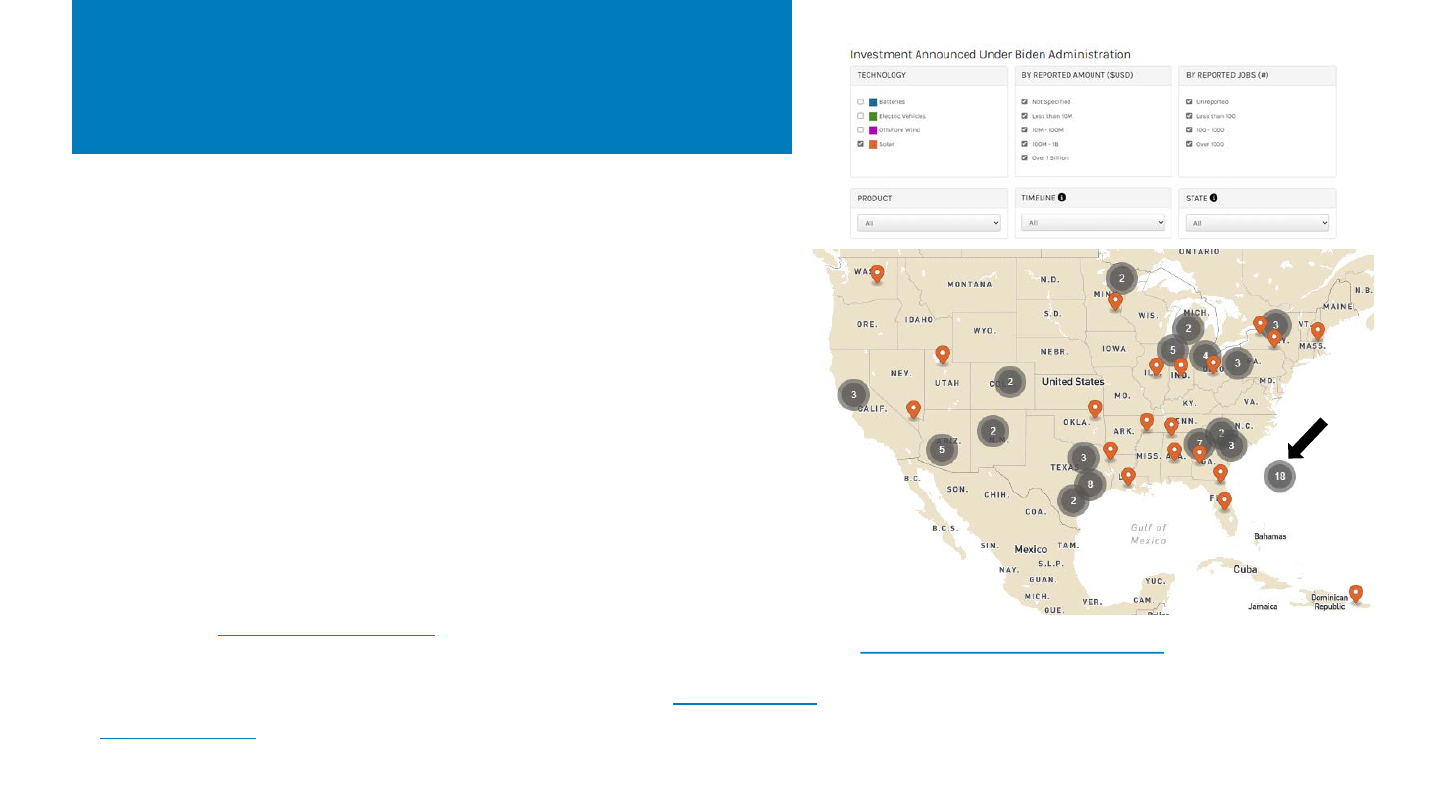
Recent Manufacturing News
• Notable announcements over the last several months include:
– Amphenol: ~1.2 million junction boxes/yr in Mesa, Arizona
– Fronius: 7 GW/yr of inverters in Portage, Indiana
– Great Lakes Solex: 6 GW/yr of modules in Aguadilla, Puerto Rico
– JinkoSolar: 0.8 GW/yr expansion of module production in
Jacksonville, Florida
– Navitas USA by Colby: 10 GW/yr of modules
– New East Solar: 2 GW/yr of modules in Phoenix, Arizona
– OMCO Solar: racking, tracker components, and frames in Alabama
– Re:Build Manufacturing: wafer production tools in Pennsylvania
– Suniva: 2.5 GW/yr of cells in Norcross, Georgia
– Trina: 5 GW/yr of modules in Wilmer, Texas.
• Qcells also recently announced that their module expansions in
Georgia are online, bringing their total domestic nameplate capacity
to 5.1 GW. First Solar’s new capacity in Lake Township has also been
brought online, bringing their total domestic nameplate capacity to 6.3 GW.
https://www.energy.gov/invest, updated 10-23-23
Facilities
announced
without
locations
2 GW
module
5 GW
module
5 GW
module
1 GW
module
5 GW
module
1.5 GW
cell,
1 GW
module
3 GW
cell, module
2 GW
cell, module
3.3 GW
wafer, cell, module
+ 2 GW
module
3.5 GW
CdTe module
3.3 GW
CdTe module
0
50
100
150
200
250
300
350
400
450
500
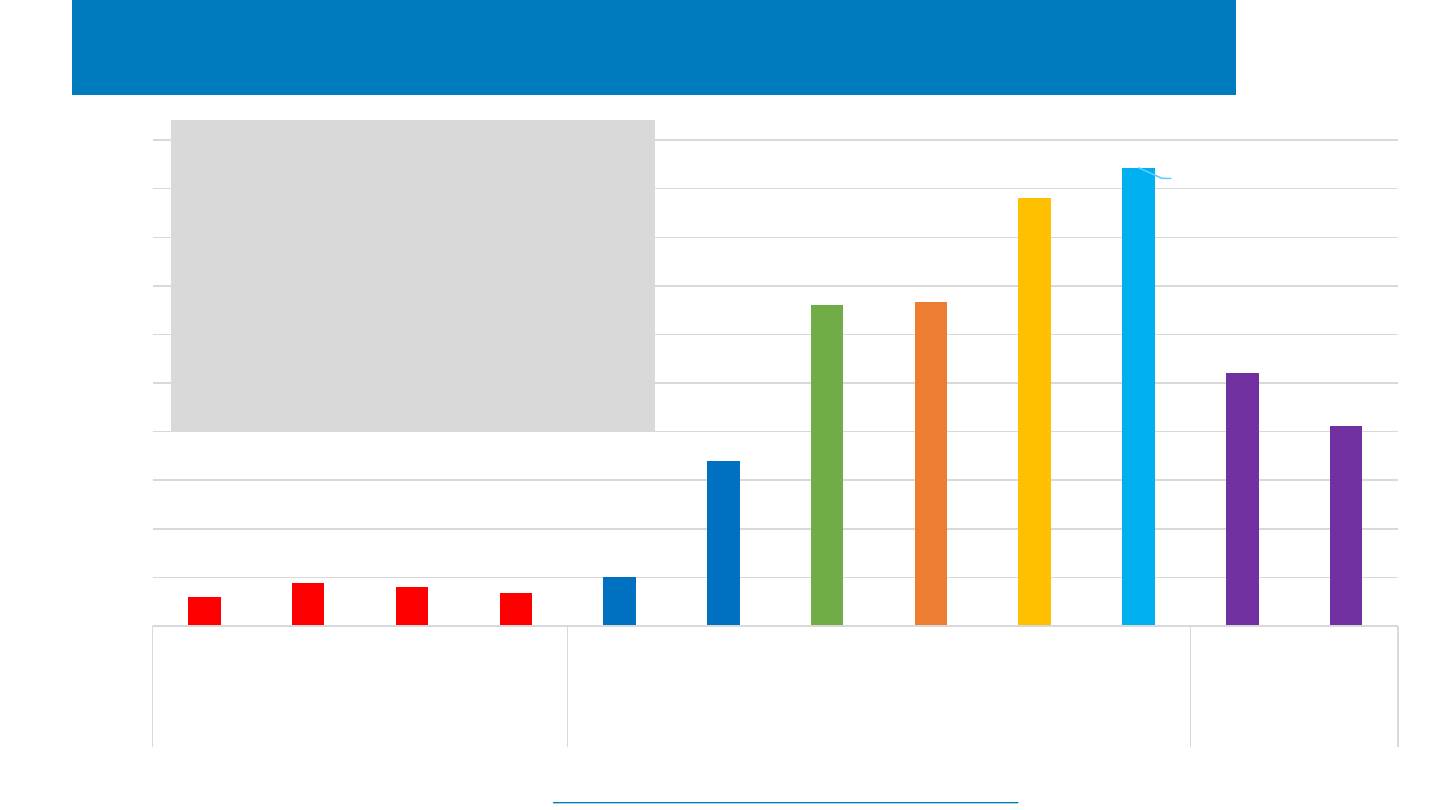
JA Solar Illuminate
USA
Trina Hounen Canadian
Solar
Heliene 3Sun USA
(Enel)
Maxeon Meyer
Burger
Qcells AL/LA OH
PRC-owned Companies Other Foreign First Solar
Announced Investment ($M/GW of module)
Domestic Clean Energy Announcements Costs
While announced investment numbers
should be taken with significant skepticism
(as there is no requirement for their
accuracy), there are some trends emerging:
• Module manufacturing on its own is
~$40M/GW.
• Module+cell manufacturing is nearly an
order of magnitude higher, at
~$300M/GW, which is comparable to
CdTe module production.
Sources: Internal DOE tracking of public announcements as of 10-23-23. *Not all announcements include facility locations, job, or investment numbers and announcements
are conditional on financing, funding, site control, and other factors. See: Building America's Clean Energy Future | Department of Energy
NREL | 52NREL | 52
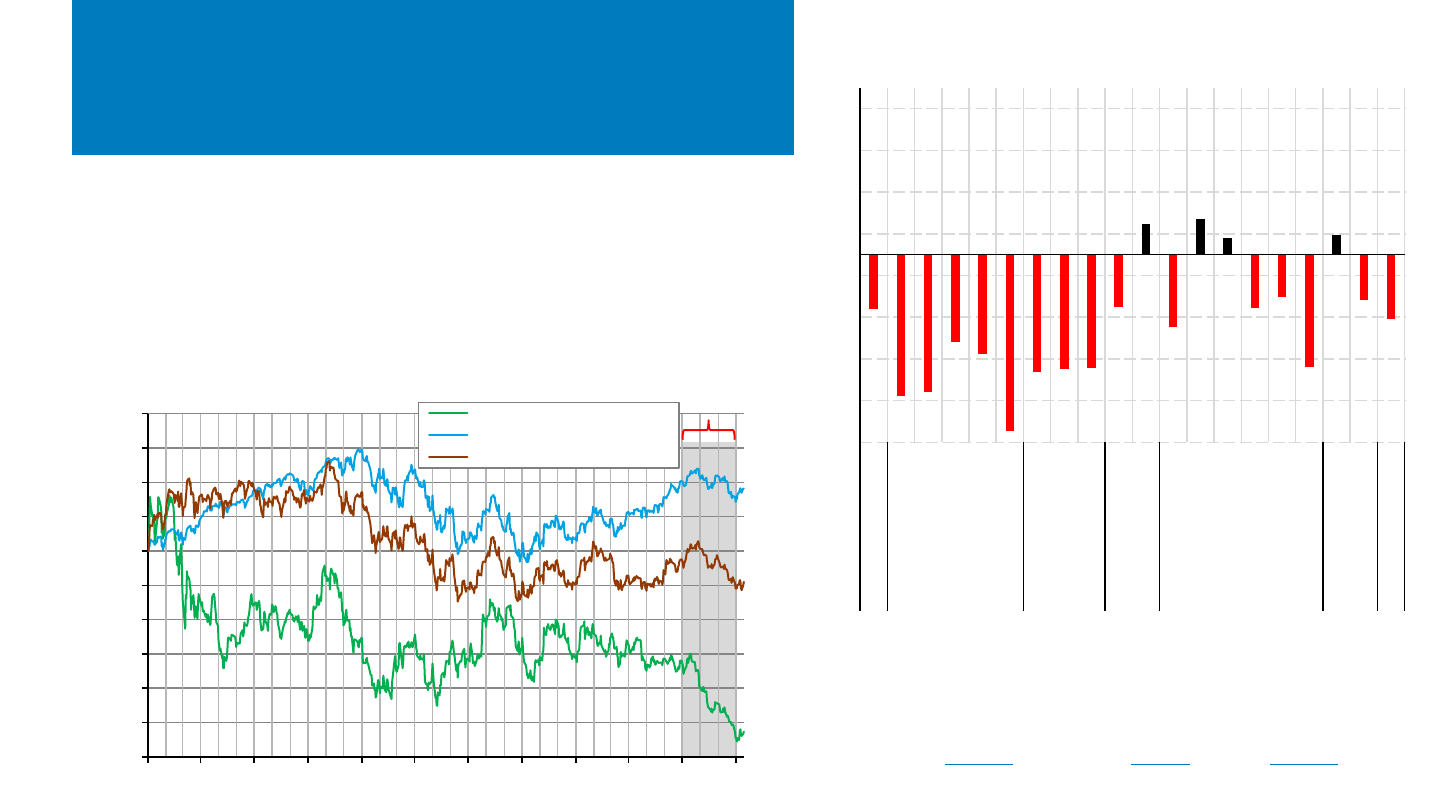
-60%
-50%
-40%
-30%
-20%
-10%
0%
10%
20%
30%
40%
Jan-21 Apr-21 Jul-21 Oct-21 Jan-22 Apr-22 Jul-22 Oct-22 Jan-23 Apr-23 Jul-23 Oct-23
% Change (Index: 01/04/21
Adjusted Close)
Invesco Solar ETF (TAN)
S&P 500 Index
iShares Russell 2000 ETF
Stock Market Activity
The Invesco Solar ETF fell 27% in Q3 2023 vs. a 4%–6% slide across the
broader market. One reason was a net global outflow from renewable energy
funds—which reached a record $1.4 billion in Q3 2023. The profitability of
many renewable energy companies has been reduced by high interest rates
and material costs as well as project delays. Solar companies have also faced
overcapacity across the silicon supply chain, large module inventories, and
intense competition. In addition, climate-related stocks beyond the
renewable energy sector have become increasingly popular.
Note: The TAN index is weighted toward particular countries and sectors. As of
10/17/23, 54% of its funds were in U.S. companies and 20% were in Chinese
companies. Its top 10 holdings, representing 62% of its value, were Enphase,
SolarEdge, First Solar, GCL, Xinyi, Sunrun, Array Technologies, Shoals, Hannon
Armstrong, and Encavis.
Sources: Invesco (10/17/23), PV Magazine (9/12/23), Reuters (10/10/23).
Q3 2023
-90%
-70%
-50%
-30%
-10%
10%
30%
50%
70%
Atlantica Yield
Sunworks
SunPower
Sunnova
Sunrun
Azure Power
Ginlong
Enphase Energy
SolarEdge
Soltec Power
Array Tech.
Solargiga Energy
Tainergy Tech
First Solar
Jinko Solar
Canadian Solar
Shunfeng
Wacker Chemie
Daqo
Meyer Burger
Yieldcos Installers Inverters Trackers PV Manufacturers Poly Equip.
Individual Stock Performance (Q1-Q3 2023)

NREL | 53
Global Solar Deployment1
U.S. PV Deployment
2
PV System Pricing
3
Global Manufacturing
4
Component Pricing
5
U.S. PV Imports
6
7 PV Domestic Content
Agenda
• Global polysilicon spot prices rose 35% from late June
($7.84/kg, below the weighted average production cost
of $8.2/kg) to early October ($10.55/kg).
• Global module prices reached yet another record low,
falling 21% between late June and early October to
$0.14/W
dc
.
• In Q3 2023 (first 2 months), the average U.S. module
price ($0.33/W
dc
) was down 11% q/q and down 23% y/y,
but at a 98% premium over the global spot price for
monofacial monocrystalline silicon modules.
NREL | 54NREL | 54
PV Value Chain Global Spot
Pricing
Source: BloombergNEF, Solar Spot Price Index (10/13/23); BloombergNEF, Bimonthly PV Index (9/19/23).
• Global polysilicon spot prices rose 35%
from late June ($7.84/kg, below the
weighted average production cost of
$8.2/kg) to early October ($10.55/kg).
– China’s polysilicon production increased
91% between H1 2022 and H1 2023.
– Additional polysilicon factories are
scheduled to come online in H2 2023.
• During the same period, global prices
decreased for wafers (3%) and cells (14%).
• Global module prices reached yet another
record low, falling 21% between late June
and early October to $0.14/W
dc
.
– Large module inventories and
expectation of still-lower prices in
Europe and Brazil as well as intense
competition among manufacturers
depressed demand and prices.
– These low module prices threaten the
profitability of many module
manufacturers.
$0
$5
$10
$15
$20
$25
$30
$35
$40
$45
$0.00
$0.05
$0.10
$0.15
$0.20
$0.25
$0.30
Jan-20
Apr-20
Jul-20
Oct-20
Jan-21
Apr-21
Jul-21
Oct-21
Jan-22
Apr-22
Jul-22
Oct-22
Jan-23
Apr-23
Jul-23
Oct-23
Average Polysilicon Spot Price ($/kg)
Average Wafer, Cell, and Module Spot Price ($/
W
dc
)
Cells, mono ($/Wdc) Monofacial modules, mono ($/Wdc)
Bifacial modules, 210 mm, mono ($/Wdc) Wafers, mono M10 ($/Wdc)
Polysilicon ($/kg)
Monofacial modules
Cells
Wafers
Bifacial modules
Polysilicon (right axis)
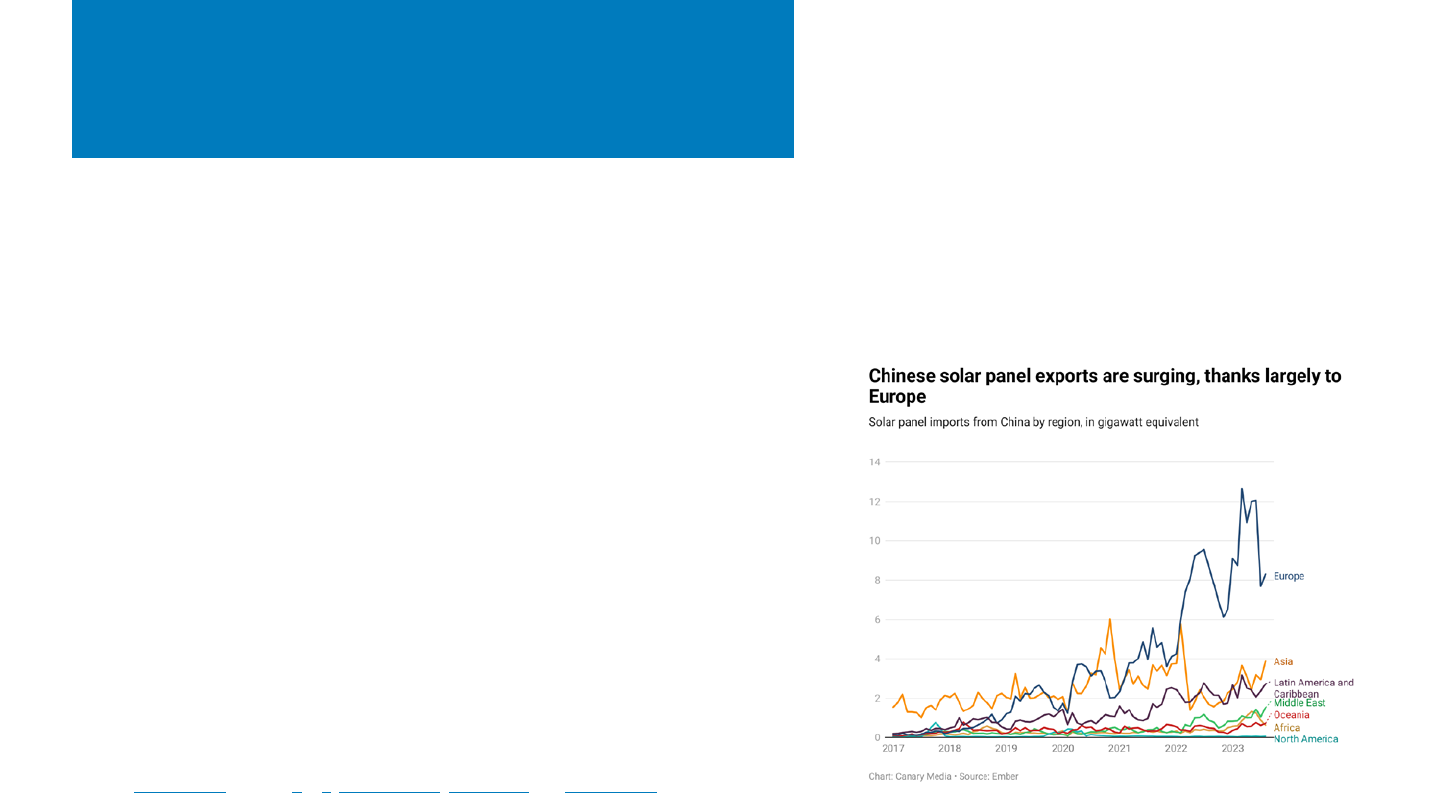
• Between 40 and 100 GW of unsold modules in European stores, mainly in Rotterdam, Netherlands.
• The European Solar Manufacturing Council (ESMC) wrote an open letter calling for the EU to protect European
manufacturers against “intentional and purposeful attack by Chinese PV manufacturers.”
– They called for a ban on forced labor products, incentives for domestic products, and sanctioned
acquisition of European stock.
– European module production has supposedly fallen from
9 GW in 2022 to 1 GW in 2023, and they have more than
500 MW of produced modules in stock that they
cannot sell.
• Germany is considering imposing trade barriers on
Chinese-imported modules and components.
– SolarPower Europe has voiced opposition to such trade
barriers and instead recommended adjusting the EU State
Aid framework, adopting the EU Net-Zero Industry Act,
or creating a Solar Manufacturing Bank.
• Norwegian Crystals went bankrupt in August, and Norsun
announced a temporary halt and layoffs in September.
Sources: pv magazine, PVTech 1 & 2, Canary Media, Bernreuter and pv magazine
Europe PV Module Oversupply
NREL | 56NREL | 56
Module Prices:
Global vs. United States
Source: BloombergNEF, Solar Spot Price Index (10/13/23); BloombergNEF, Bimonthly PV Index (9/19/23); EIA, Monthly Solar Photovoltaic Module Shipments Report
(10/17/23); Wood Mackenzie & SEIA, US Solar Market Insight: Q3 2023 (9/23).
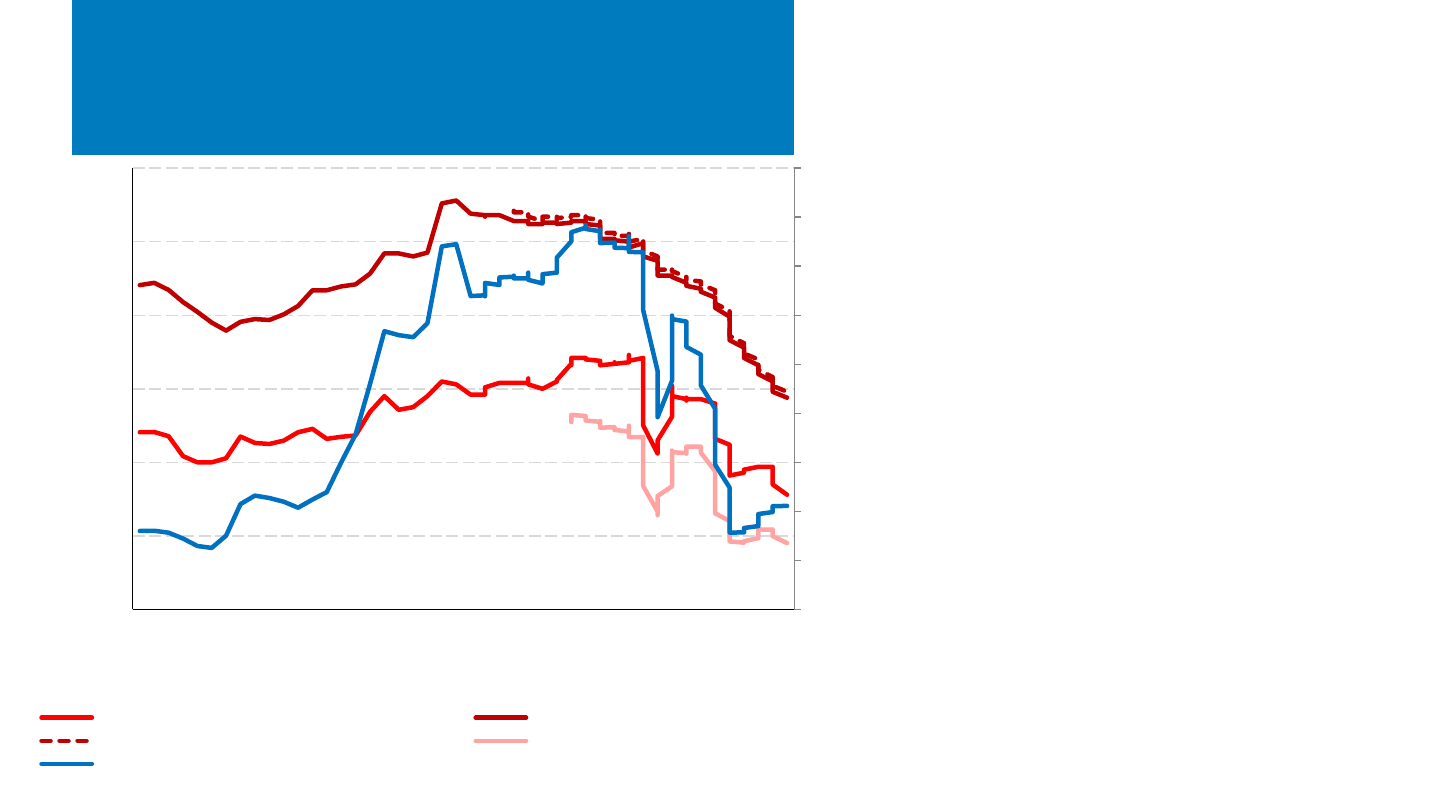
• In Q3 2023 (first 2 months), the average U.S.
module price ($0.33/W
dc
) was down 11% q/q
and down 23% y/y, but at a 98% premium
over the global spot price for monofacial
monocrystalline silicon modules.
• The directional trend in U.S. module prices
realigned with the trend in global module
prices, although the difference between the
two prices remained the same ($0.16/W
dc
).
– U.S. prices were depressed by oversupply
and large distributor inventories.
– Detainment periods for imported modules
under the Uyghur Forced Labor Prevention
Act (UFLPA) have fallen from months to
weeks as major manufacturers have
documented their avoidance of forced
labor, which is freeing up supply and
reducing prices.
$0.00
$0.05
$0.10
$0.15
$0.20
$0.25
$0.30
$0.35
$0.40
$0.45
Q1 Q2 Q3 Q4 Q1 Q2 Q3 Q4 Q1 Q2 Q3 Q4 Q1 Q2 Q3 (2
mo)
2020 2021 2022 2023
PV Module Price ($/W
dc
)
U.S. average module value
Global spot price, monofacial monocrystalline modules
NREL | 57NREL | 57
390 MW
720 MW
1000 MW
1250 MW
820 MW
0.15
0.20
0.25
0.30
0.35
0.40
0.45
0.50
0.55
JAN
MAR
MAY
JUL
SEP
NOV
JAN
MAR
MAY
JUL
SEP
NOV
JAN
MAR
MAY
JUL
2021 2022 2023
Imported Module Price ($/W)
South Korea
Cambodia
Thailand
Vietnam
Malaysia
Global Total
$0.00
$0.05
$0.10
$0.15
$0.20
$0.25
$0.30
$0.35
$0.40
$0.45
Q1
Q2
Q3
Q4
Q1
Q2
Q3
Q4
Q1
Q2
Q3
Q4
Q1
Q2
Jul-Aug
2020 2021 2022 2023
Calculated U.S. Module Price
Imported value/Watt "Effective" 201 Tarrif Rate
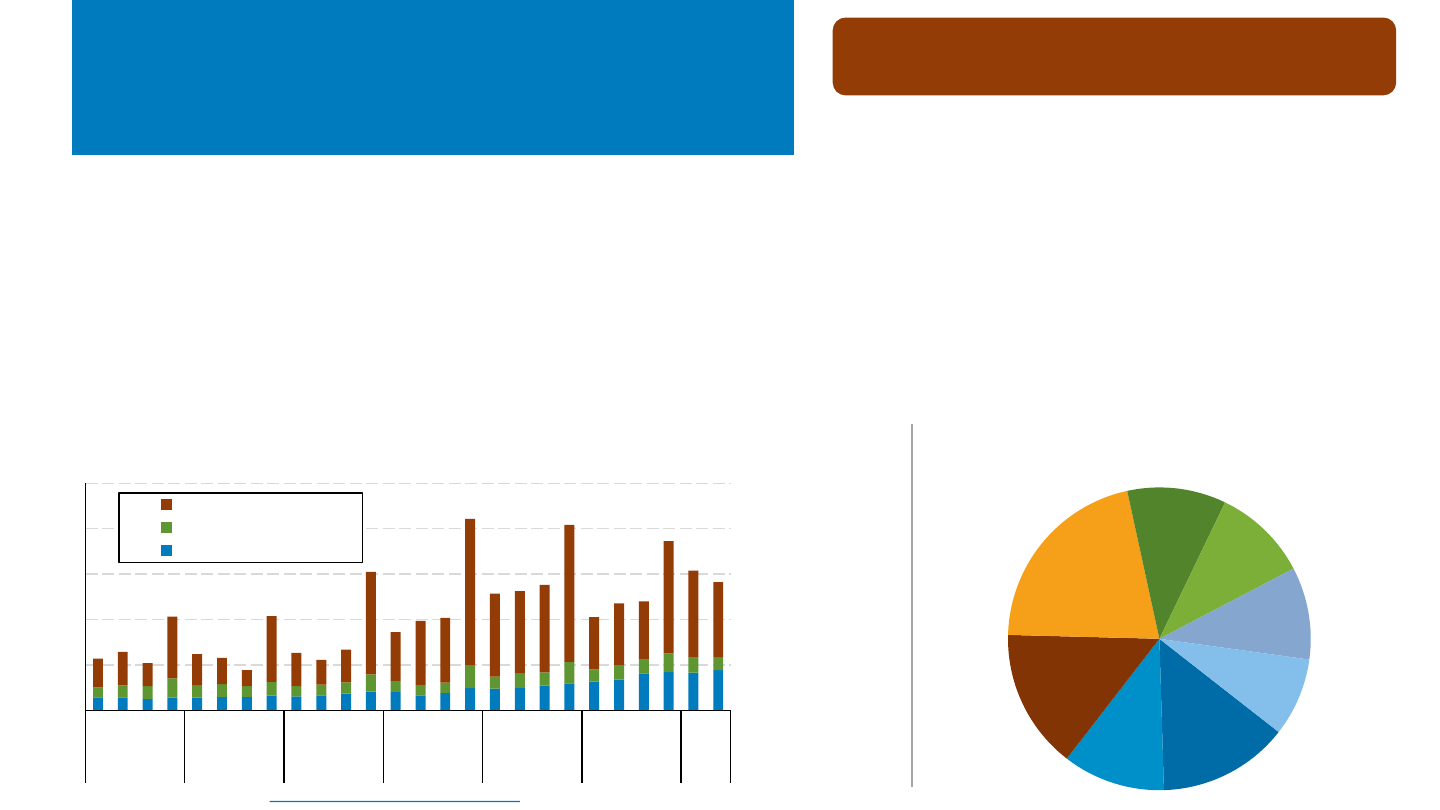
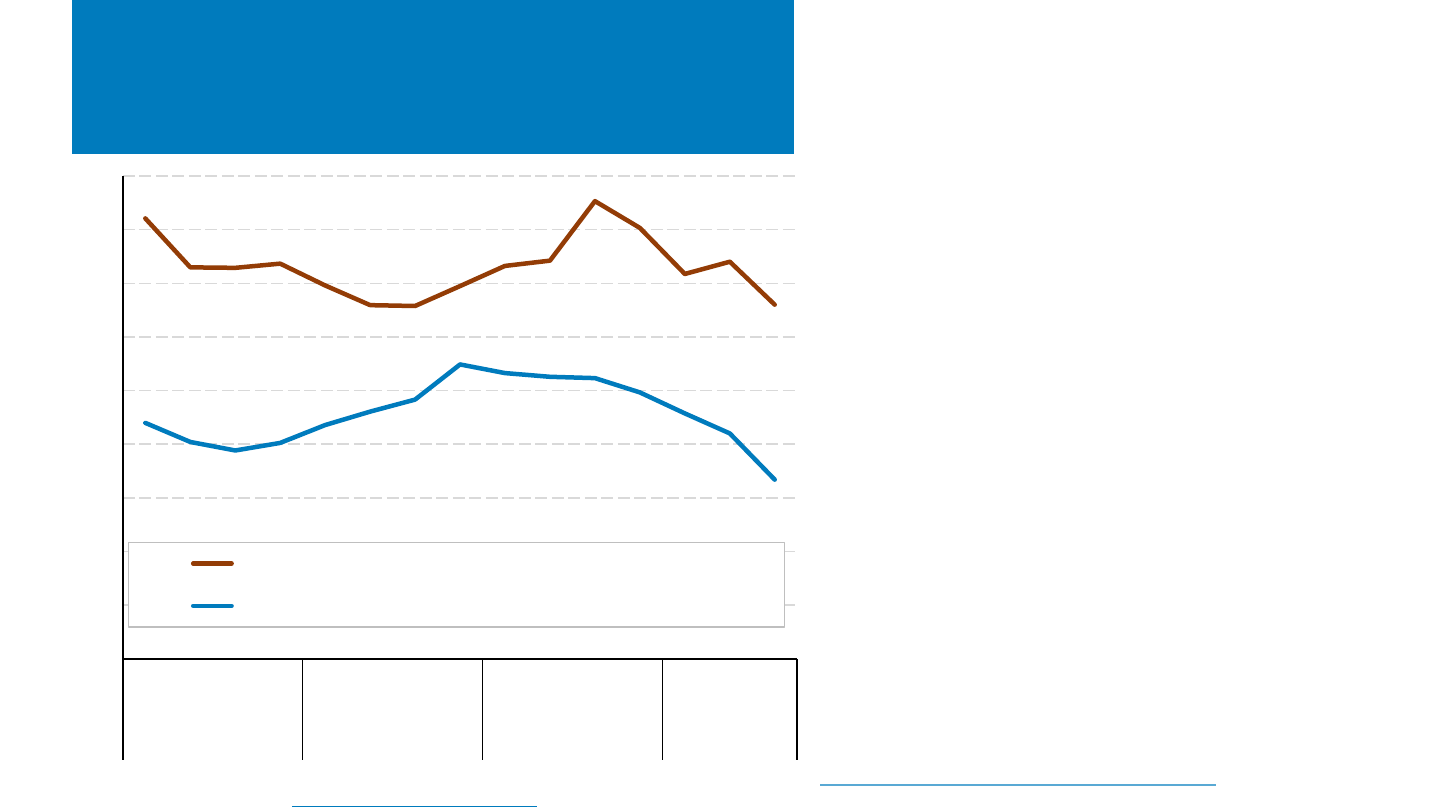
Calculated U.S. Module Pricing
• Based on the reported value and capacity of imported
PV modules, the average price of a PV module in the
United States rose less than a penny q/q in Q2 2023 to
$0.36/W and is on track to fall back to $0.35/W in Q3.
– These price changes have been nonuniform across
countries, with prices declining mostly steeply for imports
from South Korea after a peak at the end of 2022, while
prices from Vietnam, Thailand, Cambodia, and Malaysia
have generally risen over that time.
Note: Manual corrections were made to three values due to suspected data entry errors for HTS code 8541430010: Cambodia (February 2022), Malaysia (June 2020), and Vietnam (July 2019).
Sources: Imports by HTS code: 8541460015(2018-2021)/8541430010(2022-), Customs Value and Second Quantity (watts) from the U.S. International Trade Commission
DataWeb, the U.S. Census Bureau USA Trade Online tool, and corrections page.

NREL | 58
Global Solar Deployment1
U.S. PV Deployment
2
PV System Pricing
3
Global Manufacturing
4
Component Pricing
5
U.S. PV Imports
6
7 PV Domestic Content
Agenda
• The United States imported 25.1 GW
dc
of PV modules in H1 2023,
well over double imports from H1 2022.
– Most panels imported were exempt from Section 201 duties
and were therefore likely bifacial. A significant number of thin-
film modules were also imported.
• 1.5 GW
dc
of cells were imported in H1 2023, up 28% y/y.
– The U.S. is not on pace to reach the 5-GW quota exemption
limit for Section 201 tariffs.
NREL | 59NREL | 59
0.0
2.0
4.0
6.0
8.0
10.0
12.0
14.0
Q1
Q2
Q3
Q4
Q1
Q2
Q3
Q4
Q1
Q2
Q3
Q4
Q1
Q2
Jul-Aug
2020 2021 2022 2023
Modules Imported (GW
dc
)
U.S. Module (c-Si + CdTe) Imports by Region
Malaysia
Vietnam
Thailand
Cambodia
South Korea
India
China
Rest of Asia
N. America
ROW
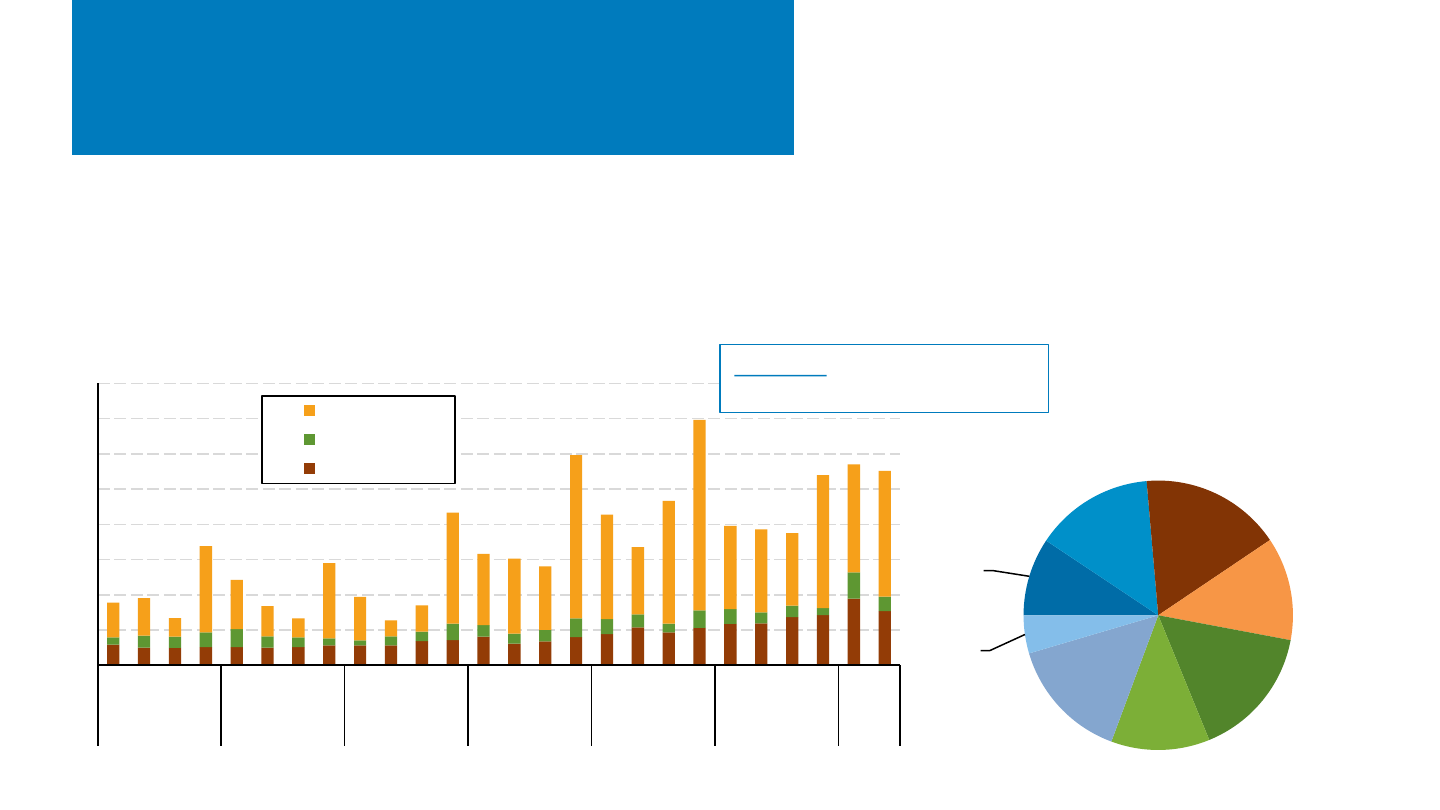
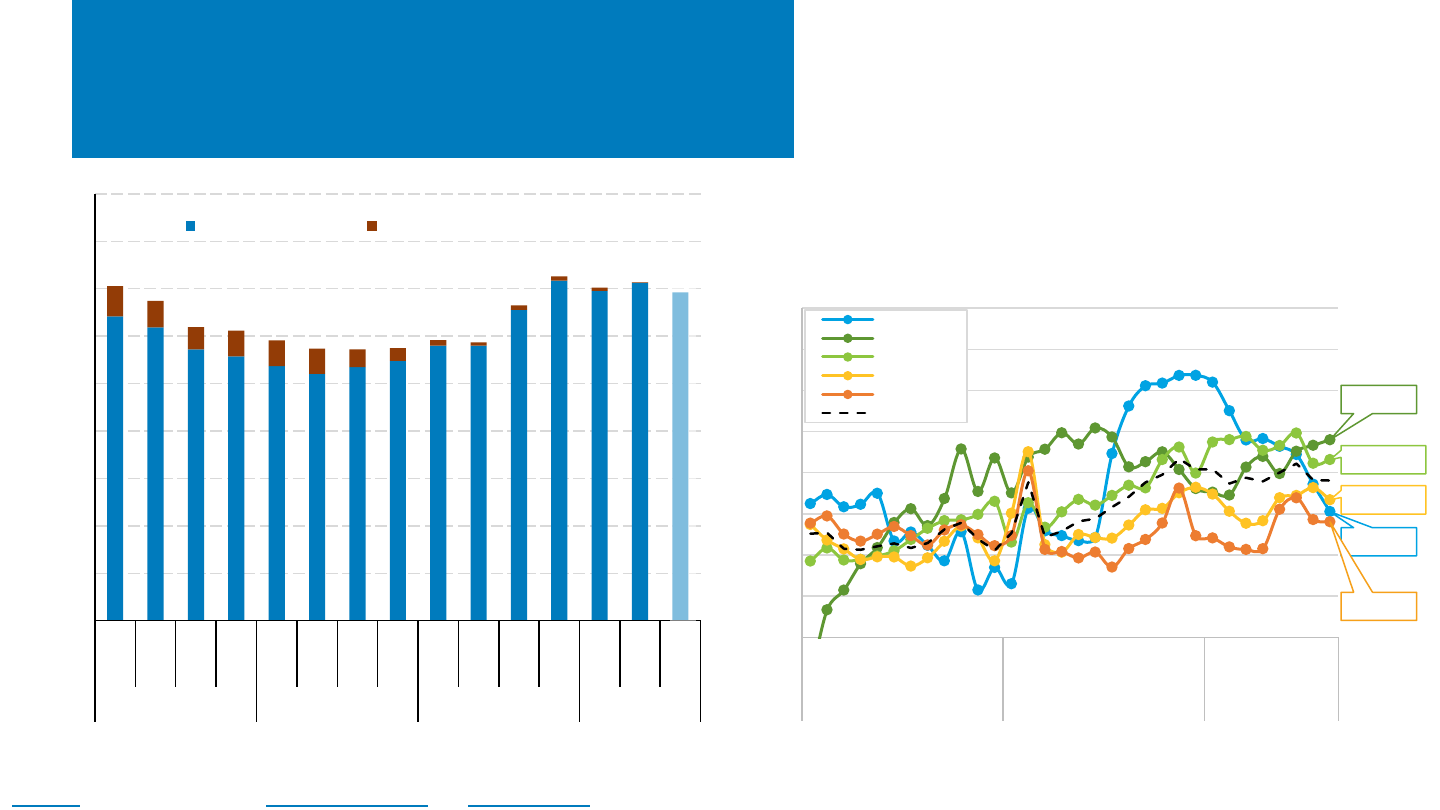
Module Imports and
Calculated Prices by Region
Sources: Imports by HTS code: 8541460015(2018-2021)/8541430010(2022-) and 8541460035(2018-2021)/8541430080(2022-), Second Quantity (watts) from the U.S.
International Trade Commission DataWeb as well as the U.S. Census Bureau USA Trade Online tool and corrections page as of 10/25/23. Manual corrections were made to
imports from India in due to suspected data entry errors
• In Q2 2023, U.S. module imports remained near record-
high levels (+200%, or 6 GW y/y), totaling 25.1 GW
dc
in
H1 2023.
– Import levels decreased after the withhold release order
(WRO) on PV cells and modules was announced in late
Q2 2021. Additionally, many manufacturers in Southeast
Asia had reduced production levels earlier in the year
with the announcement of a U.S. anti-circumvention
investigation and when the 2-year waiver was
announced in June; however, the supply chain appears
to be recovering from those disturbances.
– The slight Q2 q/q decrease was mainly the result of
decreased imports from South Korea (−35% q/q, −390
MW), as modest changes across the four main SE Asia
importers generally cancelled each other out in Q2.
– Both Q2 2023 (+99%, +6.25 GW) and H1 2023 (+127%,
+14 GW) imports are still up significantly y/y.
• While Q3 is not yet complete, it has already nearly
matched Q4 2022 imports.
– This has been mainly the result of imports from Vietnam
and Malaysia, which totaled nearly 2.7 GW (1.9 GW c-Si
+ 0.8 GW thin film) and 2.3 GW (1.3 GW c-Si + 1 GW thin
film), respectively, over July and August.
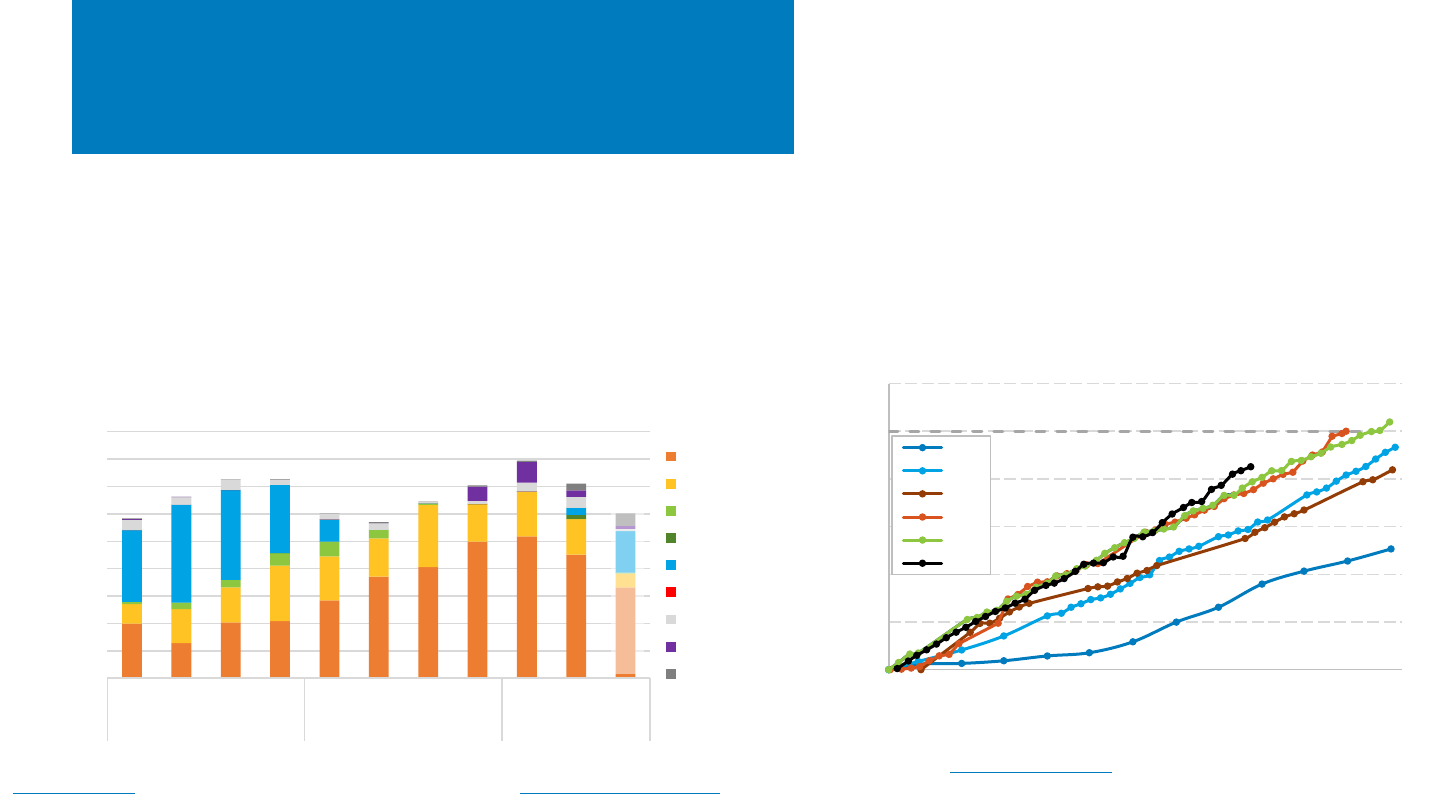
NREL | 60NREL | 60
0.00
0.50
1.00
1.50
2.00
2.50
3.00
7-Feb
9-Mar
8-Apr
9-May
8-Jun
9-Jul
8-Aug
8-Sep
8-Oct
8-Nov
8-Dec
7-Jan
7-Feb
PV Cells Imported Into U.S. (GWdc)
U.S. Cell Imports by Tariff Year
2018
2019
2020
2021
2022
2023
(previous) 2.5 GW
dc
PV Cell Import Quota Exemption
0.0
0.1
0.2
0.3
0.4
0.5
0.6
0.7
0.8
0.9
Q1 Q2 Q3 Q4 Q1 Q2 Q3 Q4 Q1 Q2 Jul-Aug
2021 2022 2023
Imported c-Si Cells (GW
dc
)
U.S. Cell Imports by Region
Malaysia
Vietnam
Thailand
Cambodia
South Korea
China
Taiwan
Indonesia
ROW
c-Si Cell Import Data
Sources: Imports by HTS code: 8541460025(2018-2021)/8541420010(2022-), , Second Quantity (watts) from U.S. Census Bureau USA Trade Online tool and
corrections page
as of 10/25/23; U.S. Customs and Border Protection Commodity Status Reports February 2019–October 2023.
• According to U.S. Census data, 1.5 GW
dc
of cells were imported in H1
2023, an increase of 28% relative to H1 2022. However, quarterly cell
imports declined for the first quarter since Q2 2022 in Q2 2023.
– This was mainly the result of declines in imports from Malaysia (−13%, −67
MW) and Vietnam (−21%, −33 MW) q/q, although imports in Q3 look to be
recovering as a result of increased imports from South Korea.
• Despite both the increased quota exemption from 2.5 GW
dc
to
5.0 GW
dc
for the Section 201 tariffs in February 2022 and the
recent capacity expansions announced in 2023, imports
remain on track to just barely exceed those of 2021/2022,
according to CBP Commodity Status Reports.
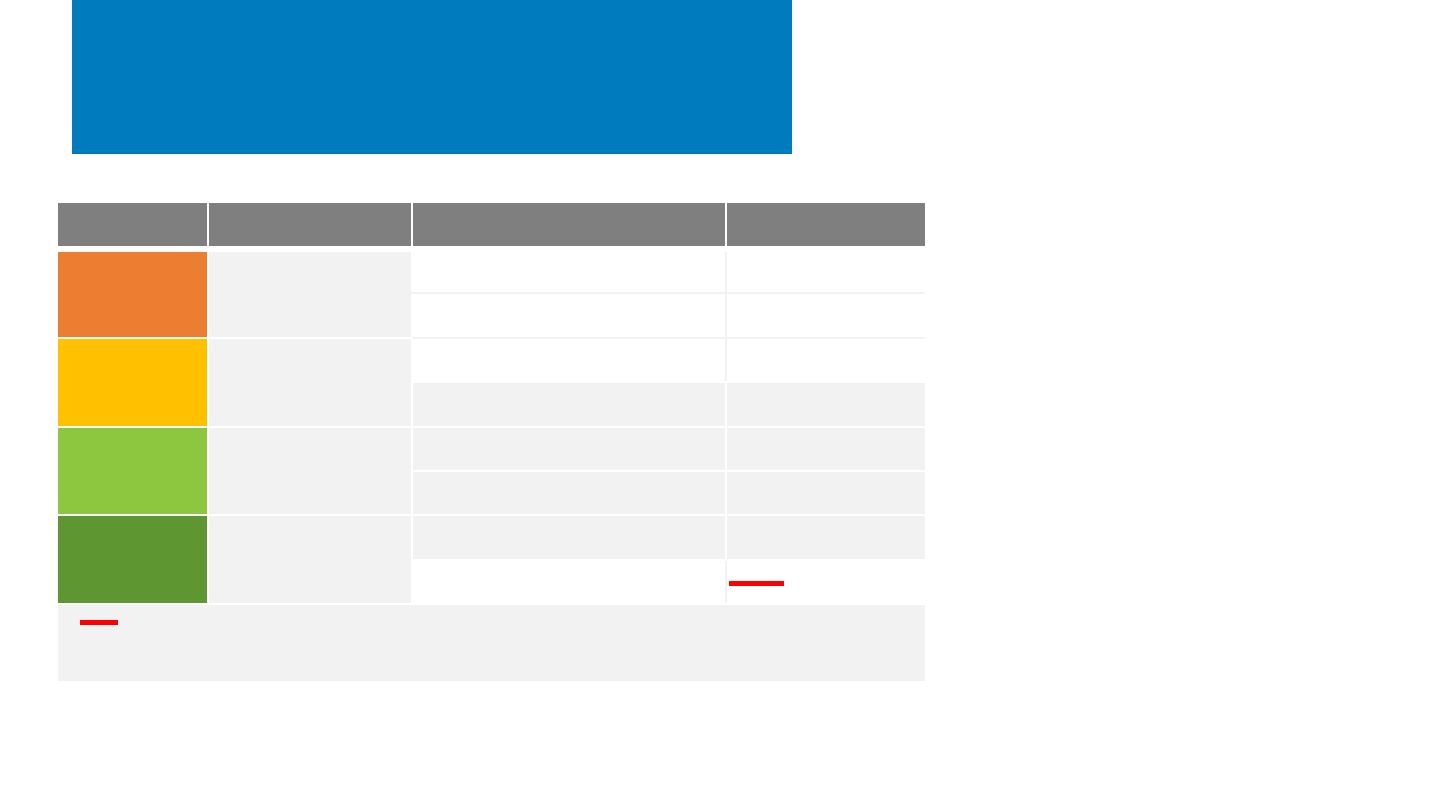
Final SE Asia AD/CVD
Circumvention Determination
In December, the Department of Commerce
issued a preliminary decision to impose anti-
circumvention duties on some solar panels and
cells produced in Vietnam, Malaysia, Thailand,
and Cambodia.
Country
Determination Company Investigated* Determination
Malaysia
Circumventing
Hanwha Qcells Not
JinkoSolar Not
Vietnam
Circumventing
Boviet Not
Vina Solar Circumventing
Thailand
Circumventing
Canadian Solar Circumventing
Trina Circumventing
Cambodia
Circumventing
BYD Hong Kong Circumventing
New East Solar Not
*22 companies that did not respond to Commerce’s request for
information were declared in violation by default
• Imported SE Asian panels will be
treated as Chinese if they are made
from wafers produced in China and
have more than two other
components produced in China. The
other components are silver paste,
aluminum frames, glass, backsheet,
ethylene vinyl acetate sheets, and
junction boxes.
• If companies already have a set duty
in place for Chinese AD/CVD, then
those AD/CVD values will be used
(e.g., Canadian Solar’s AD/CVD
rates are 16%), if not, China-wide
rates of 254.19% will be used. Due
to the temporary moratorium these
rates will not go into effect until
June 2024.
• The final determination, released on August 18, 2023, upheld all but one
of these determinations.
Red indicates a change between preliminary and final decision.
Circumventing
20
and may not simply certify
that their panels meet the component threshold, but instead be fully reviewed
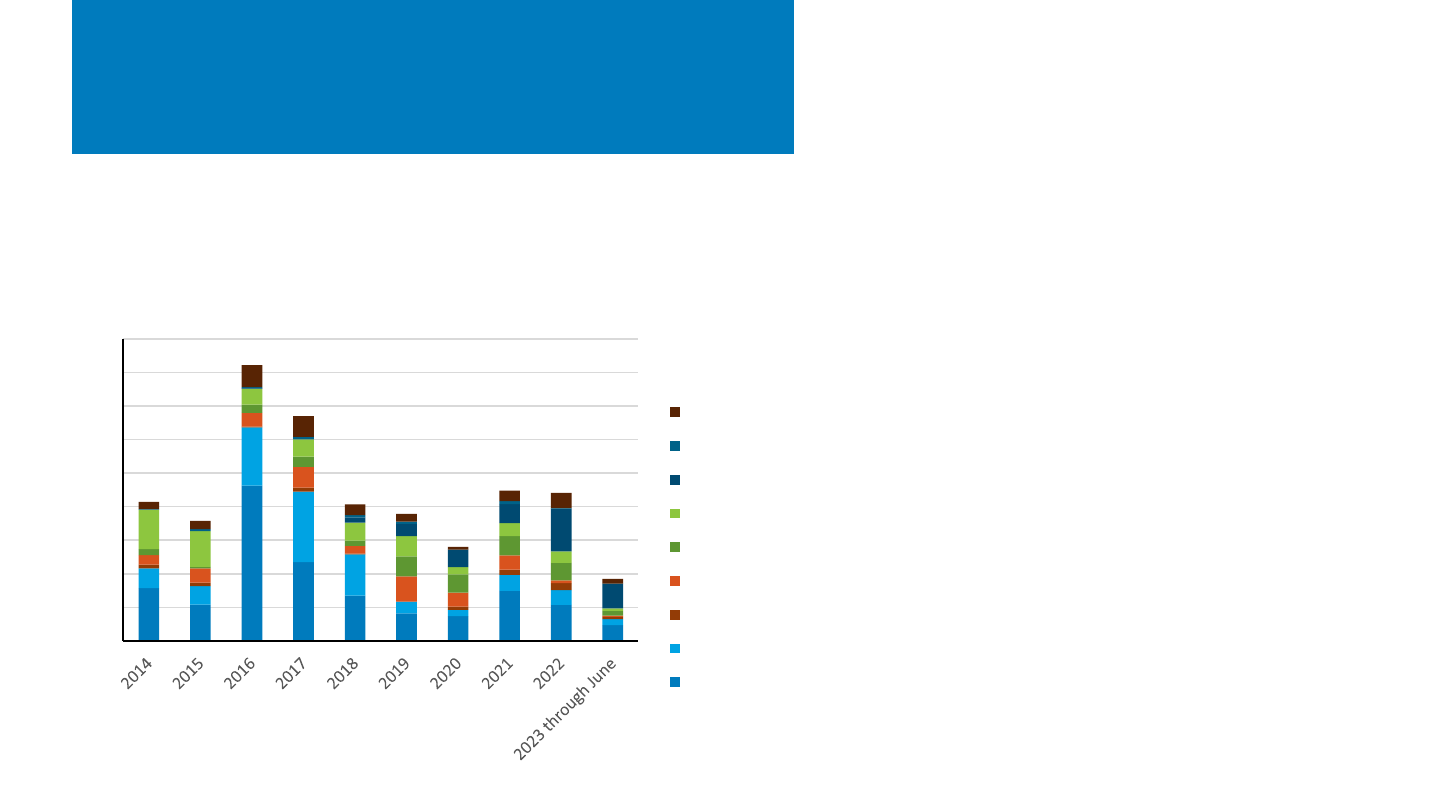
NREL | 62NREL | 62
U.S. Silicon Exports (>99.99%
Purity)
Source: U.S. Census Bureau.
• In 2014, China finalized duties of more than 50% on
solar-grade polysilicon (6N+) imported from the U.S.,
including closing a loophole in September of that year
that had previously exempted duties if the polysilicon
was used in the production of exported goods (like PV
modules).
• Despite the Chinese tariffs, which continue to be in
place, U.S. silicon exports significantly increased in
2016, aided by the opening of the largest U.S.
polysilicon manufacturing plant—the 20,000 MT
Wacker facility in Tennessee, which received a 48C
credit.
– Hemlock abandoned a multibillion-dollar
polysilicon plant in Tennessee in 2014 before it
opened due to the implementation of the Chinese
tariffs. Hemlock received a 48C credit for a plant in
Michigan.
• From 2015 through 2022, 56% of U.S. exports went to
Japan, Taiwan, and Singapore, likely for use in the
semiconductor industry.
• Shipments to Vietnam have grown in recent years,
likely due to the rapid expansion of its PV wafer
manufacturing capacity.
0
10
20
30
40
50
60
70
80
90
MT (millions)
Other
Norway
Vietnam
China
Germany
South Korea
Singapore
Taiwan
Japan
• The U.S. tracks the export of silicon, with a purity exceeding
99.99%, which is used within the semiconductor industry
(9N+), for fire-resistant material (4N+. e.g., spray coating), and
for PV wafers (9N).
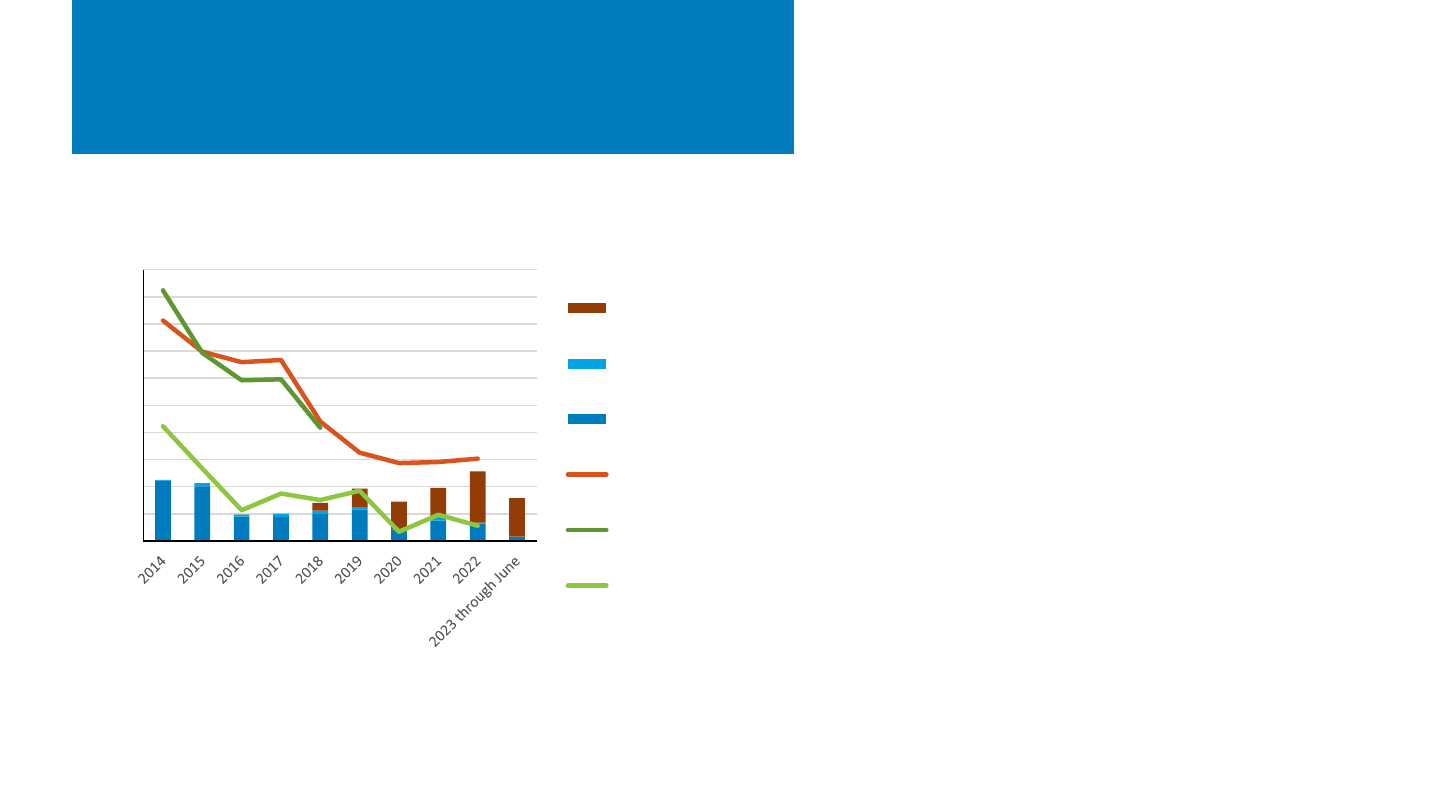
NREL | 63NREL | 63
Estimates of U.S. Polysilicon
Market
• In addition to the duties, China also significantly
expanded its domestic polysilicon manufacturing
capacity at this time.
– PVTech/WoodMac estimate production fell from
40,000 MT to 15,000 MT.
– Chinese import data fell from 21,000 MT to
7,000 MT.
– U.S. export data to China fell from 11,000 MT to
5,000 MT.
• PVTech/WoodMac data would imply that from 2014
to 2018, virtually all non-Chinese PV wafer
manufacturing used U.S. polysilicon, there was a
large amount of U.S. polysilicon in inventory, or they
are erroneously including semiconductor-grade
silicon in their production estimates.
• Silicon shipped to Vietnam increased by more than
5X from 2018 to 2022, aided by the 7X increase in
Vietnamese wafer manufacturing capacity and the
difficulties with U.S. buyers purchasing products with
Chinese wafers.
• In 2020, the China and the United States agreed to a
Phase 1 trade deal that included the purchase of U.S.
polysilicon—that has not appeared to increase U.S.
exports of polysilicon to China.
0
5
10
15
20
25
30
35
40
45
50
million MT
U.S. Poly Export (Vietnam)
U.S. Poly Export (Norway)
U.S. Poly Export (China)
U.S. Polysilicon Production
(PVTech)
U.S. Polysilicon Production
(WoodMac)
Chinese Imports of U.S. Poly
(GACC/BNEF)
Note: U.S. poly exports include silicon exports of greater than 99.99% from the following states with active or
previously active polysilicon production: Michigan, Tennessee, Washington, Montana, and Texas.
Sources: U.S. Census Bureau, PVTech Market Research (May 2023), China’s General Administration of
Customs(GACC); BNEF, “Bimonthly PV Index, July 2023”; Wood Mackenzie, “U.S. Solar Market Insight” 2014-
2018.
• Chinese duties significantly cut U.S. PV-grade polysilicon production,
but estimates vary by how much.
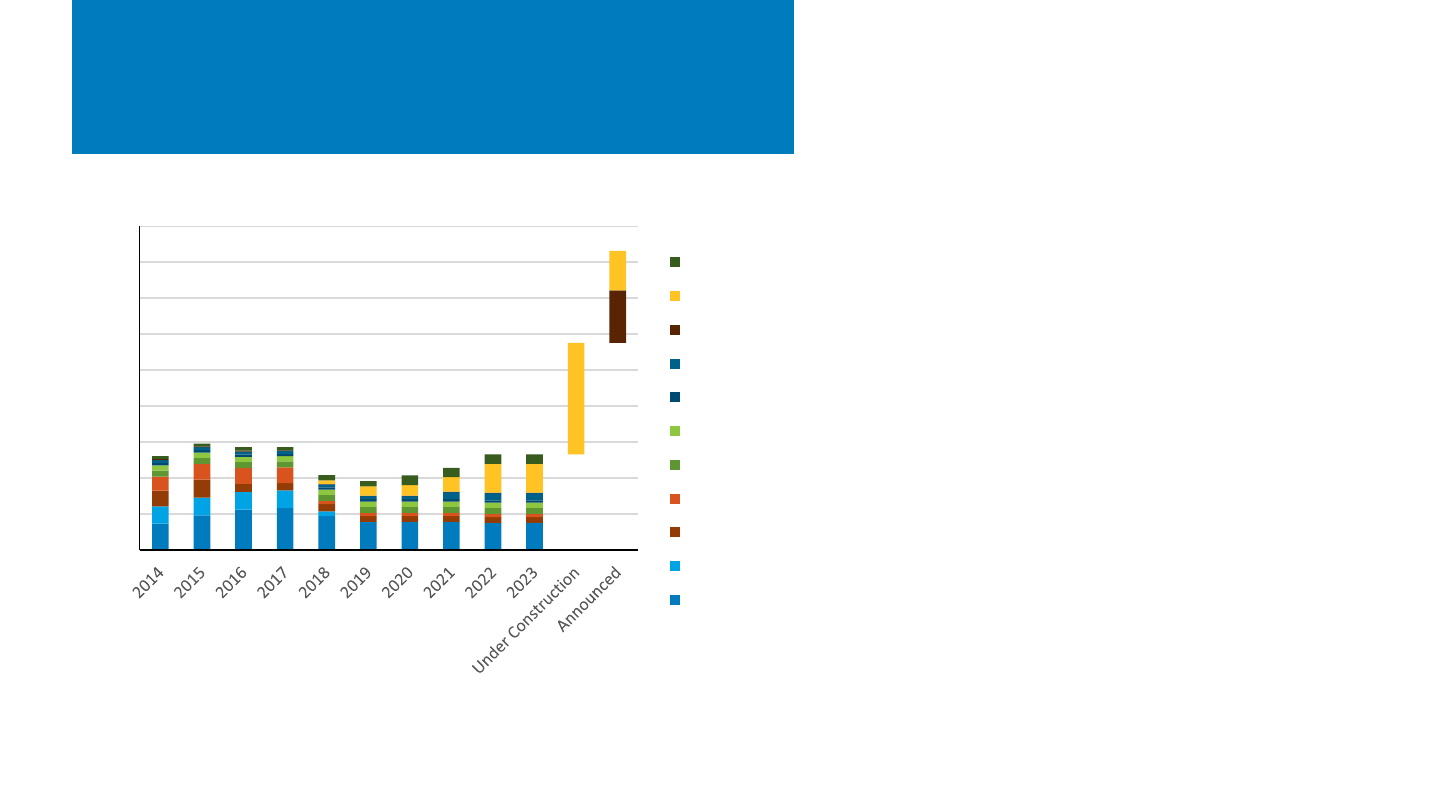
NREL | 64NREL | 64
Non-Chinese Wafer
Manufacturing Capacity
Source: BNEF.
• Bloomberg tracked approximately 10–15 GW of
manufacturing capacity outside of China (which they
estimate to be 480 GW in 2023).
• Vietnamese wafer manufacturing capacity increased
from 500 MW to 4 GW from 2018 to 2022. Another
15.5 GW is under construction and another 5.5 GW
has been announced, which would provide more than
enough of a market for U.S. polysilicon, assuming they
are competitive.
• BNEF reported average polysilicon price to be $9.72/kg
at the end of August 2023, down from $39/kg the
previous August.
– If Chinese polysilicon is allowed to be used in
products heading to the U.S. (either through
proper documentation of a supply chain outside
of Xinjiang or through a lack of enforcement), U.S.
polysilicon would face tremendous price pressure.
0
5
10
15
20
25
30
35
40
45
Manufacturing Capacity (GW)
Other
Vietnam
US
Norway
Japan
Philippines
Singapore
Germany
Malaysia
South Korea
Taiwan

NREL | 65
Global Solar Deployment1
U.S. PV Deployment
2
PV System Pricing
3
Global Manufacturing
4
Component Pricing
5
U.S. PV Imports
6
7 PV Domestic Content
Agenda
• This section summarizes NREL analysis of the percentage of
domestically produced content in the U.S. PV supply chain before
the passage of the Inflation Reduction Act.

NREL | 66
IRA Domestic Content Bonus:
Guidance for Manufactured Products
• In May, the U.S. Treasury and IRS issued initial guidance on how to qualify for the domestic content
bonus:
– 100% of steel products must be U.S.-made.
– Through 2024, 40% of manufactured products total direct costs must be U.S.-made
(this number rises to 55% by 2027).
• The “Adjusted Percentage Rule” is used for evaluating domestic content in manufactured products.*
– This rule only considers direct costs (defined as direct labor and material/components).
– Direct labor costs for products manufactured in the U.S. only count as domestic value if all
material/components in the product are of U.S. origin.
• To evaluate the U.S. ability to meet domestic content criteria prior to IRA, we present an assessment of
the 2021 U.S. PV market in the following slides. Sankey diagrams are used to illustrate domestic value in
different products for different market sectors, which are generated from a more detailed spreadsheet.
*
See slides 16-21 in the Summer 2023 Industry Update for more detail and examples on how the Adjusted Percentage Rule is used to calculate
the domestic content percentage for manufactured products

NREL | 67
Two Types of Domestic
Content Analysis
Manufactured products:
– PV modules
– Inverters
– Electrical balance of system (EBOS)
– Trackers
– Roof racking
Steel products:
– Ground-mount racking
– Other structural balance of system
(SBOS)
“Total costs” diagrams
• Captures costs for steel products and
manufactured products only (no installation
labor, interconnection, etc.).
• All indirect costs are grouped together
(utilities, equipment, margin, etc.).
• All labor and indirect costs for domestic
facilities are classified as domestic (to illustrate
broader domestic economic value).
• All other value is designated “imported.”
“Direct costs” diagrams
• Only captures manufactured products (i.e., no steel
products).
• Represents costs for direct labor and
material/components only, even for imported products.
• Labor is only designated as domestic for products that
have 100% domestic material/components.
• All non-domestic value is designated as “other.”

NREL | 68
2021 Market Features and
Simplifications
Market Sectors in 2021
• Utility: 17 GW installed
– Approximately all utility systems use single-axis trackers.
– 15.3 GW of trackers are made in U.S. (domestic components
assumed).
– All other SBOS estimated to be domestic.
• Commercial: 2.4 GW installed
– Approximately 60% of commercial systems use flat-roof
racks, 40% are ground-mounted.
– All commercial racking and SBOS estimated to be domestic.
• Residential: 4.2 GW installed
– Approximately all residential systems use c-Si modules.
– All residential racking estimated to be domestic.
– Estimates 60% of systems use microinverters, 40% use string
inverters with DC-optimizers. Approx. 0.5 GW are U.S.-
assembled with imported components.
PV Technology in 2021
c-Si modules: 18.9 GW installed
– All c-Si module components estimated to be
imported.
– All 3 GW of U.S.-assembled c-Si modules
estimated to go to residential sector.
CdTe modules: 4.7 GW installed
– Approximately 75% of components in U.S.-
CdTe modules (2.8 GW) are domestic.
– All CdTe modules estimated to be installed in
utility sector.
Inverters and EBOS
– All utility and commercial inverters estimated
to be imported.
– All EBOS besides combiner boxes assumed to
be imported.

Total Costs:
U.S. PV Market in 2021
29%
13%
17%
• Total costs across the entire 2021 U.S.
market (all system types)
– Weighted by installs per sector
(total 23.6 GW).
– 24% average domestic value;
significantly below criteria for
domestic content bonus.
• This percentage includes
indirect costs and steel
products.
– Most imported value is coming
from silicon modules, inverters,
and EBOS.
– Direct costs are larger
contribution to total than
indirect costs.
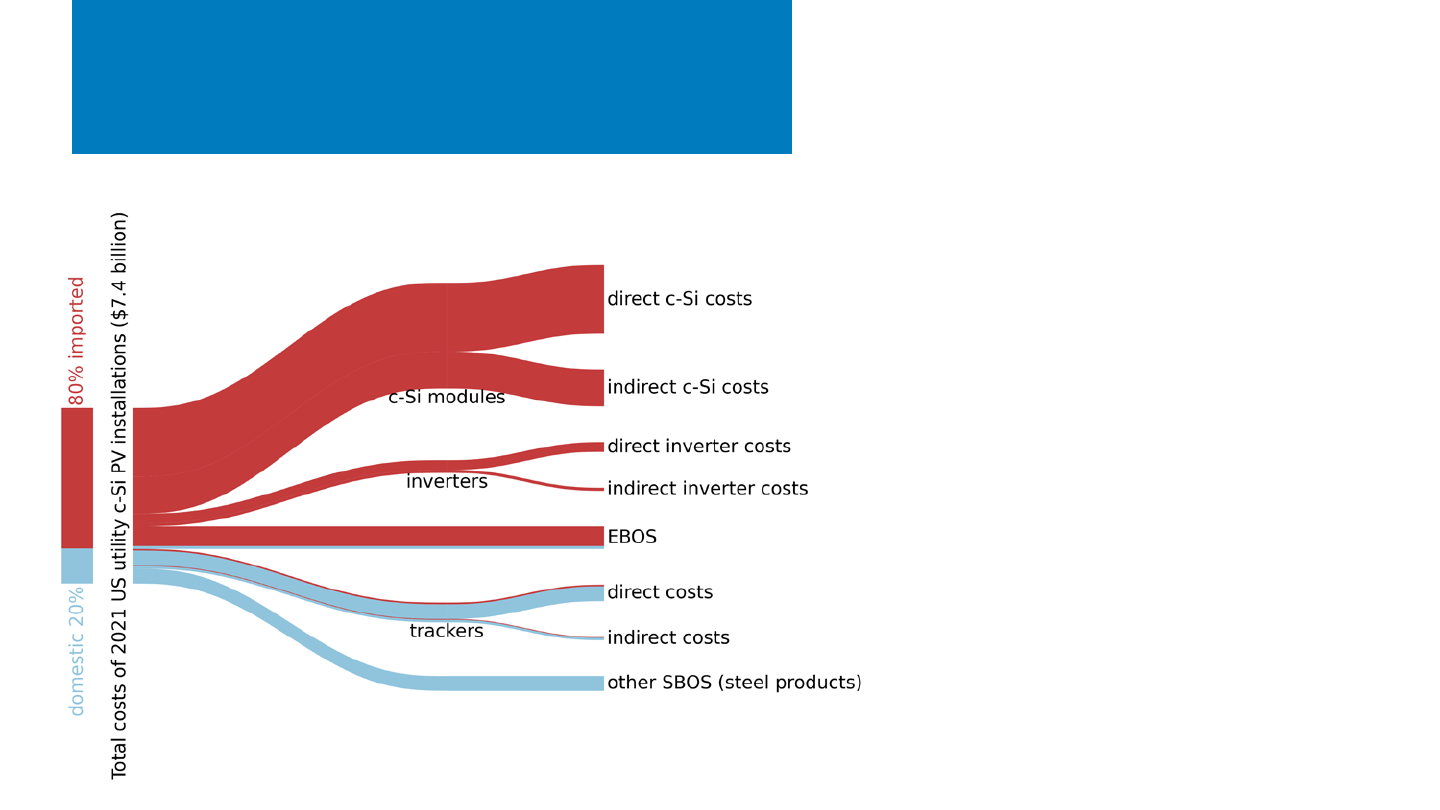
Total Costs:
c-Si Utility Systems in 2021
39%
21%
13%
• Total of 12.3 GW.
• 20% average domestic value;
significantly below criteria for
domestic content bonus.
– This percentage includes indirect
costs and steel products.
• This represents an average system
(i.e., 90% of a domestic tracker).
• Most imported value is coming from
silicon modules, inverters, and
EBOS.
• c-Si modules have largest
contribution of indirect costs.
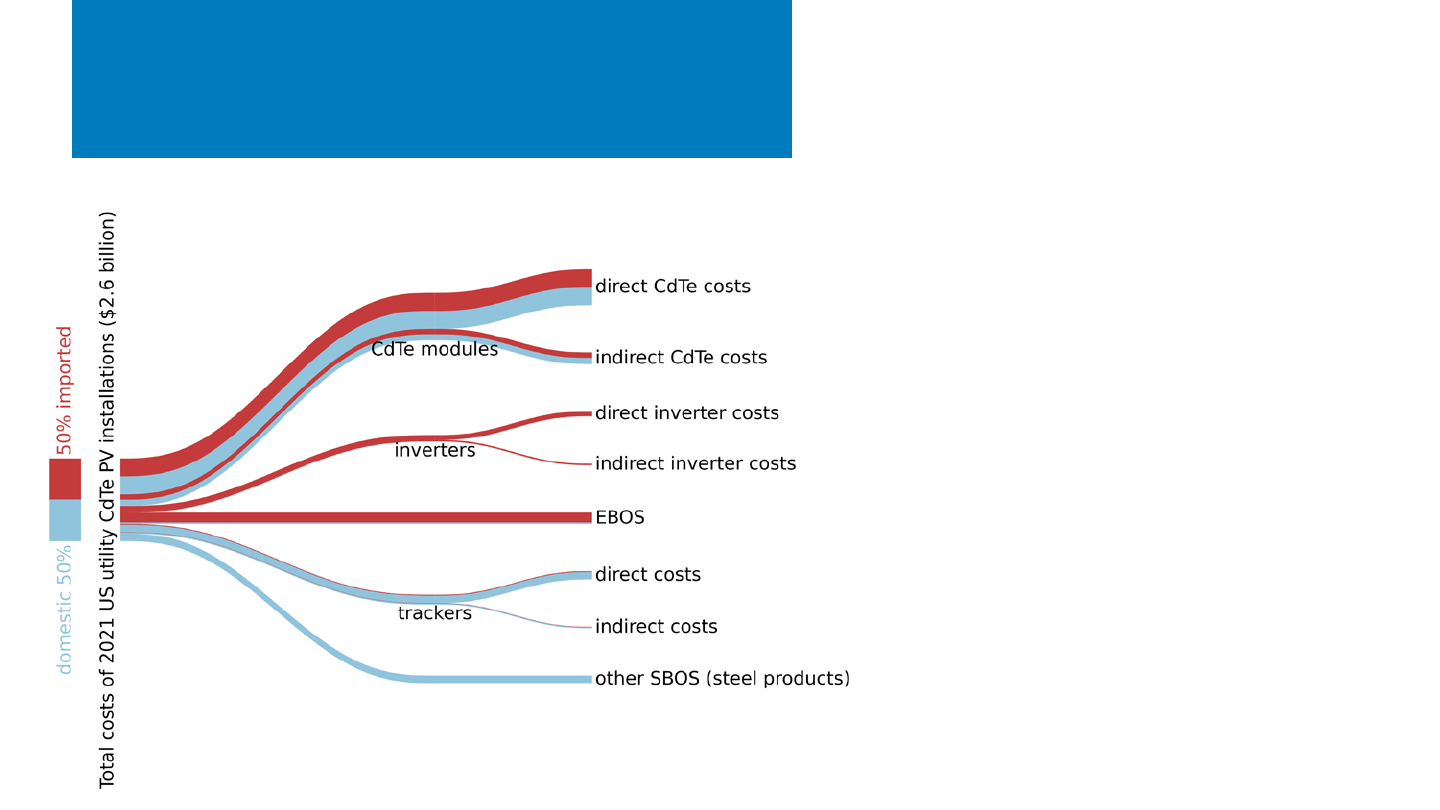
43%
14%
14%
10%
• Total of 4.7 GW.
• 50% average domestic value;
exceeds 2024 criteria for domestic
content bonus.
– This percentage includes
indirect costs and steel
products.
• Keep in mind, this represents an
average system (i.e., 60% of a
domestic CdTe module).
• Most imported value is coming
from inverters, EBOS, and 40% of
CdTe modules, which are imported.
Total Costs:
CdTe Utility Systems in 2021
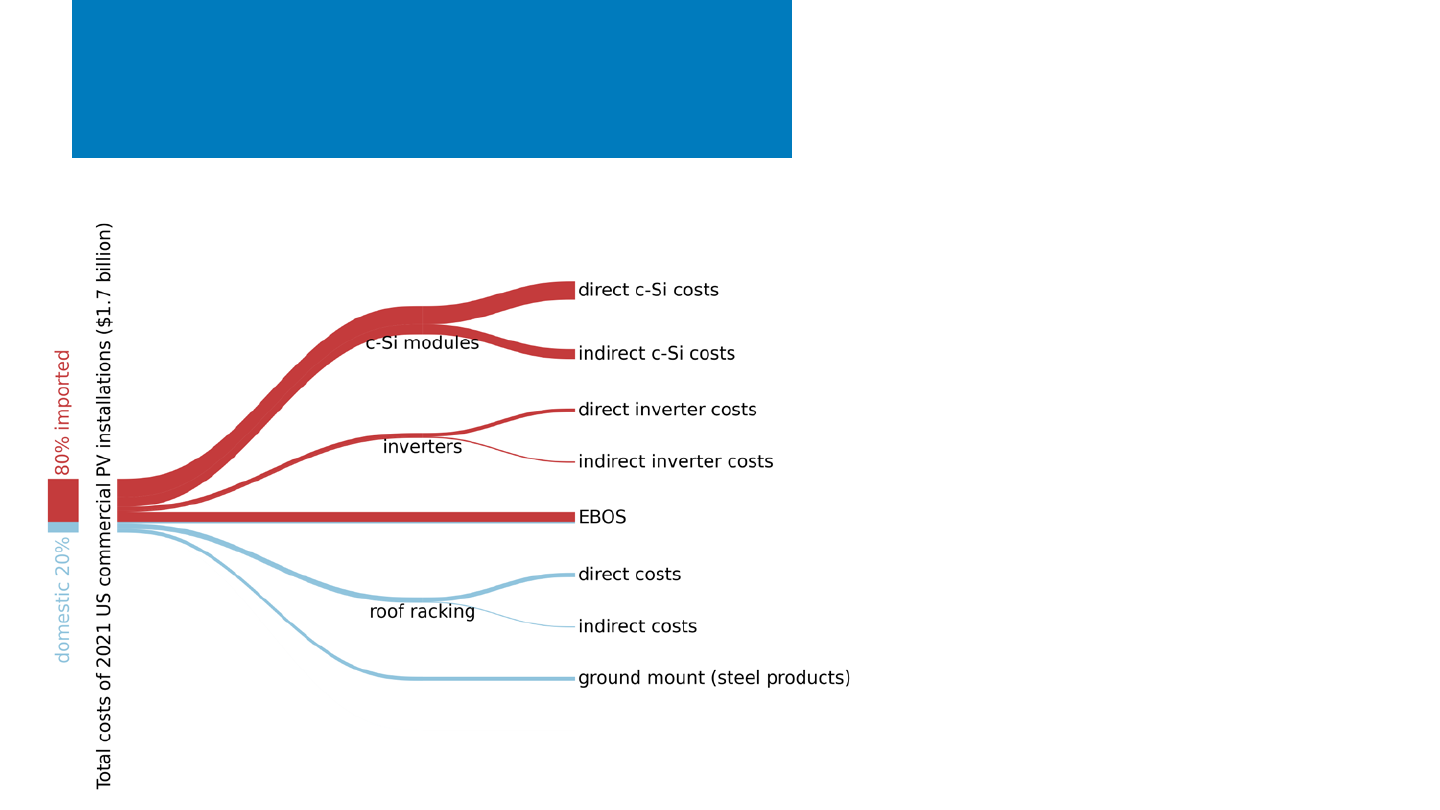
34%
20%
Total Costs:
Commercial Systems in 2021
• Total of 2.4 GW.
• 20% average domestic value;
significantly below criteria for
domestic content bonus.
– This percentage includes indirect
costs and steel products.
• Most imported value is coming from
silicon modules, inverters, and EBOS.
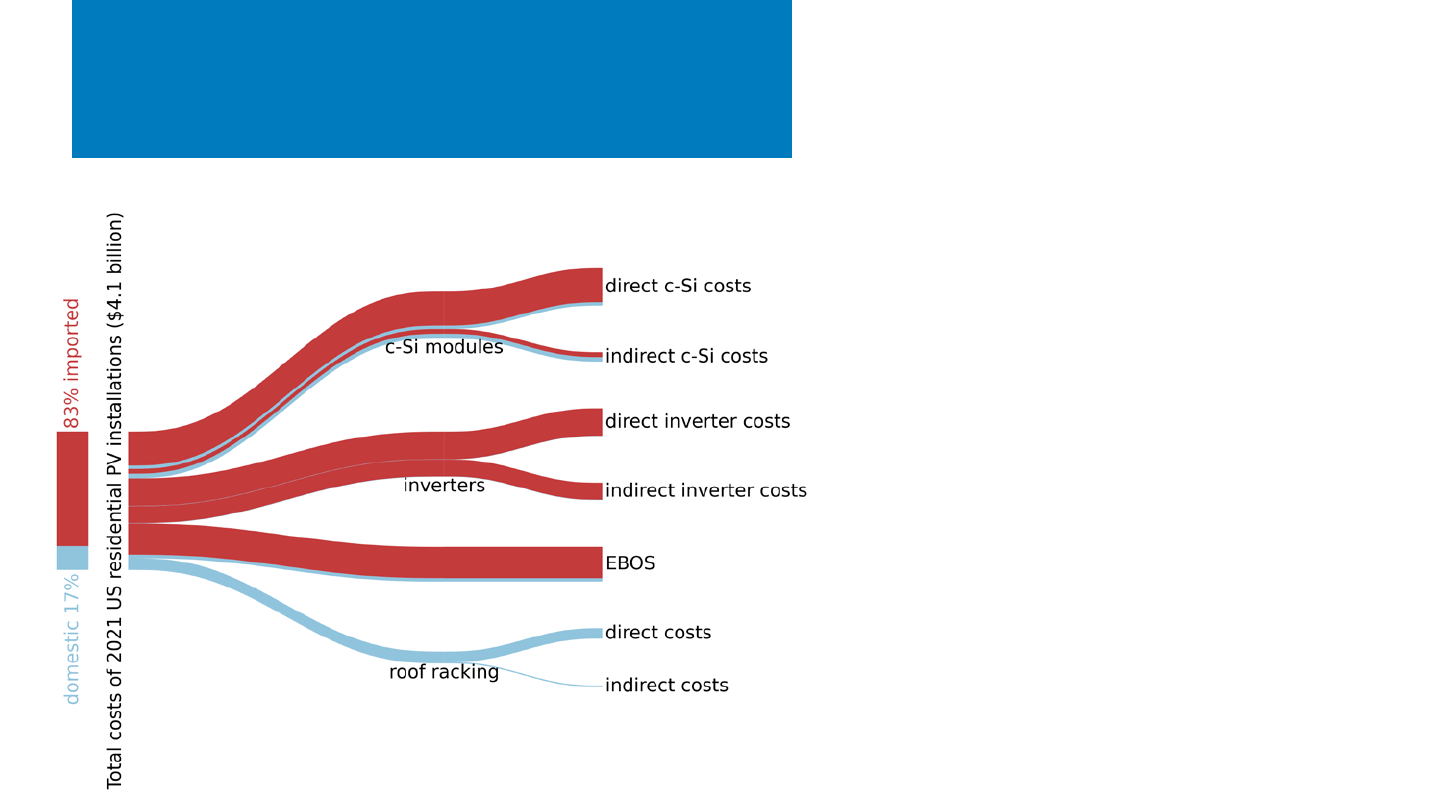
27%
20%
25%
Total Costs:
Residential Systems in 2021
• Total of 4.2 GW.
• 17% average domestic value;
significantly below criteria for
domestic content bonus.
– This percentage includes indirect
costs (no steel products in
residential systems).
• This represents an average system
(i.e., 71% of a domestic c-Si module).
• While 3 GW of these modules are
U.S.-assembled, none of the module
components are domestic.
• The absence of steel products and
greater expense of residential c-Si
modules and inverters contribute to
the large fraction of imported value.
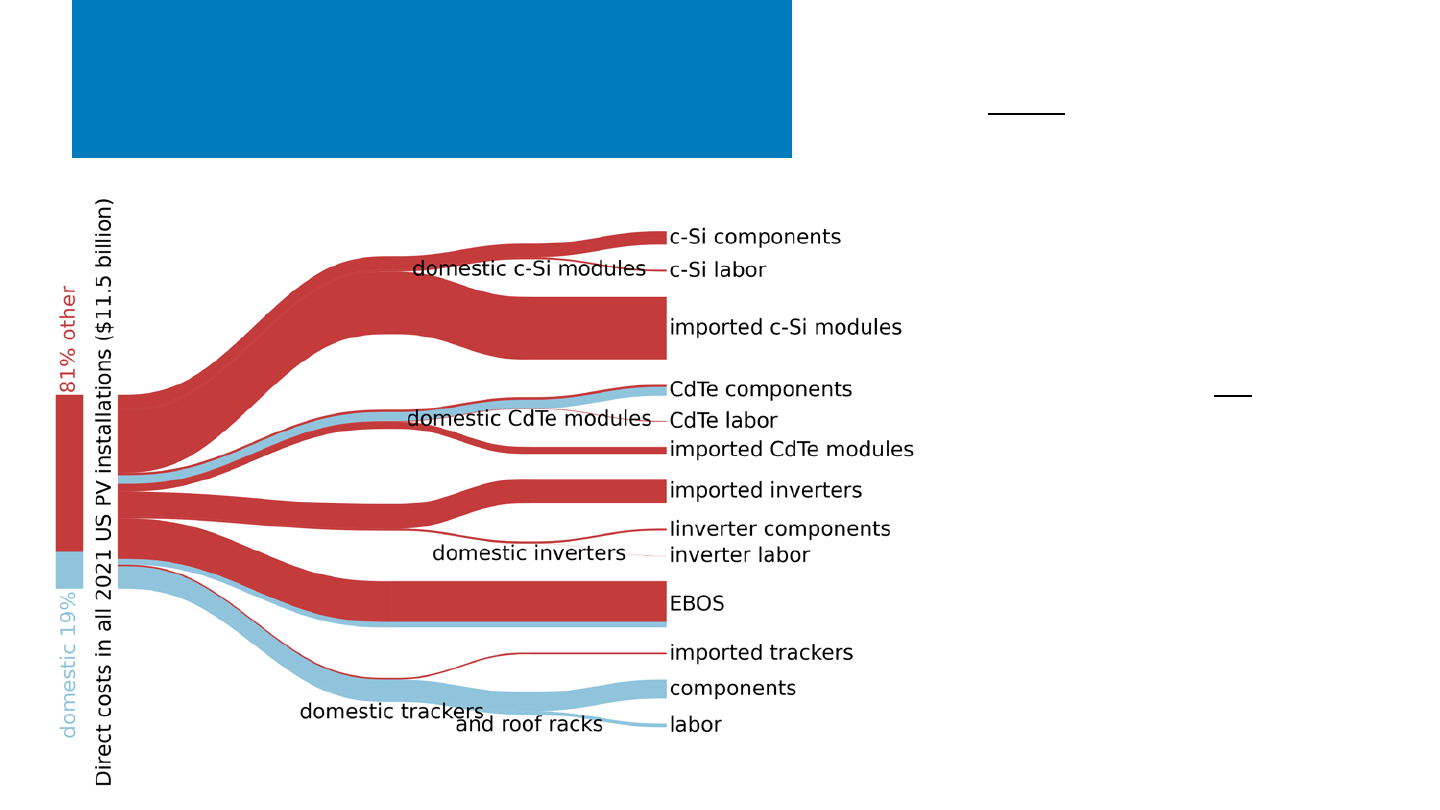
Total 2021 Market
(Direct Costs Only)
32%
13%
24%
• Total direct costs across the entire
2021 U.S. market (all system types).
– Weighted by installs per sector
(total 23.6 GW).
– 19% average domestic value;
significantly below criteria for
domestic content bonus.
• Steel products not included in
this version.
– Non-domestic value mostly
coming from silicon modules and
EBOS.
– Domestic silicon modules are not
assigned any domestic value
because all input
materials/components are
imported.
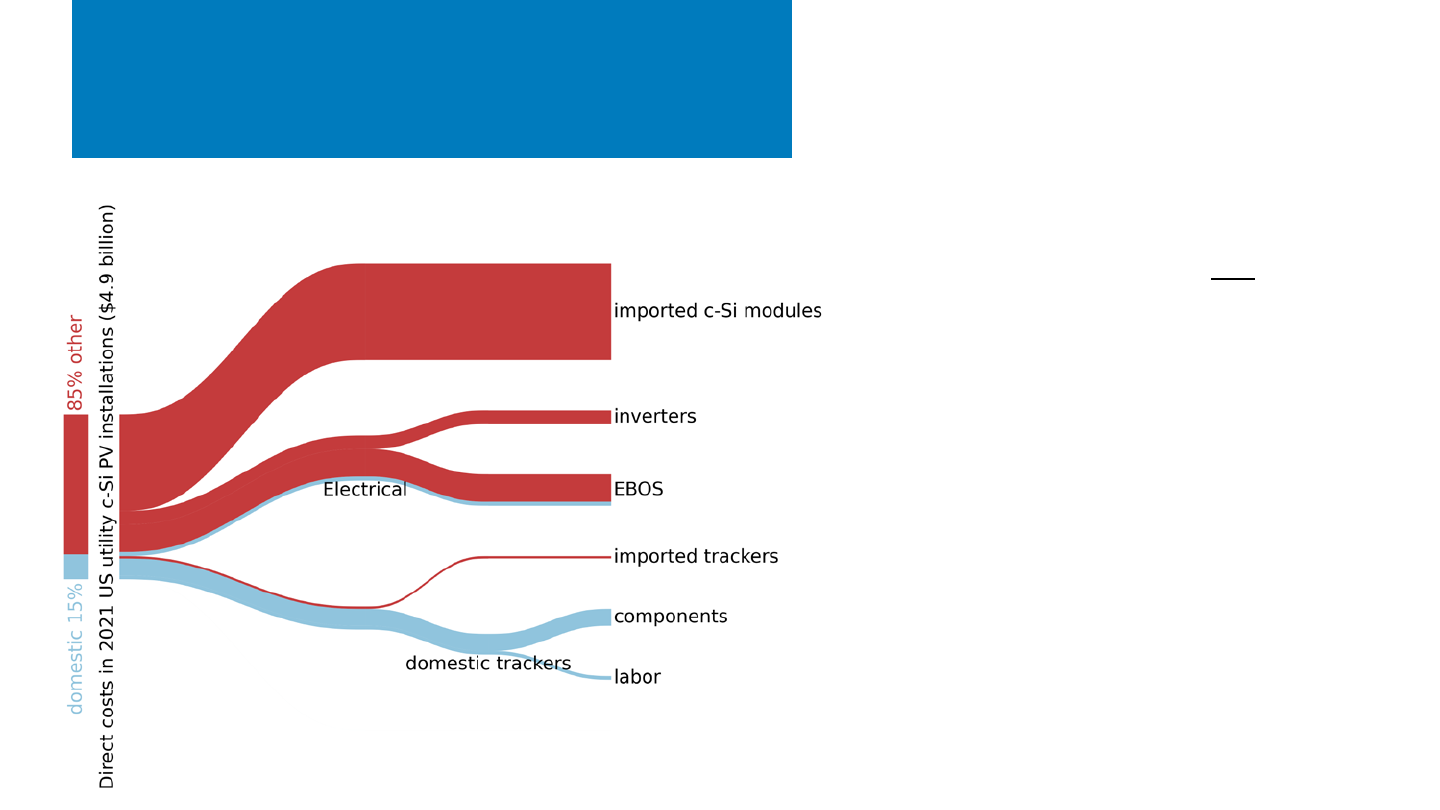
2021 c-Si Utility Systems
(Direct Costs Only)
59%
19%
10%
• Total of 12.3 GW.
• 15% average domestic value;
significantly below criteria for
domestic content bonus.
– This version does not include
steel products.
• This represents an average system
(i.e., 90% of a domestic tracker).
• Non-domestic value is mostly coming
from silicon modules, inverters, and
EBOS.
• Domestic value is mostly coming from
trackers and combiner boxes.
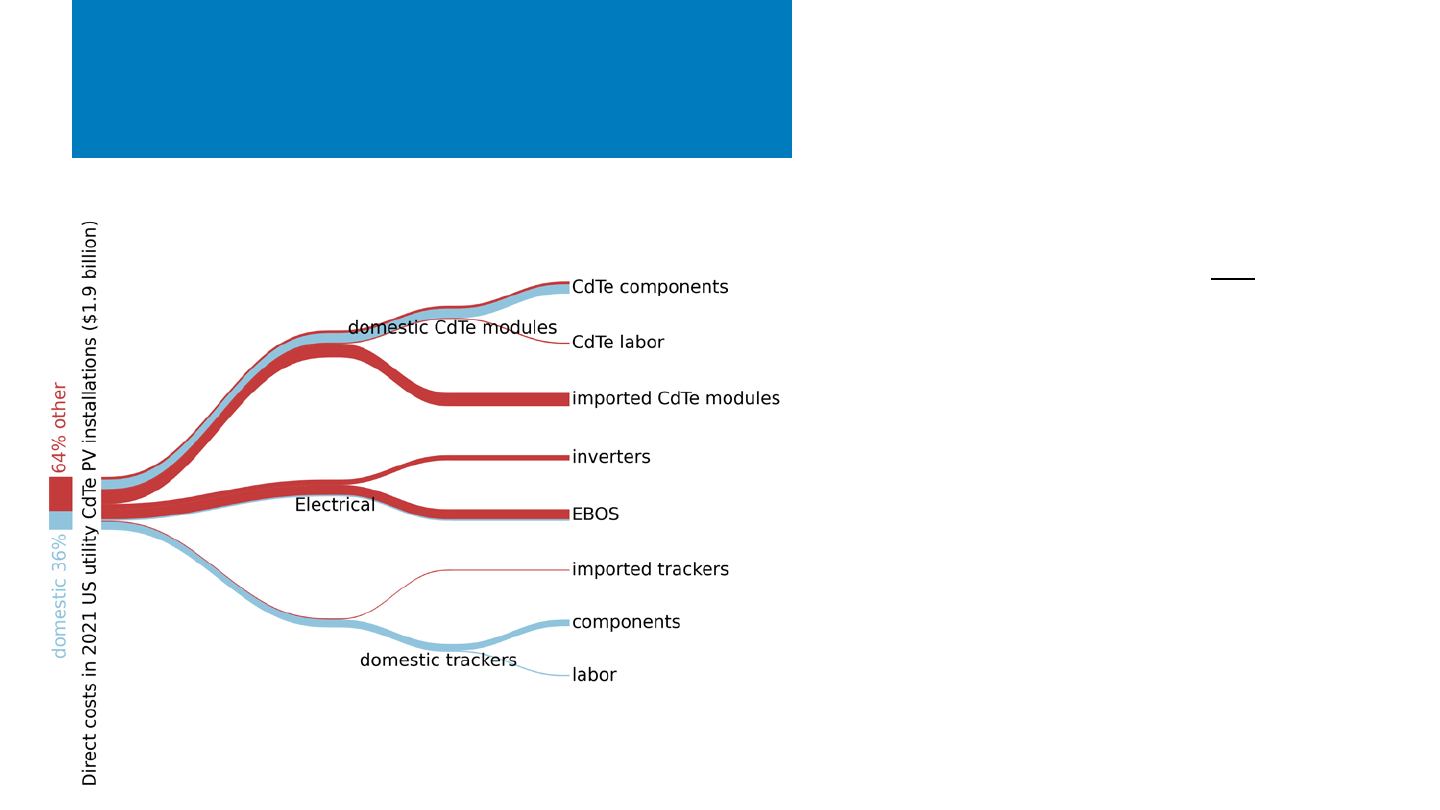
2021 CdTe Utility Systems
(Direct Costs Only)
35%
22%
19%
• Total of 4.7 GW.
• 36% average domestic value; does not
meet criteria for domestic content
bonus.
– This version does not include
indirect costs, steel products, or
domestic CdTe labor.
• Keep in mind, this represents an
average system.
– 60% of a domestic CdTe module.
– 90% of a domestic tracker.
• Most imported value is coming from
inverters, EBOS, and the 40% of CdTe
modules that are imported.
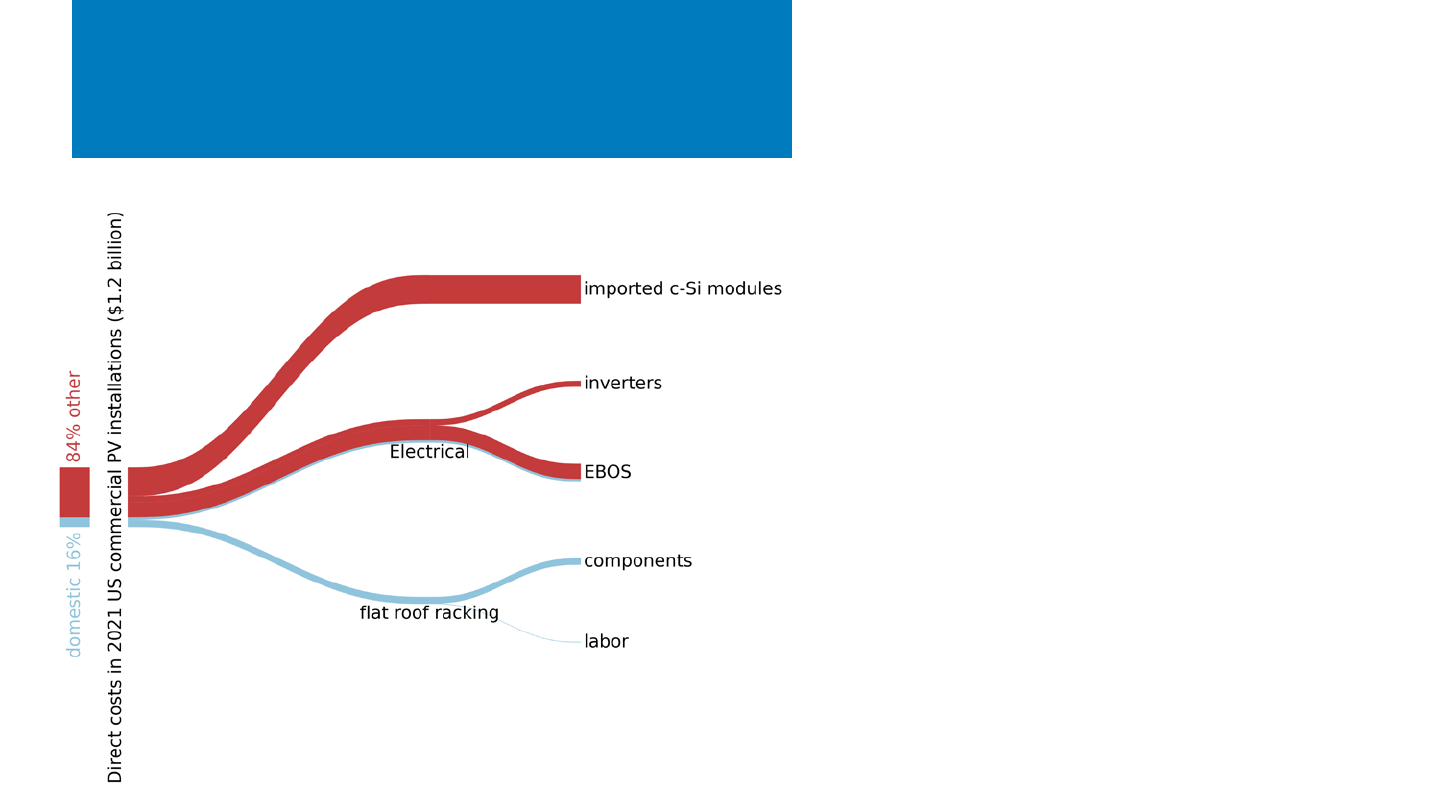
2021 Commercial Systems
(Direct Costs Only)
48%
29%
• Total of 2.4 GW.
• 16% average domestic value;
significantly below criteria for
domestic content bonus.
• Steel products (ground-mount
racking) are not included in this
version, which makes modules and
inverters have a larger impact.
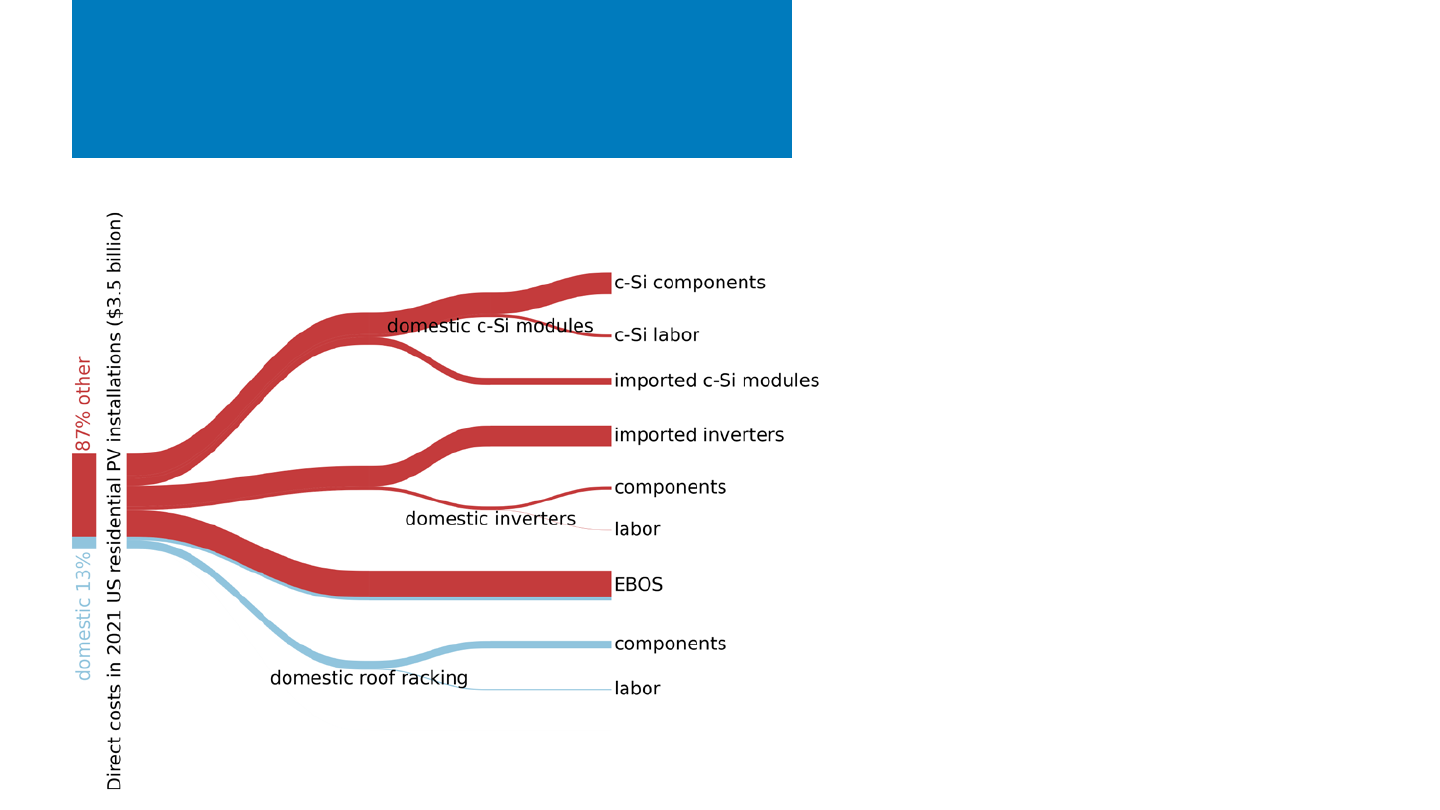
2021 Residential Systems
(Direct Costs Only)
32%
22%
23%
• Total of 4.2 GW.
• 17% average domestic value;
significantly below criteria for
domestic content bonus.
– This percentage includes indirect
costs (no steel products in
residential systems).
• This represents an average system
(i.e., 71% of a domestic c-Si module).
• While 3 GW of these modules are U.S.-
assembled, none of the module
components are domestic.
• The absence of steel products and
greater expense of residential c-Si
modules and inverters contribute to
the large fraction of imported value.
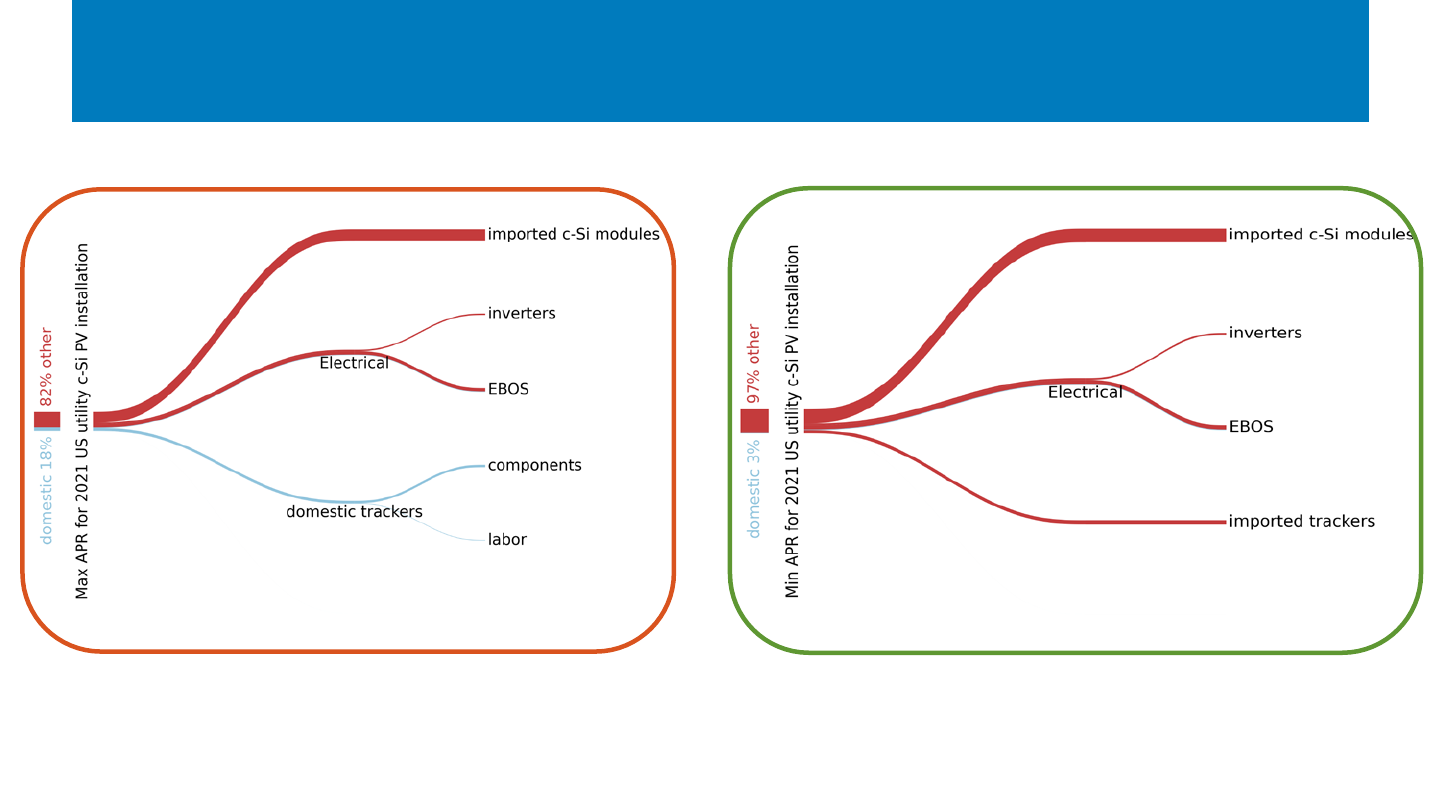
NREL | 79
c-Si Utility Systems: Sourcing Permutations
Maximum domestic content in 2021: 18%
Minimum domestic content in 2021: 3%
These diagrams show how much the domestic content in c-Si utility systems can vary depending on
common 2021 sourcing options. Diagrams use the adjusted percentage rule (APR) and direct costs only.
• Most significant variable: tracker sourcing.
59%
59%
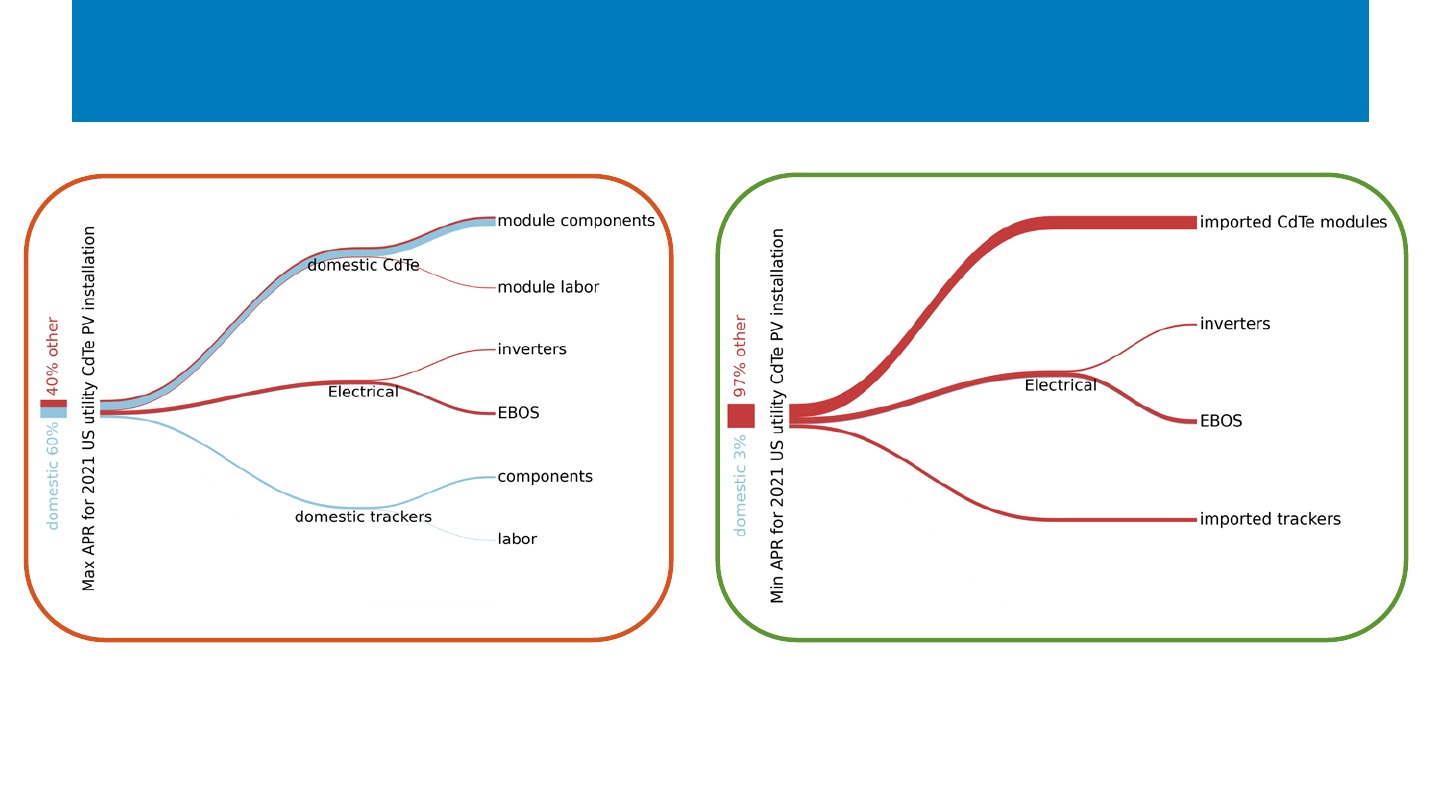
NREL | 80
CdTe Utility Systems: Sourcing Permutations
Maximum domestic content in 2021: 60%
58%
Minimum domestic content in 2021: 3%
57%
These diagrams show how much the domestic content in CdTe utility systems can vary depending on
common 2021 sourcing options. Diagrams use the adjusted percentage rule (APR) and direct costs only.
• Most significant variable: CdTe module sourcing and tracker sourcing.
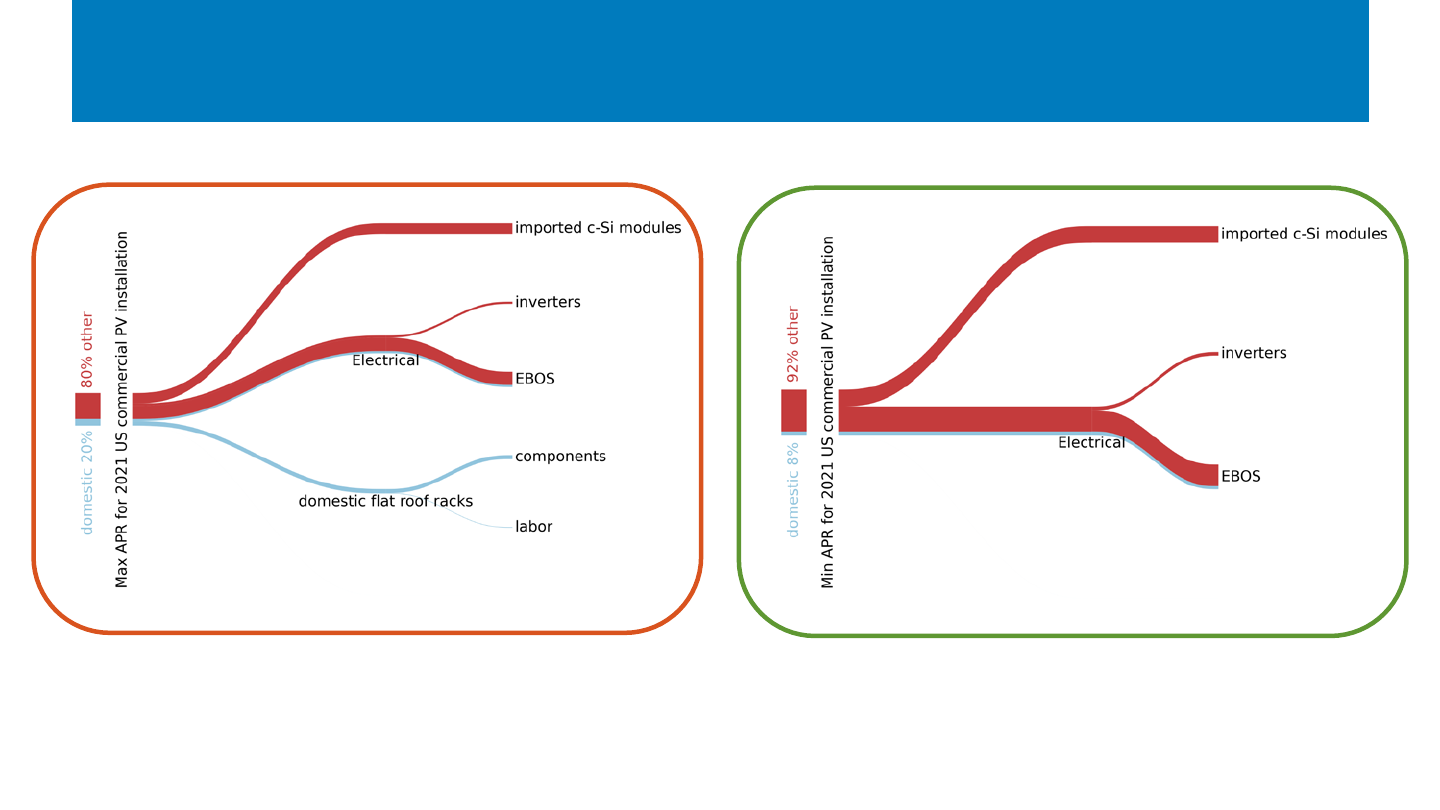
NREL | 81
c-Si Commercial Systems: Racking Permutations
Maximum domestic content in 2021: 20% Minimum domestic content in 2021: 8%
32%
38%
54%
46%
These diagrams show how much the domestic content in c-Si commercial systems can vary based on
common 2021 racking types. Diagrams use the adjusted percentage rule (APR) and direct costs only.
• Most significant variable: type of racking/mounting, since steel products are not counted.
www.nrel.govwww.nrel.gov
Thank You
NREL/PR-7A40-88026
Special thanks to Nate Blair, Daniella Frank, Madeline Geocaris, and Adam Warren.
This work was authored in part by the National Renewable Energy Laboratory, operated by Alliance for
Sustainable Energy, LLC, for the U.S. Department of Energy (DOE) under Contract No. DE-AC36-
08GO28308. Funding provided by the U.S. Department of Energy Office of Energy Efficiency and
Renewable Energy Solar Energy Technologies Office. The views expressed in the article do not
necessarily represent the views of the DOE or the U.S. Government. The U.S. Government retains and
the publisher, by accepting the article for publication, acknowledges that the U.S. Government retains a
nonexclusive, paid-up, irrevocable, worldwide license to publish or reproduce the published form of this
work, or allow others to do so, for U.S. Government purposes.

NREL | 83NREL | 83
List of Acronyms and Abbreviations
AD: antidumping
ac: alternating current
ASP: average selling price
BESS: battery energy storage system
BOS: balance of system
BNEF: Bloomberg New Energy Finance
CAISO: California Independent System Operator
CapEx: capital expenditures
C&I: commercial and industrial
CBP: U.S. Customs and Border Protection
CdTe: cadmium telluride
CPI: consumer price index
c-Si: crystalline silicon
CSP: concentrating solar power
CVD: countervailing
dc: direct current
DOE: U.S. Department of Energy
EBOS: electrical balance of system
EIA: U.S. Energy Information Administration
EPC: engineering, procurement, construction
ERCOT: Electric Reliability Council of Texas
ETF: exchange traded fund
FERC: Federal Energy Regulatory Commission
GW: gigawatt
GWh: gigawatt-hour
H1: first half of year
H2: second half of year
HTS: harmonized tariff schedule
IEA: International Energy Agency
ILR: inverter loading ratio
IRA: Inflation Reduction Act
IRS: Internal Revenue Service
ISO: independent system operator
ITC: investment tax credit
kW: kilowatt
kWh: kilowatt-hour
LBNL: Lawrence Berkeley National Laboratory
LCOE: levelized cost of energy
LMI: low- and moderate-income
MISO: Midcontinent Independent System Operator
mono c-Si: monocrystalline
MMP: modeled market price
MSP: minimum sustainable price
MW: megawatt
MWh: megawatt-hour
NDC: Nationally Determined Contribution
NEM: net energy metering
NREL: National Renewable Energy Laboratory
PPA: power purchase agreement
PTC: production tax credit
PV: photovoltaics
Q: quarter
q/q: quarter 0ver quarter
R&D: research and development
SBOS: structural balance of system
SEIA: Solar Energy Industries Association
SPP: Southwest Power Pool
SREC: solar renewable energy certificate
TAN: Invesco Solar ETF
TOPCon: tunnel oxide passivated contact
TPO: third-party owned
UFLPA: Uyghur Forced Labor Prevention Act
USD: U.S. dollars
W: watt
WRO: withhold release order
y/y: year over year
YTD: year to date
